


Welcome to the Artificial Intelligence Outlook for Forex trading.
VIDEO TRANSCRIPT
U.S. Dollar Index ($DXY)
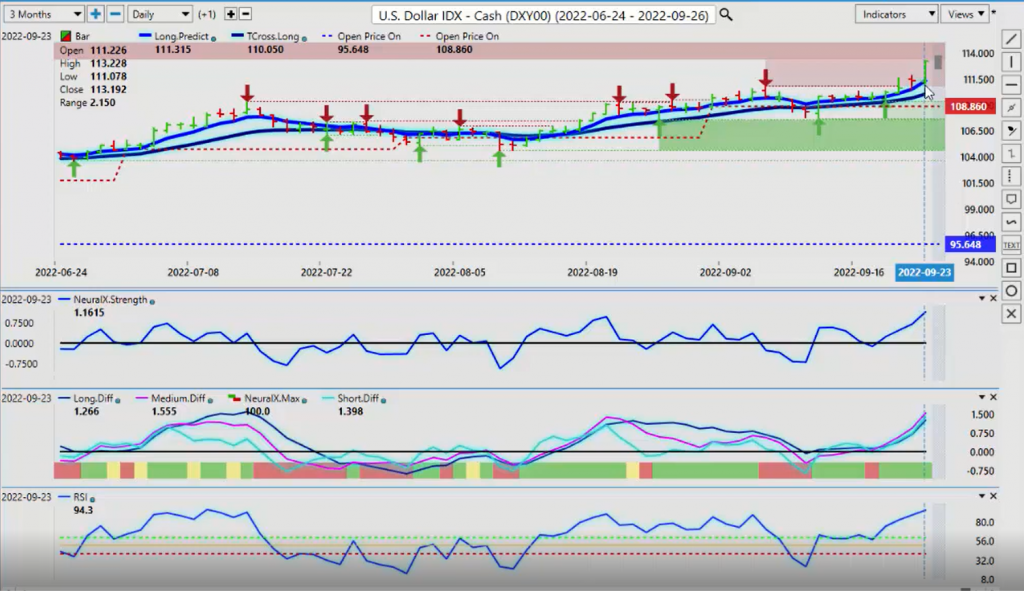
Hello, everyone, and welcome back. My name is Greg Firman, and this is the VantagePoint AI Market Outlook for the week of September the 26th, 2022. Now, to begin this week, we’ll begin where we always do with that very important U.S. Dollar index. Now, after the Fed and the Bank of England, some of the things coming out of the UK, basically, a global risk-off environment is taking hold as the Dollar continues its relentless extent higher. Right now, you can see that we’re holding above the two critical levels that we talked about in last week’s weekly outlook, where you can see I structured the monthly opening price and the yearly opening price onto the VP chart using the VP Plus software, so again, copying the indicator and putting it onto the screen allows me to see two very important levels, where we are in the month and where we are in the overall trend in a year, so with the dollar above both of these two levels, you can see that basically, the entire month we’ve been running along this 108.86 area.
Now, I believe that we can and are likely going to retrace lower this week probably back to our T cross long around the 110, approximately the 110.05 area, but we would first have to break down below 111.31. Now, this would be a retracement. It would not be a trend reversal, because again, nothing goes straight up and nothing goes straight down. The neural index strength is grossly overextended, as is the predicted differences and the predicted RSI in heavily overbought territory. Now, that doesn’t mean it can’t go higher.
It absolutely can, but in most cases, you will see some kind of retracement first, so again, those two points would be 111.31 and the T cross long at 110.05.
Gold
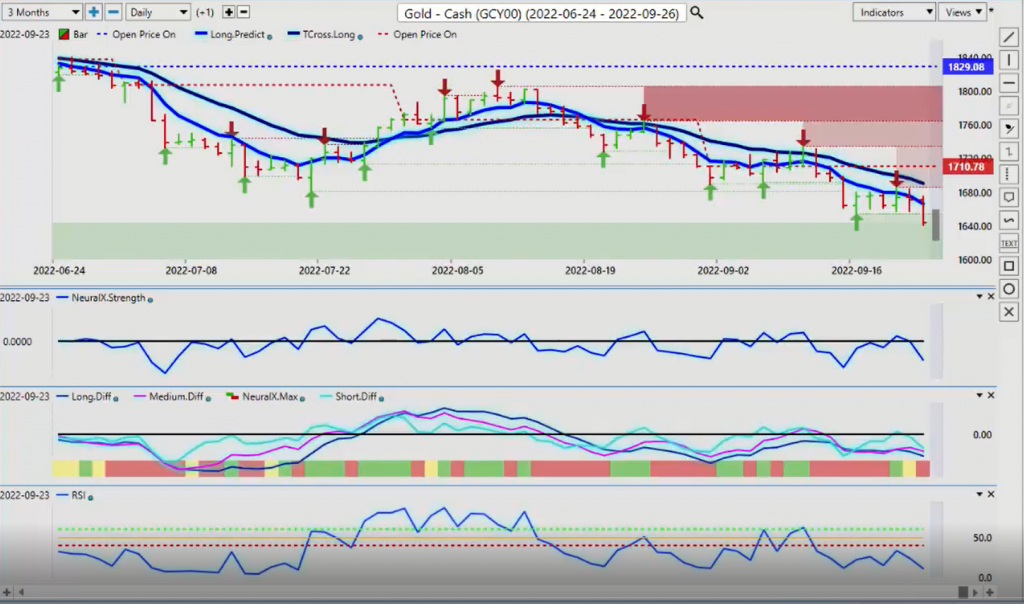
Now, this relentless strength in the U.S. Dollar obviously is really putting pressure on gold prices. They’re unable to rally this entire month briefly, again, getting above the monthly opening price, but unable to break free and clear of the VantagePoint T cross long, so this entire previous week, you can see we’re running along that long predicted and not even testing the T cross long. That key level is going to come in at 1690, the immediate long predicted, 1666. This would be a potential short area for gold because again, I don’t think we’re going to see any strong buying in gold going into the end of the month. Now, with this most recent threat, coming out of Russia, we still can’t rule out that gold couldn’t rebound based on that scenario.
Putin now talking about potentially bringing in nukes if need be, don’t think we should be taking that lightly, so again, we could see some kind of bounce here on gold, but we’ve lost that verified support low, that area coming down in here around 1634, but the indicators are rolling back over to the downside after a minor retracement, so again, watch our key levels, but for Monday, the predicted high, 1658, but our long predicted, 1666. That’s the level I would focus on, all stop’s above 1690. Now, energy prices coming under a significant selling pressure, again, as a recession appears inevitable now, so light, sweet crude oil, once again, we can see the structure of this, that were below our monthly opening price at 88.41, but we remain above the yearly opening price, so very structurally different than the gold contract. Once again, still positive on the year, but not by a lot here, so again, we’ll be watching this one very closely, but those primary indicators are pointing for further losses in oil, and when we do a comparative on the side of natural gas, it’s unlikely we’re going to see much of a difference there. You can see that natural gas, also losing its key levels.
Crude Oil
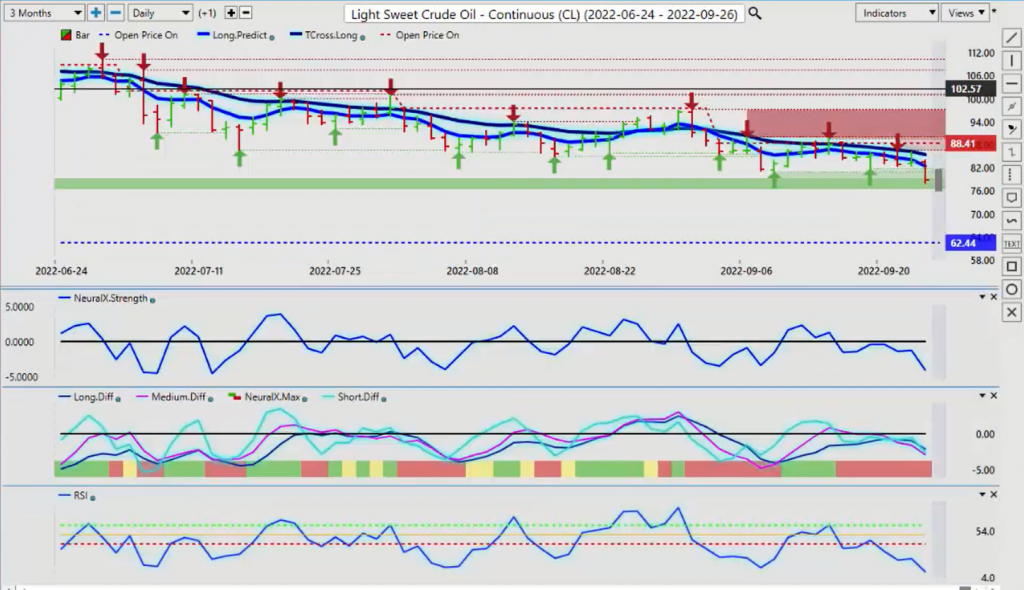
Now, in this particular case, again, you can see the similarities between light, sweet crude oil and natural gas. We’re holding below the monthly opening price, but we’re above the yearly opening price, so the primary trend on these two is still in, technically, they’re both still very much positive on the year, but they’re now coming under pressure largely, in my respectful opinion, because of this dollar strength, so any hiccup in the dollar strength, we could see these two rebound. Right now, light, sweet crude oil, still under pressure.
Natural Gas
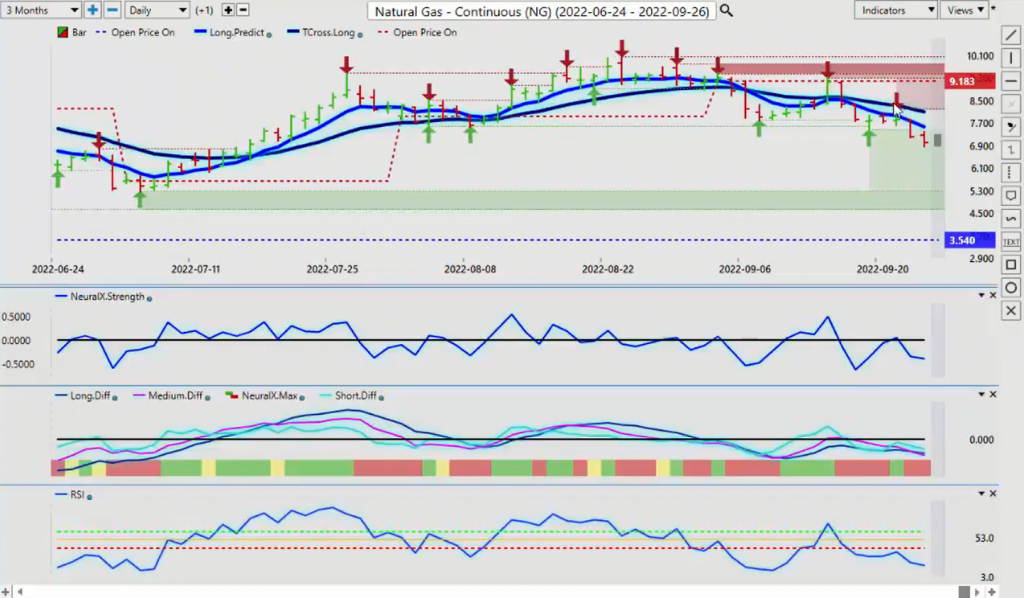
Natural gas, we’re at 8.08 and 7.56. There are two upside pivot points, but again, at this particular time, I think I would want to be above that monthly opening price to confirm that there’s still any kind of real bullish momentum here.
Bitcoin
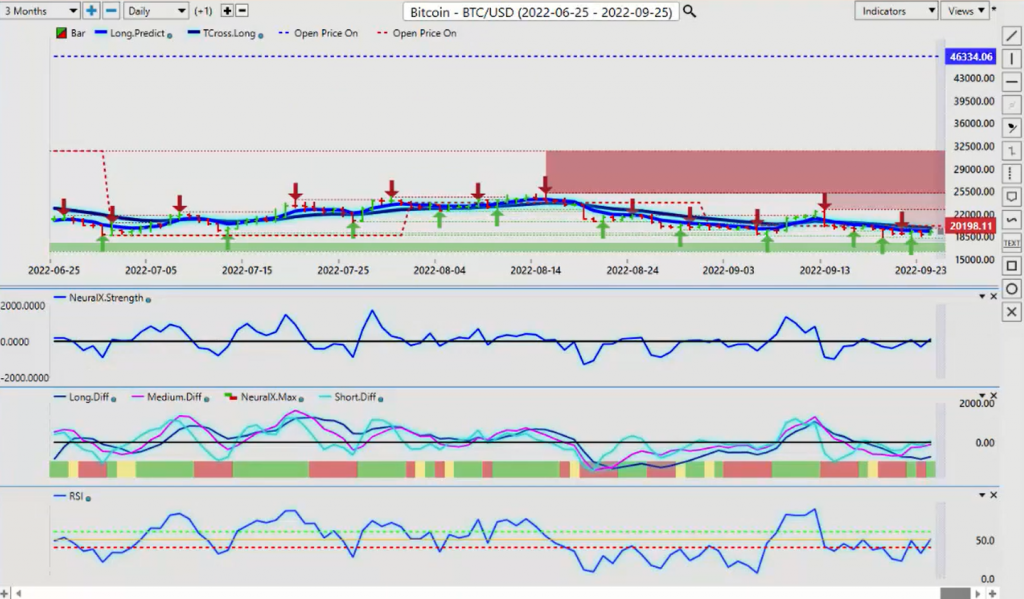
Now, as we look at, once again, Bitcoin, one thing I will point out with some of the negative press that Bitcoin is getting, I think we do need to have a very basic discussion on what Bitcoin’s actually really done this month compared to the stock market. Now, the S&P 500 has gone up about four and a half percent this month, and obviously, it’s getting killed now, but Bitcoin has actually gone up about 13.5% still this month. It still had a very good month. Now, it’s under selling pressure at the current time, and we are running sideways, but in most cases, over the previous years, Bitcoin has done very well in the month of October. Late September, early October, and then that’ll run through to about early November, so that’s seasonal play there. I would still be watching this very closely because again, even with the stock market selling off the way it is, Bitcoin is basically running sideways in this channel, running down to about the 17,000 mark, a little under, about 18,222.
We’ve got additional verified support down here, around 18,680. Little bit lower there, but again, basically a three-month channel is what we’re looking at. Now, if we look at this from, again, one year ago, you can see that that seasonality is right there, guys, which is on September the 30th. Again, only in my respectful opinion, there’s been a lot of negative press about Bitcoin that I don’t think is founded. When we look at the annualized returns over the last 10 years, 238% per year are the annualized returns, so again, your closest asset class to that would be the Nasdaq, so keep a close eye on this because I don’t think Bitcoin is going to break down as low as what some people are suggesting.
S&P 500 Index
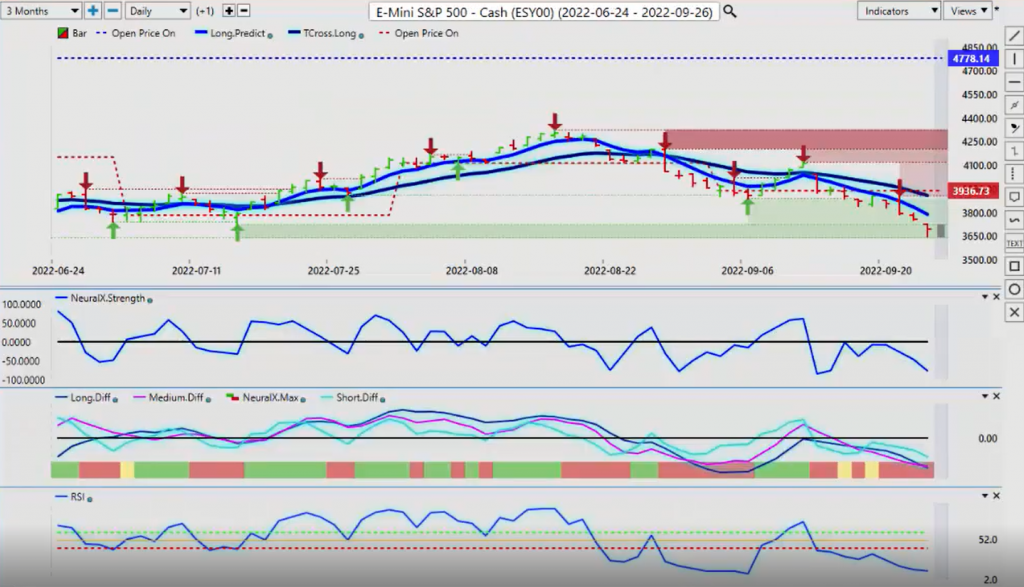
Now, when we look at the S&P 500, again, the equity market’s under a lot of selling pressure last week with the Feds, some of the stuff coming out of the UK, Russia. We’ve got potentially an issue with China and Taiwan yet again, so none of these are positives for the stock market, but if there is any positive developments with Russia-Ukraine war, or China backs down away from Taiwan again, then these can boost equity markets very quickly, but again, with the stock market being hit like this, it’s really affecting our Forex pairs. The Euro’s down, the Pound’s down, Aussie, New Zealand, the CAD. They’re all getting hit because of this, so if there’s any turnaround in the stock market, then we can also see things like U.S./Canada go lower, Aussie/U.S. go higher, New Zealand/U.S. go higher, maybe a rebound in Pound/Dollar and Euro/U.S.. These are all possibilities, but there isn’t a lot to support that right now, but what I will say is keep a very, very close eye on this.
There is indirectly a buy signal starting to form here with the predicted difference, but there are so many fundamentals against the stocks that I don’t know if that can complete or not, but we’ll keep a close eye on it right now, but your key levels that we must overtake, the first one, the long predicted, 3785, T cross long, 3904, right? At the current time, the predicted difference is the only thing that’s warning. There may not be a lot of downside here. 3636 is the level I would watch personally. If we get down below that, we potentially have a very, very serious problem.
One of the ways I can look at that is I can go like this on the monthly, bring the monthly in the VP Plus, and then I can go back, say a year, and then I can see these levels down here, right there, 3636, and you can see this month already. We’ve come down and kissed it and bounced off of it, so the verified support and resistance zones in the VP Plus are now, you have the capability of using not just the daily time frame, but the weekly and the monthly, so when I go back, I can very quickly identify what this is. It’s the June low, so that June low, if we lose that, I fear that we would’ve a much, much deeper move to the downside.
Euro versus U.S. Dollar
Now, as we move into some of our main Forex pairs for next week, all eyes have basically been on the Euro/U.S. pair. Now, with the Euro, again, we don’t have a lot of support down here.
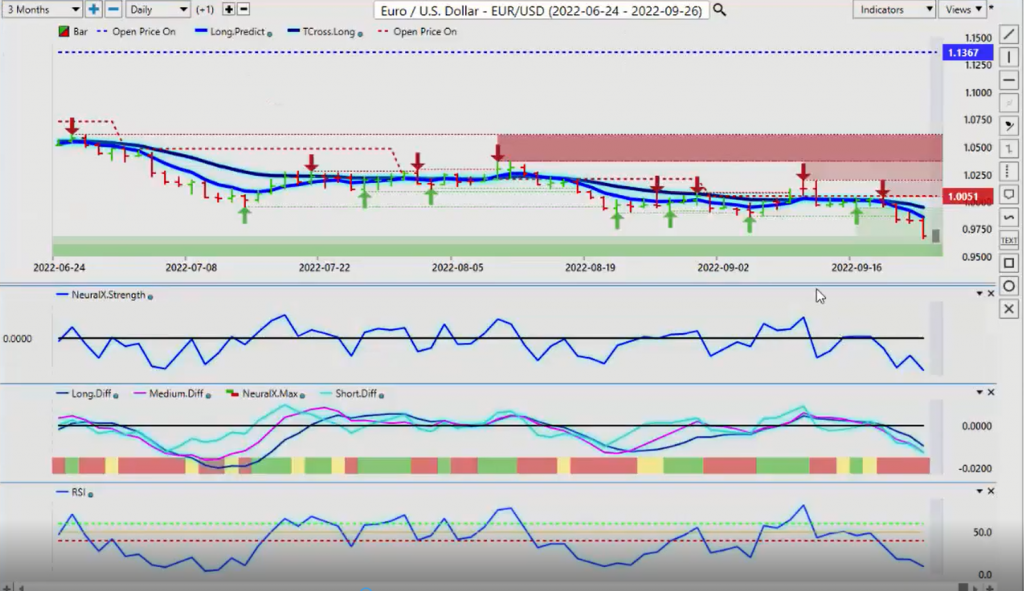
We’re in uncharted waters, particularly on the Pound/Dollar, but whenever we have these big moves in a single week, then very often, there’s a corrective move. When we’re looking at this right now, the structure of the Euro currency, the Euro/U.S. pair, we’re below the yearly opening price, 1.1367. The month, we’ve been above it a few times earlier in the month, but then we’ve fallen back down again. You can see that this is a very, very powerful setup to use in your VantagePoint software, because again, that monthly opening price, a lot of people are debating back and forth different indicators, different trade setups, arguing about this, arguing about that. We don’t want to get into that kind of stuff here, guys.
We just want to identify price and intermarket correlations. The intermarket correlation here is the Dollar Index. Indisputably, it’s a 99.9% inverse correlation, so if the Dollar Index, the DXY continues to advance, the Euro doesn’t stand a chance, but if the Dollar Index starts a corrective phase, then the Euro can rise. Those two levels, it would rise to, I would respectfully submit, would be 0.9855 and 0.9946. The other thing I’ve noticed here is when the predicted moving average is unable to cross above the monthly opening price, we’ve got a very serious problem here, so again, we’re likely going to continue lower.
U.S. Dollar versus Swiss Franc
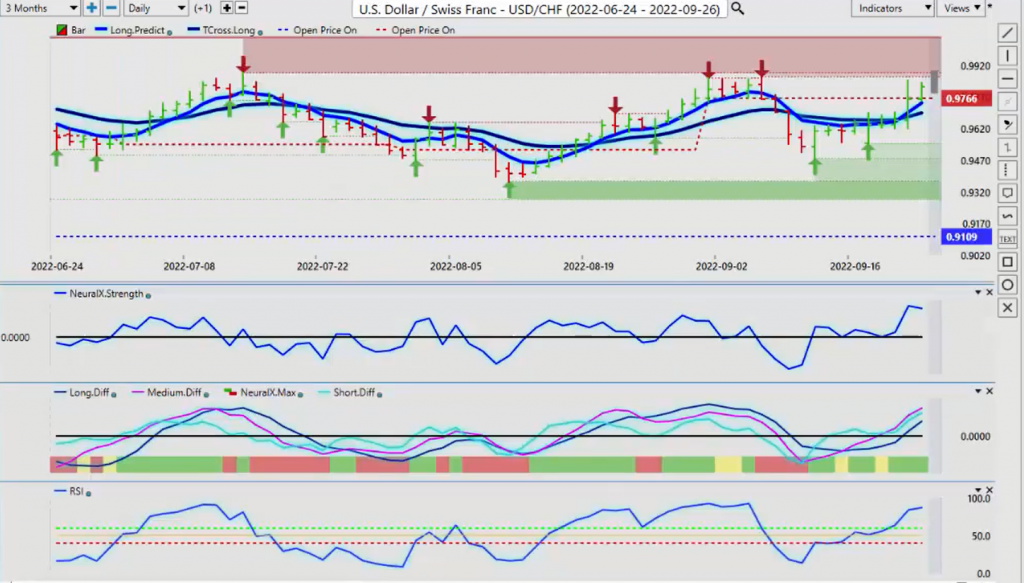
The indicators are oversold, but again, the market, these types of markets are not concerned with overbought and oversold. They will continue to sell for as long as they possibly can, so a clear bearish bias, but I am expecting, again, a corrective move on that Dollar Index at the very least. Now, with the U.S./Swiss Franc, I would consider this to be one of the laggards in the Forex market, that it is starting to move. We talked about it last week. We’ve advanced over our T cross long, and on top of that, which is particularly interesting, we’ve crossed the monthly opening price, so now, we’re above the yearly opening price, we’re above the monthly price, and we’re above our VantagePoint long predicted and T cross long, but we must stay above that monthly opening price, in my respectful opinion, and more specifically, staying above 0.9695 next week, so your entry points for longs are pretty clear-cut here.
The first one comes in at 0.9744. The predicted low is coming in at 0.9794. I, again, will respectfully submit using the predicted moving averages as a pivot level or an entry point in your trade. Trading will make a very big difference, and it allows you to shake loose this Monday volatility. Monday, Tuesday reversal, we talk about that in the VantagePoint Live Training Room.
I’ve discussed that at the seminars in Tampa. It’s a phenomenon, from Monday to Tuesday, so if you see a big rally on the Dollar on Monday, chances are it’s going to go lower on Tuesday, and a lot of systems and a lot of traders get caught in this, between Monday and Tuesday, so be very, very cautious, but right, now the indicators are pointing higher. The only slight concern here is that the Swiss Franc, they’re raising rates also now, and it too, is a risk-off currency, so be cautious with this one, but there is a long in sight. I think I would be more comfortable with this one when we clear the verified zone at the high of 0.9869 and start moving back up above parody, which I think we may be able to do by the end of the month.
British Pound versus U.S. Dollar
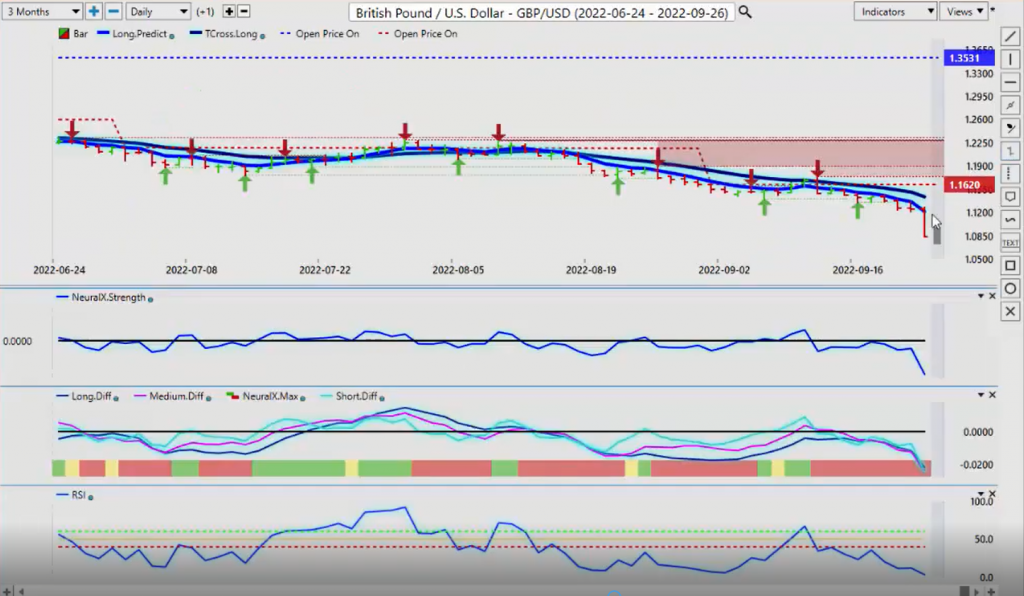
Now, with the Pound/Dollar, again, there is no bottom in sight.
I’ve probably had 40 emails on this saying, “Okay, can we go along here? Are we good to go along here?” Now, Pound’s never been at that. Well, those emails were back here at the low around the 1.1355 area, and with my own direct clients, I had stated very clearly, do not try and pick a bottom on this thing. There is a ton of negatives related to the Pound, and the new administration or the new leader in the UK has done some things over this past week that the market didn’t like very much, and the Pound is suffering because of it, so we’ll see where this goes, but right now, I personally, in my trading career have never seen the Pound/Dollar at these levels, so I am not about to try and pick a bottom on this.
Right now, the indicators are grossly oversold indisputably, but that doesn’t mean the market is not going to push this lower. Our retracement points will be our T cross long, but once again, you see this exact same setup along here, where we’re running along the monthly opening price, the predicted moving average crossed over the monthly opening price right here. When it did that, this was simply too much, and now, both the predicted moving averages are below the yearly opening price, the monthly opening price, so it’s warning that there’s going to be likely more pain ahead next week for the Pound, but I am expecting, of course, some kind of corrective move. I believe we will get that when we get the same corrective move on the S&P 500. Now, when we look at the Dollar/Yen going into next week, once again, these central banks are really something else, is me being nice.
U.S. Dollar versus Japanese Yen
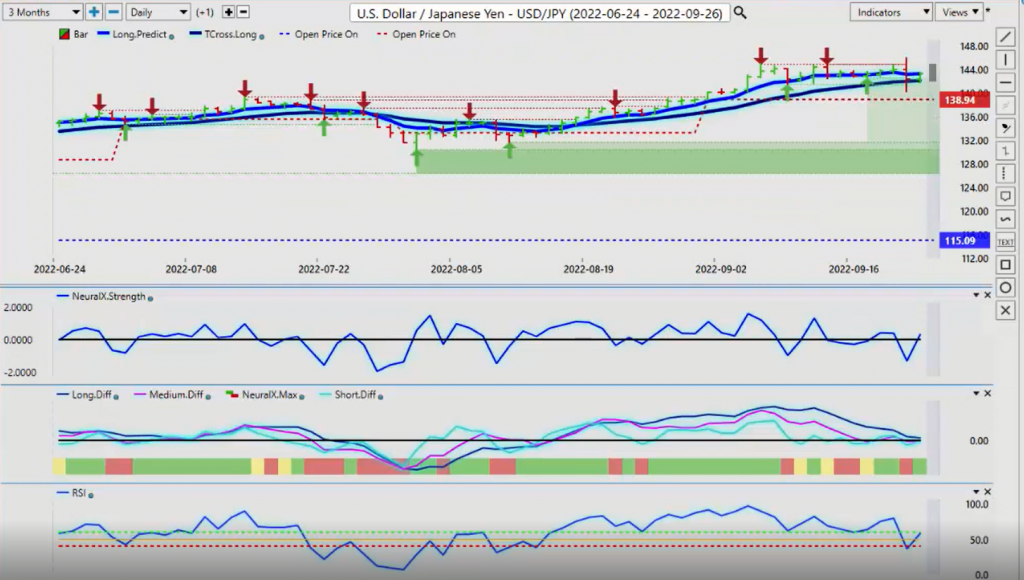
They intervened or tried verbally intervened on the Dollar/Yen when it was near the 100 level earlier this year and said they will not let it go below there and they are intervening or in the currency markets, while last week they had to intervene because now they’re saying the currency is too weak, and it’s hurting them. Well, if you had to just stayed out of it in the first place, the Fed we knew was likely going to be hiking this year. The Yen would’ve appreciated. The Dollar/Yen pair would’ve moved higher on its own, but they interfered, and it sent this thing to the moon. Now, they’re not happy about that, but the structure of this, you can see, the highlight in blue is the yearly opening price.
The highlight in red is the monthly opening price, so if you’re looking at longs on this pair or shorts, expect a lot of volatility. The indicators are warning that the Dollar/Yen is getting ready to go higher again. This would be poetic justice to the Bank of Japan for interfering with this, and I believe the market is going to punish them for this. The probability that it breaks higher is still very strong, unless they take some type of aggressive measure, which I have no control over, so whenever I’m in a situation like this, I usually recommend to avoid pairs like this, because again, we don’t know what the Bank of Japan’s plan is. We know that they’ve already intervened last week and they said they’ll do it again, so that you’re going to likely see some very wild spikes on anything related to Japan, Dollar/Yen, Euro/Yen, Pound/Yen, CAD/Yen.
Be very, very cautious with them next week.
U.S. Dollar versus Canadian Dollar
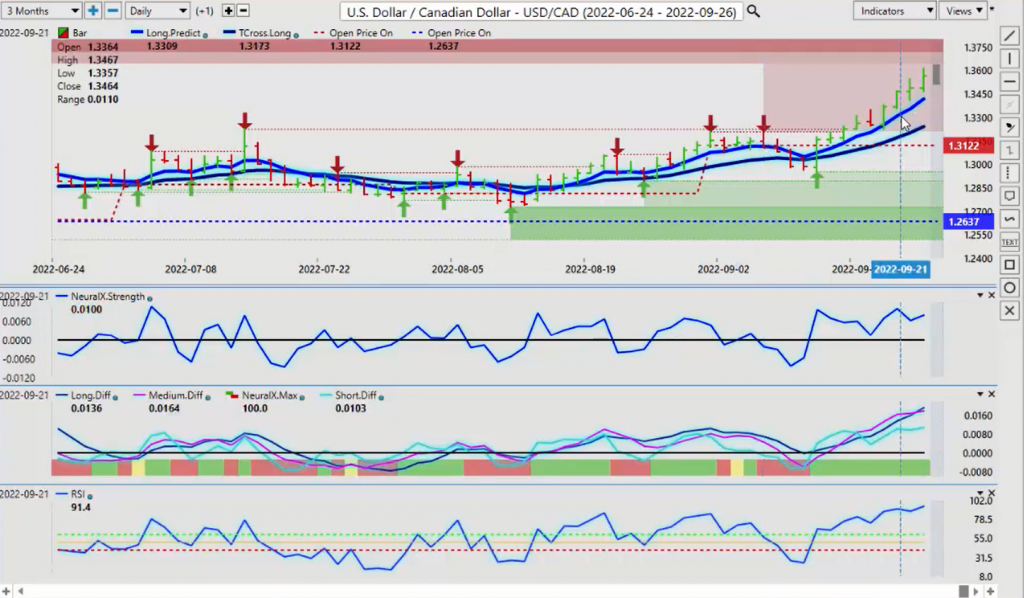
Now, the Canadian Dollar, again, we are looking at this area. This level is broke around, the larger level around 1.3280. The weaker CPI number, the falling energy prices, slowing economy in Canada, this is just too much for the Canadian Dollar, and it’s broken higher. Now, we could see this higher towards the 1.38 area, but if there’s any kind of corrective move, if stocks turn around and go higher, the U.S./CAD will abruptly move lower.
The intermarket correlation is shocking, but once again, when we look at this trade setup here and we look at the market struggling with the … We’re above the yearly opening price 1.2637 and 1.3122 is the predicted moving average, crossed over the monthly opening price. You can see that every single day, you’ve got a long trade off of the blue line, the long predicted, the predicted moving average by itself, so again, we’ll continue to monitor it, the two levels. Again, we’ve got a pretty significant gap, 1.3513. The predicted moving average is 1.3418.
I would strongly advise that you wait for 1.3418. Monday, Tuesday reversal with this pair is 90% of the time. Whatever it does on Monday, it does the opposite on Tuesday, so be careful with it, but in my respectful opinion, there’s too much of a gap here for me to use the predicted low in Monday’s trading. I will hold out either way for the blue line, and then stop-loss placement would be below the T cross long at 1.3243.
Australian Dollar versus U.S. Dollar
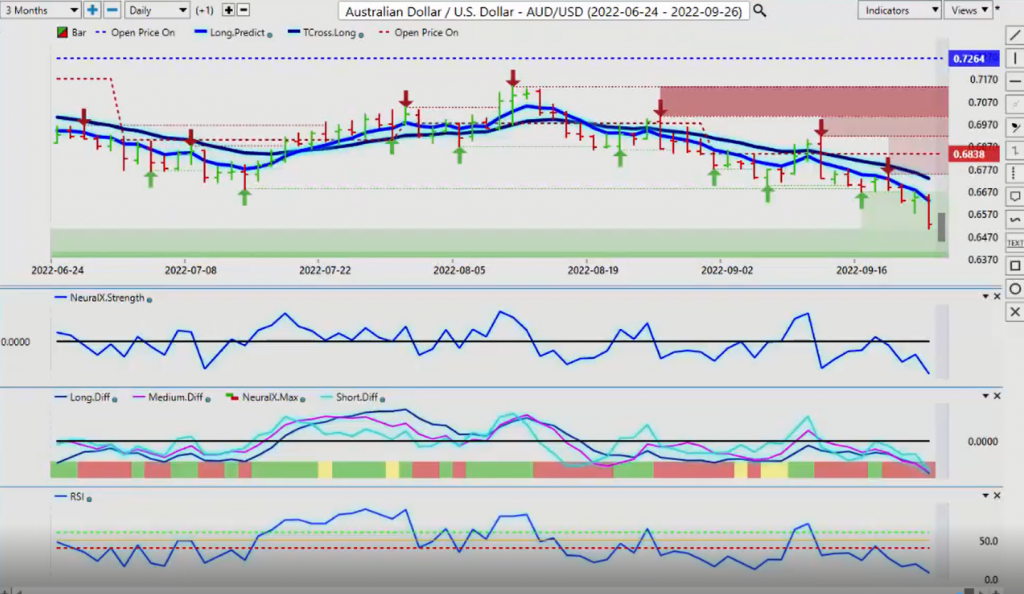
Now, the Aussie and the Kiwi, once again, both in significant selling pressure here.
If we come back here, once again, I can do my little trick here with VP Plus and go to the monthly, go back over a year, and as you can see, I have nothing here, guys. If I go back maybe two, three years, this is that infamous day in March of 2020 when the Fed went crazy with rate cuts and everything else. That low was 0.5510. It’s quite frightening, actually, that we’re starting to move towards that area again, but again, in my respectful opinion, I don’t believe we will hit that level, that the Aussie will find relief before then, but I will also not dispute that there’s very little support down here to stop it, so what will help the Aussie more than anything, guys, is the stock market turning around, but if we lose 3636 on the S&P 500, currencies like the Aussie, the New Zealand, and the CAD could literally go into free fall, so just keep a very, very close eye on that.
New Zealand Dollar versus U.S. Dollar
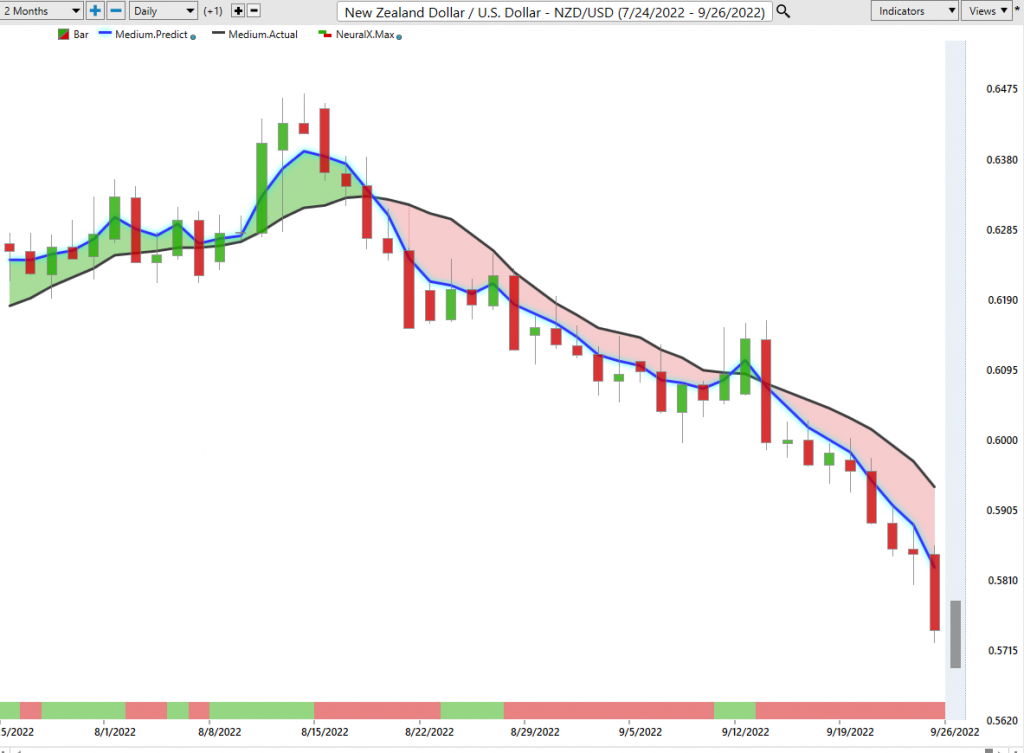
The New Zealand currency is basically the same.
We’ve got a strong downward signal. We’re in oversold territory, but it’s going to come down. The intermarket correlations will dictate what happens with a number of these Forex pairs next week and for the remainder of the calendar year, actually. With that said, this is the VantagePoint AI Market Outlook for the week of September the 26th, 2022.

