


Welcome to the Artificial Intelligence Outlook for Forex trading.
VIDEO TRANSCRIPT
Hello everyone and welcome back. My name is Greg Ferman, and this is the VantagePoint AI market outlook for the week of March the 1st, 2021. Now, to get started this week, we’re going to begin where we always do, with that very important U.S. dollar index. But first, we’re going to look at the indicators we’re using this week.
We’re using bars, not candles, our long-term crossover, our long-term predicted difference, our medium-term predicted difference, our neural index with the neural index strength, our point in time, which we will use and set to the weekly opening price, our short-term predicted difference. Triple EMA cross, again, modified under these very volatile conditions where I’ve removed the shorter-term crossovers and sticking with our T cross long, and of course, very, very critical, verified support and resistance zones.
U.S. Dollar Index
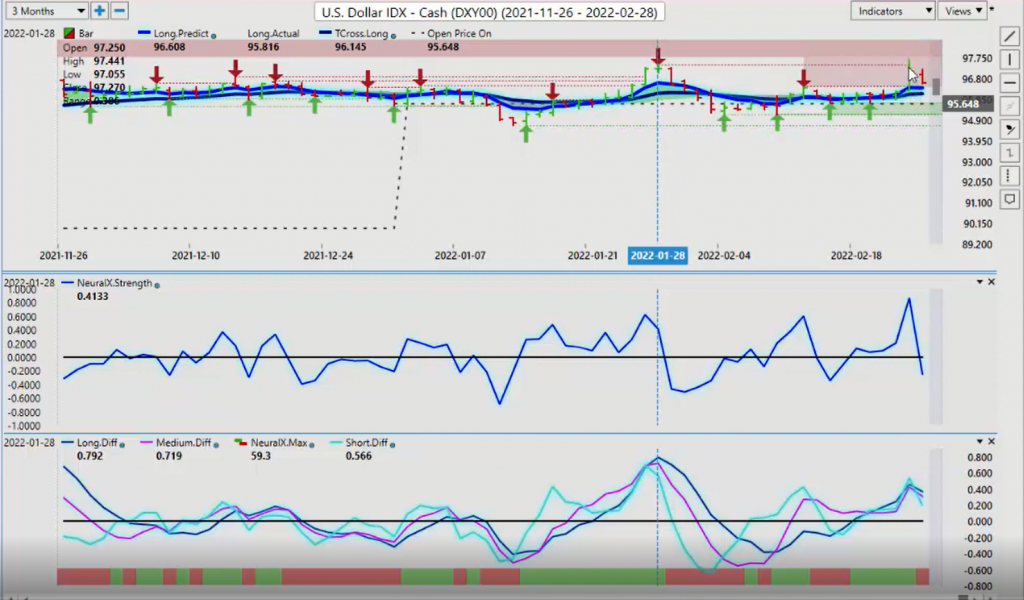
Now, as we look at the dollar, the dollar did make a big move this week with that seasonality that I’ve been talking about. However, we have failed yet again at this, again, the verified resistance high coming in at 97.44. You can see that we’ve come right up to that level, but we could not close above it. Then we sold off back down again on Friday. Now, we are holding very firmly, I might add, above the VantagePoint T cross long.
Now, that point in time is also there too. Our yearly opening price at 95.64, 96.12, and our long predicted, which is our long-term crossover removing the standard moving average and only using that predicted moving average. Looking at that, we can see that we’re holding above all three of our main support levels. If the dollar is going to turn lower, we must close below that yearly opening price at 95.64. Our neural index strength to begin the week is pointing down.
But once again here, just full disclaimer, it is very, very difficult to anticipate what the next move is with Russia and Ukraine. Again, that is going to be a driving factor for both bulls and bears all week long in just about every single market, but the dollar does remain firm and the biased is higher until approximately the end of March, where that known seasonality kicks in and the dollar loses most of its ground. Now, our neural index is down. Our predicted differences are pointing down. Both of which suggest that the dollar is cooling off here.
Gold
Now, when we look at a comparable to the U.S. dollar index, of course we would look no further than gold. Now, when we’re looking at gold going into next week’s trading, obviously gold has got a significant push up on this conflict between Russia and the Ukraine, but you can see as quickly as money goes into gold, it comes out just as quickly. Again, we are holding this year above the yearly opening price, 1829. This is again a trend-determining non-indicator guys. What I mean by that is simple.
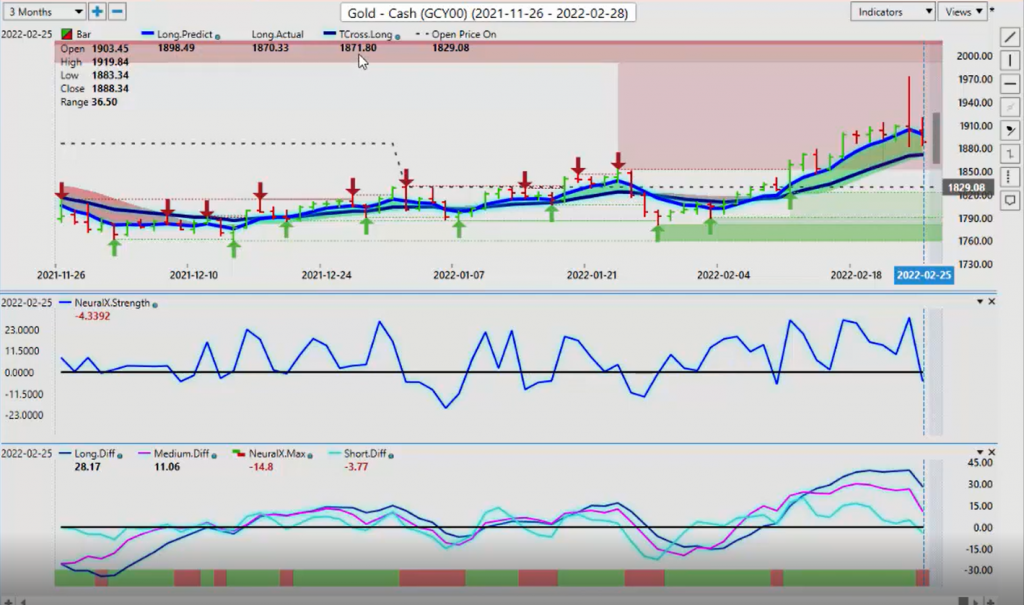
People will debate all day long, bulls and bears will be fighting it out all day long, different websites. You can see them arguing, “My indicator’s better than yours.” What we look for is to remove that back and forth argument and just say, “Look, we’re above the yearly opening price and gold is bullish on the year.” Gold has not had it great. The last few years have not been great for gold. Got a little bump from COVID, but it’s hanging in there.
Right now, when we look at this, I have my three main supports that I can and look at. Now, our first one is our long predicted at 1889. We’ve closed below that. Then we have our T cross long coming in at 1871 and our yearly opening price at 1829. The theory here is long while above 1829. Then we use the VP indicators to guide us through this. Now, right now, they are absolutely pointing down. Again, there’s not going to be any shortage of volatility next week.
I debated whether I would do the weekly outlook after the market opened on Monday, because now Putin’s talking about potentially using … or he is got the nukes on standby. That’s not a positive here, guys, for the gold bears. That actually will likely fuel gold bulls instead. We’ll see what comes out of this, but right now the initial move is pointing down. Now, there is a side note of a positive there too, that Ukraine and Russia are going to meet and they’re going to discuss this, but I don’t think there’ll be much of a discussion.
I think Putin will be it’s my way or the highway or else. Again, I could be wrong. We’ll see. For now, we know where these main levels are and we have heightened volatility in what should be a very serious risk-off scenario, all of which supports gold.
S&P 500 Index
Now, when we look at the S&P 500, and we look a little bit closer at the S&P just to dispel some of these myths, like people saying it’s bullish, it’s bearish, it’s bearish, guys.
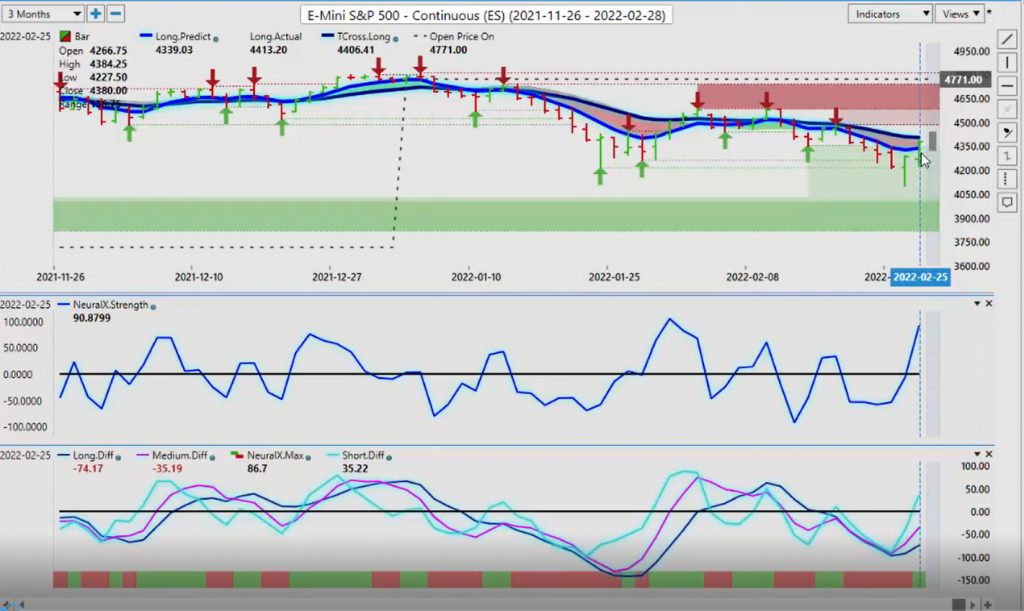
This is probably the first year in a very long time that the S&P 500 has not held above the yearly opening price in the month of January. If it was going to hold, that’s where it was going to be, and it didn’t, and we’ve been sliding lower. Now, with some good news coming out of this situation in Europe on Thursday and Friday, you can see that equities immediately recovered, but they stopped dead on the T cross long at 4406. Our yearly opening price is 4771.
Whenever somebody tries to sell you that the stocks are bullish, the answer is no, they’re currently not. Most of those individual stocks you’re trading, they’re going to follow the major global indexes. If they’re not doing well, the individual stocks predominantly are not doing well. Again, we look at our three main resistance points. We’ve got our long predicted at 4339. Then we go to our T cross long at 4406 and then our major resistance is 4771.
Now, we can buy corrective moves like we’ve seen last week. I predominantly buy those corrective moves only on Tuesdays and Wednesdays. The reason I do that is because that’s the safety part of the week. I don’t like longs or shorts on Monday, Thursday, and Friday can be very, very, very sketchy with this European conflict. Again, there’s very little supporting stocks right now, but it doesn’t mean they can’t go higher here, guys.
We just have to clean up some of this mess between Russia and Ukraine and then we could see stocks again moving higher. Make no mistake, the reason they turned higher, the individual stocks and the index, is because of that positive news coming out of Europe. It just seems like every time we get one positive, there’s two negatives that follow shortly thereafter and telling the world that the nukes are on standby I think we could see a very, very choppy open to say the least.
Bitcoin
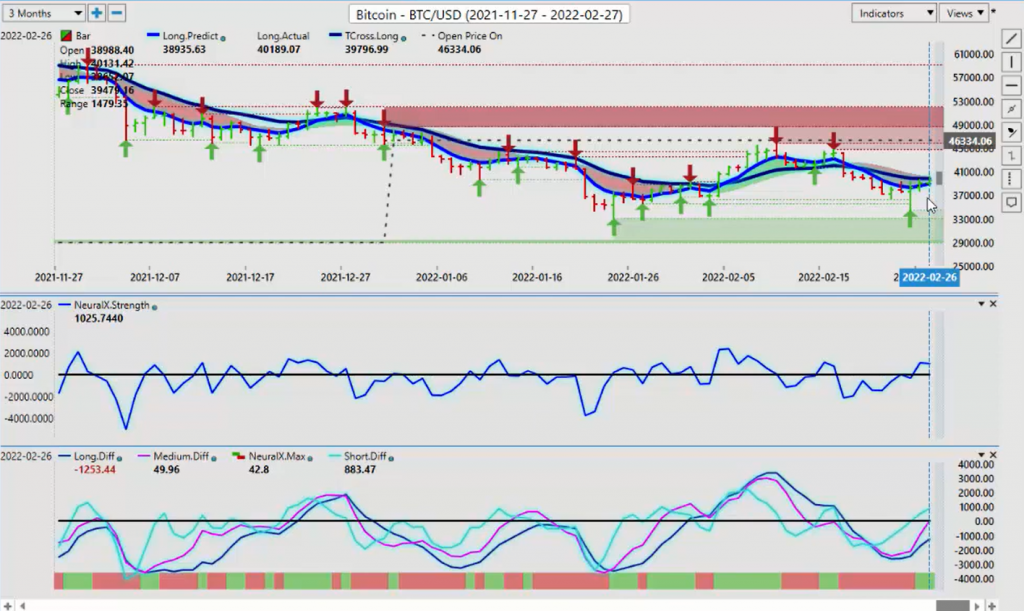
Now, when we look at Bitcoin, once again, Bitcoin is still hanging in there. We’re holding above that support that I’ve been talking about. That support low is coming in at or about the 33,000 mark. Again, we’re coming soon as we move in close to this, we’ve got buyers. Now, at the current time, once again, we’ve got to clear these levels. Obviously we can see that Bitcoin is below its yearly opening price, but the very, very high correlation Bitcoin has to the global stock indexes is becoming evident here.
Again, if stocks can push higher and stay higher, get above that key VantagePoint level, then it would be reasonable to suggest that Bitcoin will do exactly the same thing. I would respectfully submit to everybody that if you’re looking to get back on the Bitcoin bandwagon here, that’s okay to do so, but we’ve just got to make sure that stocks are doing okay.
If things settle down in Europe a little bit, if there’s some positive developments coming out of negotiations between the Ukraine and Russia, that will not only help stocks, it will indirectly help Bitcoin. Our indicators here, our neural index strength, is above the zero line. The neural index is positive and our predicted differences measuring that medium-term crossover against the long-term crossover and the short-term crossover using the differences, they’re pointing higher.
Again, it’s corrective in nature. Our long predicted we’ve cleared, but our T cross long, 39,796, we must get above this level. We still will have the yearly opening price at 46,334. I personally have buy limit orders sitting just above that number. As soon as this bearish move, assuming that it does end, when it does, then I’ll be sitting there ready to take this. Again, the first hurdle is we must get past the VP level at 39,796.
Crude Oil
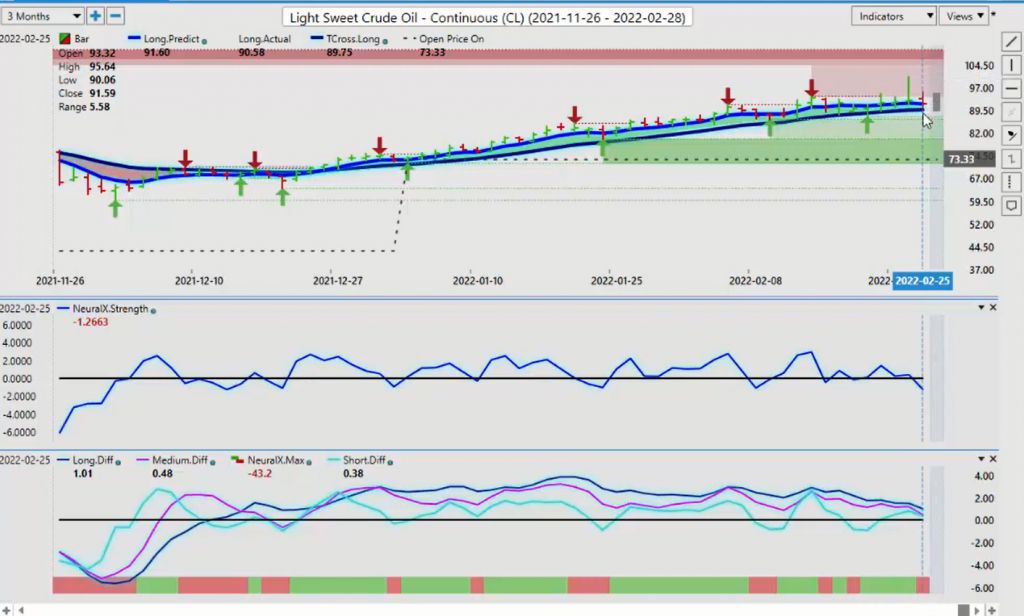
Now, with oil, once again, oil is really bouncing around here, getting some big calls out of Goldman Sachs and some of these places for $120 a barrel. I’m not in that camp, guys. I’ve heard it from them before. Whenever they say that, I usually take the other side of that trade. If they recommend a short oil, I buy it. If they recommend to sell it, I’ll buy it and vice versa, because again, very seldomly do these companies want to do things that benefit the masses.
When we look at this via the VP software, once again, we are clearly and firmly above the yearly opening price, but our neural index is pointing down. Our predicted differences, all three of them, are sloping and pointing down. Our neural index has gone from green to red. This is suggesting that we could actually break below the VantagePoint T cross long at 89.75. If we do, then we are likely to target the 73.33 level.
Again, this will still be largely dependent on what happens between Russia and the Ukraine. We’ll monitor these levels, but the key thing here, guys, is know your levels. We also have very strong, verified support at 86.55. You can see the verified support levels. Again, they’re a non-indicator to some degree. What I mean by that is these red arrows, they point to a failure for the market to go any lower, and it goes higher. The red arrows do the same thing in reverse.
They identify an indisputable failure point in the market and then draw a line right across here and make that into a verified zone and further color code how strong that is. This is like a pinkish color. The real heavy support, or excuse me, resistance, are up much higher. Again, we still have room to extend higher, but I think a pullback could be in the curves to say the least.
Now, as we start to move into some of the foreign exchange trades for next week, once again, very, very choppy in the foreign exchange market this past week. With that, there’s been some very, very good short-term trending move, medium-term trending moves. The bigger one was with the Euro. Once again, knowing how to identify verified support, and I don’t mean just support and resistance, but something that’s been verified where we have an actual failure point and it’s indisputable.
There’s no Fibonacci, there’s no Elliott Wave. There’s no any of these other wild wacky indicators that we throw onto our charts. It’s plain and simple. We have a swing low two bars to the left, two bars to the right that are higher than this lowest point. There’s nothing to debate. The market failed and proceeded to move higher.
Euro versus U.S. Dollar
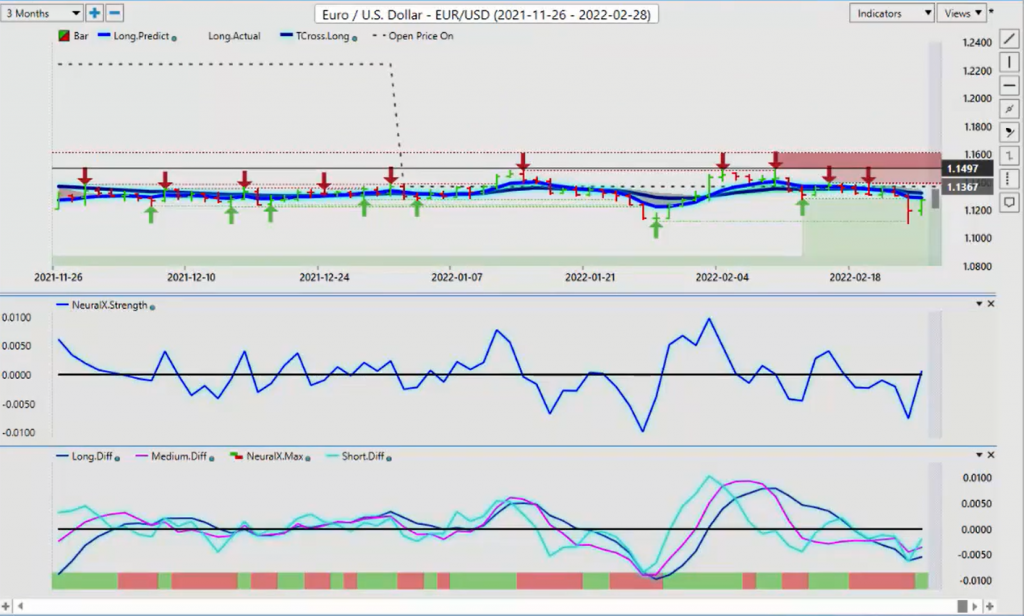
Again, when we look at the Euro, the Euro continues to struggle around this critical resistance level, the yearly opening price.
Now, we have the VantagePoint T cross long coming in for additional resistance at 1.1322. This level, all of this level, if you’re going to short the Euro next week, in my respectful opinion, that’s where it should be, between 1.1332 and 1.1369, and be prepared to go long, because right now, what I can tell you is that the Euro is decoupling itself to a known inner market correlation, which is gold. Okay?
It has recoupled the correlation to the S&P 500. If the S&P 500 turns around, like it did on Friday, you can see that the Euro followed it. Now, I’m not saying it’s still not correlated to gold. It is, but there’s a higher correlation to this. To start the week, our neural index strength is pointing straight up. Our predicted differences are pointing up. Our neural index is up, but again, it’s still below its yearly opening price.
It is still structurally bearish until such time as we break free and clear of 1.1369 and stay above that level. You can see, over this three-month period, we’ve got a fairly significant channel. I would argue now that you are … And again, we’ve had a failure right on that pre-identified verified support low at 1.1121. We failed there in a very nice long off of that level, but that’s corrective.
Whenever you fight a very strong trend, you want to make sure you’re taking profit, but for now, again, the Euro will be dependent what happens next week with Russia and the Ukraine. Now, I believe that there’s better value in places to buy U.S. dollars. Just on a side note, always remember, the Forex market I think people overly complicate it, or either buying or selling U.S. dollars. That’s the primary play, and even with the currencies like Australia-U.S.
New Zealand-U.S., or either buying or selling actually the equity markets with those particular trades, which I’ll discuss more in a moment.
U.S. Dollar versus Swiss Franc
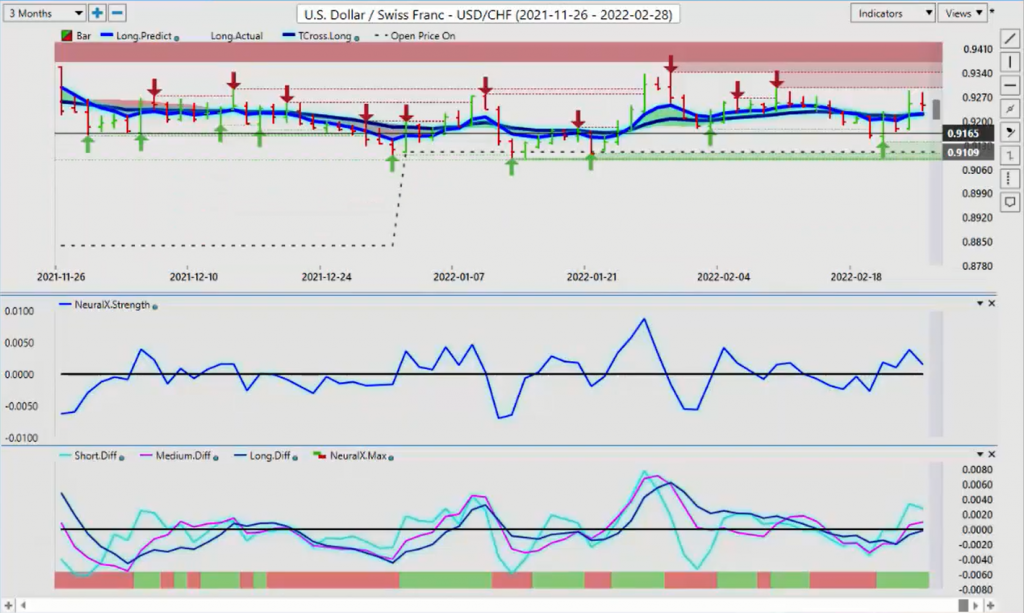
The U.S.-Swiss Franc has remained firmly above its yearly opening price the entire calendar year. Any retracement back down to that price on open, which is 0.9109. We have had significant buying, even with my own direct client’s personally, I’ve kept us long the entire calendar year, even through this choppiness.
Right now, our neural index strength is losing a bit of momentum here from Friday trade, which is fine, but our VantagePoint T cross long that’s coming in at 0.9220 and again, that yearly opening price, 0.9109, we would be buyers down to that particular level until such time as we break below it. Now, if that were to happen, I would argue that would probably not be until April or May, but also again, Ukraine/Russia, I have no control over what the next step is with these guys.
We’ll monitor the key level, but our predicted differences are looking good. The neural index is still green, but there isn’t a lot of momentum there, which I’ll concede. We watch our key support and resistance levels and we look to enter based around the VP forecast, which for now still suggest longs are the better play.
British Pound versus U.S. Dollar
Now, with the pound-dollar, the pound-dollar, again, really taking a hit on Thursday with Russia and Ukraine. Again, we have verified support. Now, what I want to point out with the verified for people using the verified support and resistance zones, you’re always looking at that close price.
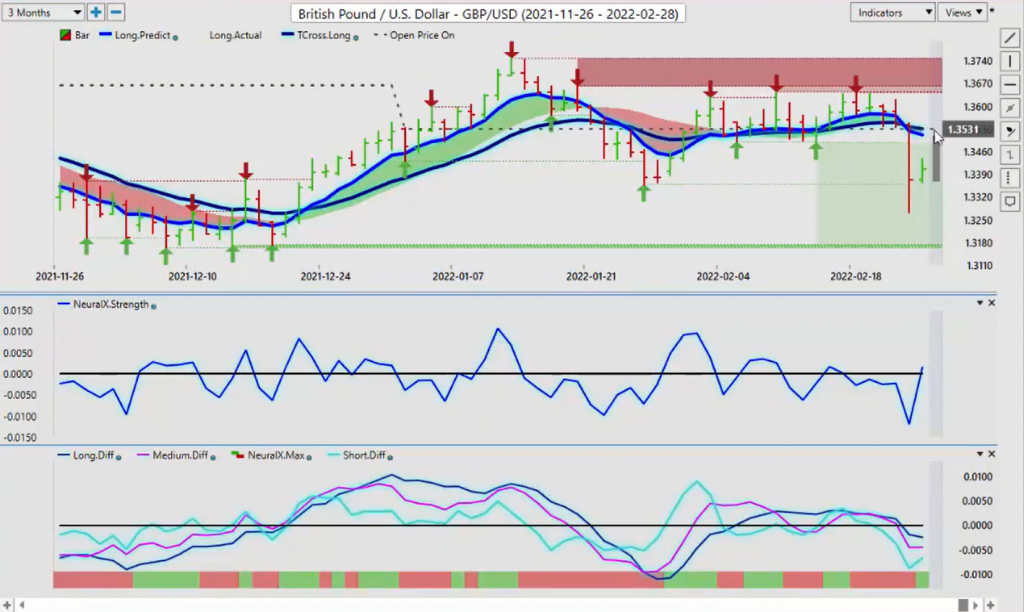
You can see that we pushed below that January 27th low, which formed the verified support zone down at the low, at 1.3358, but we blew through it here, but you’ll notice we closed right there, back on top, just above that verified zone, which led to a significant rally or corrective move higher on Friday. At this time that’s the only terminology I can kind of use, is corrective higher, but I will point out, the slope of our neural index strength is pointing straight up.
Our neural index is turned from red to green. There is the potential, but once again, stocks, guys, if the S&P 500 recovers, the pound-dollar will follow it for the most part. There’s also a very high correlation to oil. Again, when we identify this, all of our VP levels and the yearly opening price are essentially right at the same level, that’s coming in at 1.3531 and 1.3530.
When the T cross long and a yearly opening price intersect at the exact same level, then that is not something you want to mess around with, guys. The way I would play this is I would straddle this. I would sell up in as close to that area as I could with buy limit orders ready to go, buy stop orders ready to go above 1.3580, because if we get back up above there, then chances are this thing is going to continue back up towards the top of the channel at the high of 1.3642.
At this particular time, as long as we know these levels, we can sit back, we can watch the fireworks, and there will be fireworks on Monday. Trust me on that one. Then we watch and wait and see when this all shakes out, is the pound-dollar going to remain in a down trend, or is it going to turn higher?
U.S. Dollar versus Japanese Yen
Now, the dollar-yen moving into the week of the non-farm payroll number, this is a critical pair to watch. What I mean by that specifically is that in most cases, if the payroll number is forecasted it’s going to be higher, then the dollar-yen moves higher with it. Stocks are not having a huge effect with the dollar-yen right now. The dollar strength has prevailed. You’re going to see this one chop back and forth.
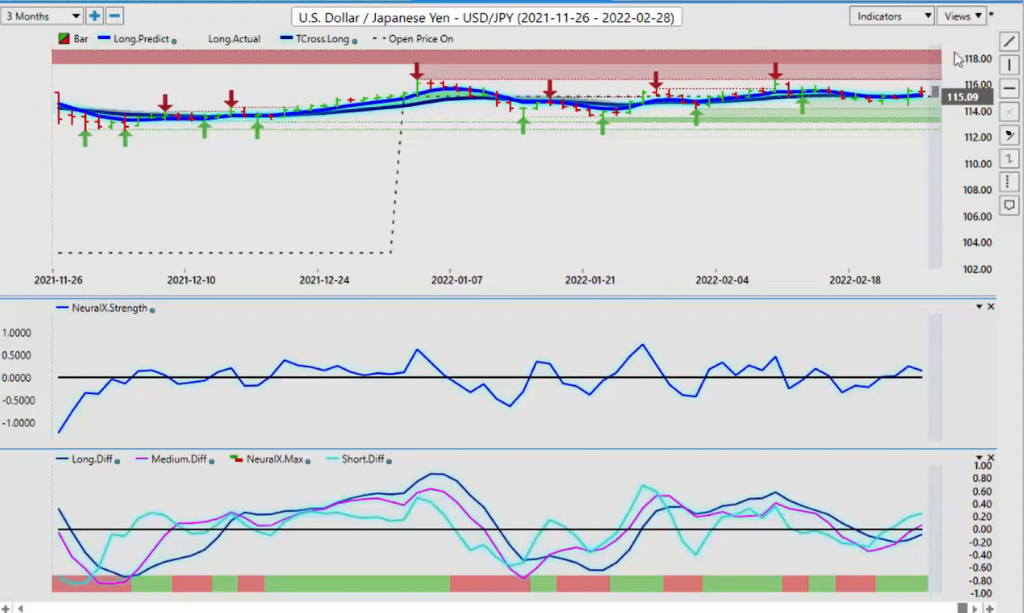
We do have a buy signal here, the MA diff crossing, the medium-term trend gaining strength against the longer-term down trend. The neural index is up, but we don’t have a lot of momentum as you can see with that neural index strength. It’s above the zero line, but it is slightly sloping down. We’ll watch our key support levels but once again, our price on open 115.09, the VantagePoint T cross long at 115. We’re closing the week at 115.48.
If you’re a buyer, then you would target the 115 level. The VantagePoint predicted low is also sitting there. A long trade is more than reasonable to start the week. If things calm down again between Russia and the Ukraine, stocks go higher, that’s added fuel to the fire for longs. I believe that this channel that you’re seeing here that’s been running for basically the entire calendar year is likely going to break by the end of the week.
That will depend on that U.S. payroll number. We also have the fed speaking next week too. I believe Powell is testifying before Congress, so keep an eye on that one too. That’s going to likely send this pair all over the map, but as long as you know your key level, and if we do break down below that, always remember, you’ve got very strong verified support to the low at 114.16 and even stronger verified support at the low of 113.48.
U.S. Dollar versus Canadian Dollar
Now, with the U.S.-Canada, I think we’re going to see a week very similar to what we’ve seen in other currencies, where they buy the rumor and they sell the fact, I’ll use New Zealand-U.S. as an example from last week. Incredibly strong right up until they raised rates. Soon as they raised rates, down it went. I would say there’s an 80% probability the Bank of Canada is going to hike on Monday … or on Wednesday, excuse me.
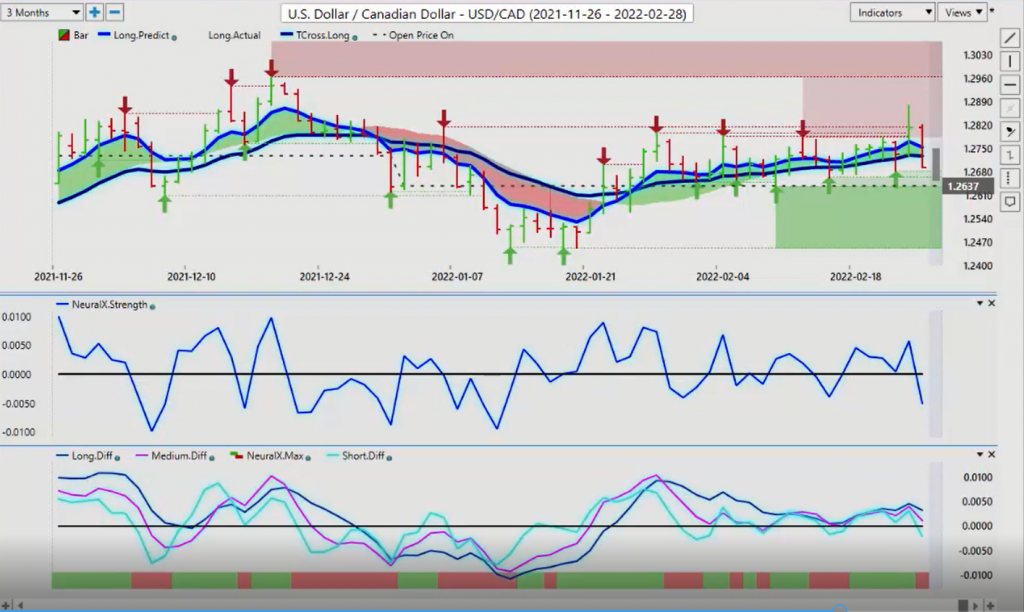
That would say U.S.-Canada is going to see some downward pressure, but soon as we get the announcement from the Bank of Canada on Wednesday morning at 10:00 AM, then the Canadian dollar is likely going to fall back in line, and it will be dependent on whether stocks go higher or lower. If stocks go lower, U.S.-Canada goes higher. That’s the play here, guys. It’s a naked trade using inner market correlation. We’re above the yearly opening price. I believe that longs are reasonable down at this particular level.
The VantagePoint predicted low to begin the week 1.2656. I think that that’s an excellent area to start to look at long trades. Again, that Bank of Canada, we’re likely to see the Canadian dollar strengthen until we hear what the Bank of Canada’s plan is. The neural index strength is clearly picking up on that Canadian dollar strength, the predicted differences and the neural index itself.
Again, we’re above that yearly opening price, guys. Any move lower at the current time is corrective in nature, a sustained break below the price on open at 1.2637. Then we look for a potential new trend to the downside.
Australian Dollar versus U.S. Dollar
Now, Aussie, U.S. and New Zealand, U.S. guys, I will be very brief on this one. Again, this week we are hovering right underneath the yearly opening price. A trending move is very, very close. Now, despite everything we’ve thrown at the Aussie and the Kiwi, they keep bouncing back. Again, they’ve bounced back again to finish the week, the neural index strength pointing higher, but again, 100% dependent on the S&P 500 goes higher, Aussie-U.S. goes higher.
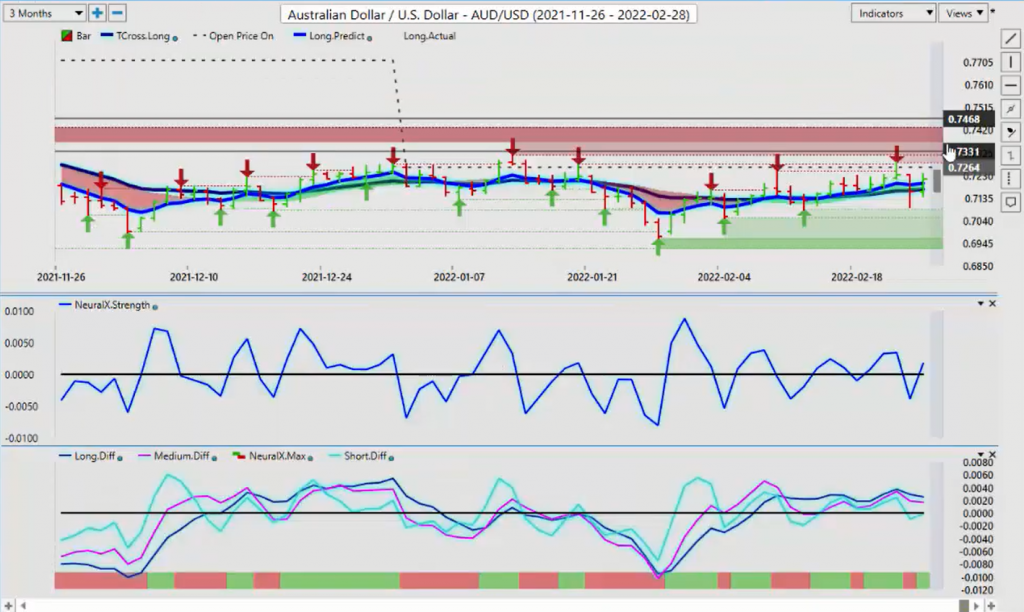
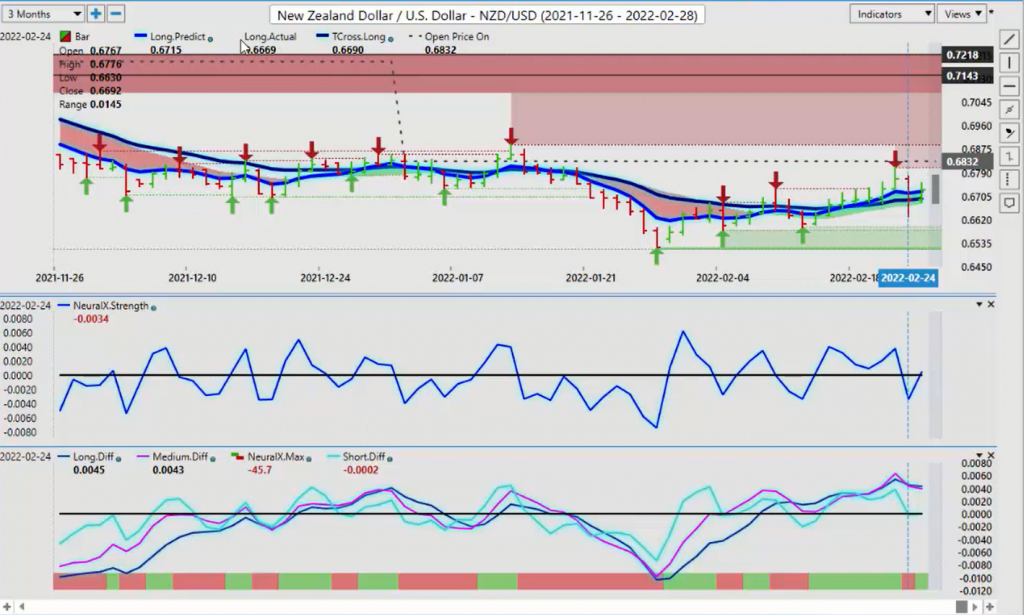
Not only that, New Zealand-U.S. will further go higher. As you can see, this was basically leading right up to the night of the rate hike. As soon as they got the hike they were looking for, down it went the next day, but it recovered and you can see that closing on Thursday, which is very interesting, closing right on two pips above the VantagePoint T cross long. Our neural index is pointing higher, but again, that price on open at 0.6832, we must break free and clear of that. Okay?
New Zealand Dollar versus U.S. Dollar
If we break free and clear of that, then we’re going to a trending move and maybe the Kiwi can move higher, maybe the Aussie can move a couple of pips, maybe 3/400 pips higher. I think it’s unlikely until towards the end of the month. But again, I try to be as objective as possible or saying, “Okay. Here’s my line in the sand. Yes, I like shorts, but if I close above the yearly opening price twice in a row in the first quarter, I’m not fighting the market on this. I’m going long.”
In hindsight here … Well, not hindsight, so to speak, but the VP indicators, they’ve been a stickler for me on this. I haven’t agreed with some of the forecasts in the VantagePoint software on these pairs, but it’s been deadly accurate, deadly, deadly accurate.
Again, we try and take our emotions and our subjectivity to some degree, we look at our seasonal patterns, we look at our key indicators and that’s what will help us get through these very difficult trading conditions. What that said, this is the VantagePoint AI market outlook for the week of March the 1st-


