


Welcome to the Artificial Intelligence Outlook for Forex trading.
VIDEO TRANSCRIPT
Hello everyone and welcome back. My name is Greg Firman, and this is the VantagePoint AI Market Outlook for the week of May the 30th, 2022. Now, to get started this week, we’re going to begin where we always do with that very important US Dollar Index. Now, we’ll do a quick review from last week’s forex weekly outlook to clarify points that were made. Now, what I had stated specifically in last week’s weekly outlook is that if the market holds below the T-cross long and the long predicted, the indicators from VantagePoint are warning that the dollar index is going to move lower this previous week, which was absolutely spot on.
U.S. Dollar Index ($IDX)
So when we look at this and we understand the basics of foreign exchange trading and even commodity trading or futures trading with using the dollar index, then again, the dollar index plays a very big part. I even sweetened the pot last week by adding the MGA stock, the Magna International stock, and used that as an inner market correlation to warn that the dollar is getting ready to move lower. But it’s important to point out that this was forecasted on Sunday morning, before not after the market’s open.
So if somebody is challenging whether the VantagePoint software is accurate or not, then one only simply has to watch last week’s video to show that these forecasts were spot on. So the predicted differences were falling, everything was falling. But what I had stated specifically is that as long as we hold below the T-cross long and the long predicted the dollar will extend lower. This is an absolute no brainer guys that the Euro US has to go higher. The inverse correlation between the dollar index and the Euro US payer is 100% meaning one goes down, the other one goes up. That’s forex trading defined here, guys.
So for this coming week, the dollar this entire week, the dollar was under pressure right across the board on just about every single forex pair that was forecasted in last week’s weekly outlook. Now, the actual move lower in the dollar, when we look closer at this going back two weeks into the forex weekly or the VantagePoint AI weekly outlook. I brought the MGA stock into the fold actually two weeks ago and said, there’s an odd signal forming here. That’s when the dollar actually started moving lower.
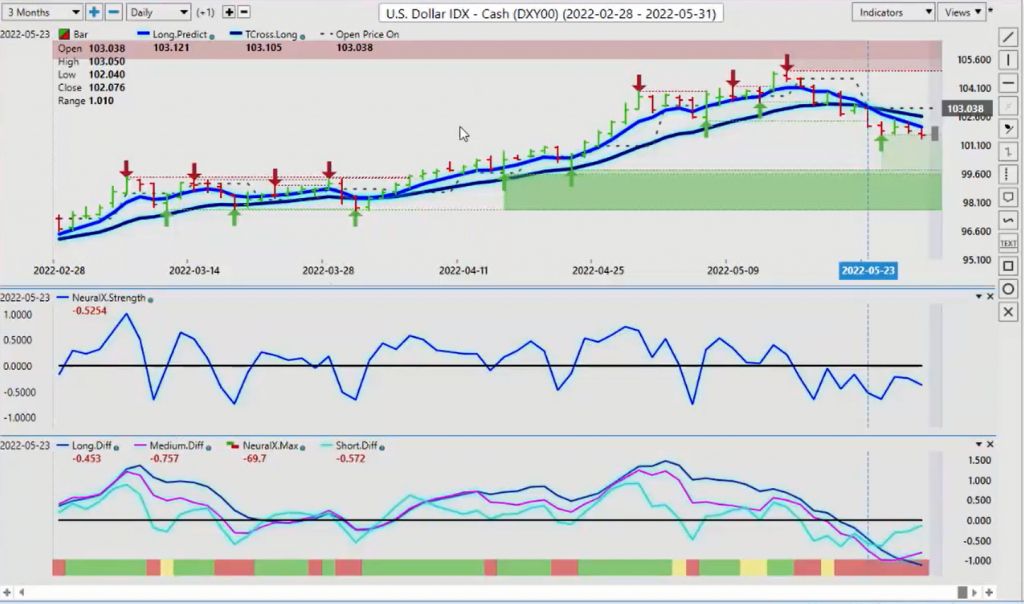
As you can see, once we crossed over the T-cross long, these numbers are all easily defined, long predicted T-cross. All you have to do is put your cursor on there. Our neural index strength indicator was down the entire week. Now, the dollar in most cases does see some strength in the first week of the month.
There’s a dollar cycle there. So now at the same time with the medium term crossing the long term predicted difference, we could see a corrective move higher now this coming week or towards the end of next week, because, again, you can see the date and time on my computer when this weekly outlook is being done. Same as last week, guys, it was all predicted ahead of time, which I’ll run through as a review here because, again, we get trolls on these websites all the time.
The comments section here is extremely valuable and I appreciate those comments, but they have to have some basis in fact, when they’re being presented, right? So when I look at this right now, there’s a warning sign that we’re going to see some dollar strength next week. We have a US holiday on Monday, but the neural index at the present time is not on board with this.
So again, we need to monitor this. We have newly formed, verified support, that’s coming in at 101.64. But based on last week’s presentation, again, if you are selling the dollar index here based around what was stated in last week’s weekly outlook, there’s your percentage of move. And again, this is fact, not fiction or opinion. This is fact. This was stated, again, before the market even opened. So you had a 1.6% move down.
Now, that’s five contracts. That’s a little heavy, but even one single contract based on last week’s analysis, that’s a pretty solid week of trading, even if you only did one trade. So again, if you’re asking whether the VantagePoint software is accurate, then the answer would be, well, of course it is. It’s in the video, right? So again, this is a free website. It’s a VantagePoint AI YouTube channel, and it’s here to forecast different strategies to assist VantagePoint users in their trading, provide alternative strategies that you may like or not like.
That’s up to you to decide whether they work or not. But for now, the dollar index does have some support here. We know we have a known dollar cycle dollar buying in the first week of the new month, right? So we’ll continue to monitor this, but for now the bias is lower with a corrective move higher, likely back towards the T-cross long at 102.61. The same thing that was stated in last week’s weekly outlook.
Gold
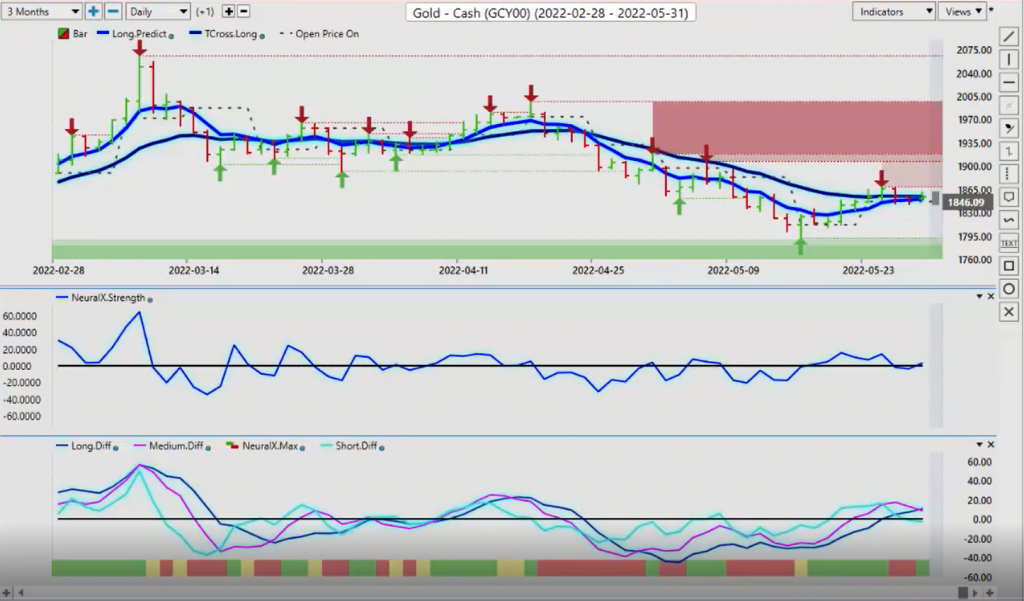
Last week, I also stated that the dollar index, the dollar in general has a seasonal pattern to it that was winding down. That was clearly outlined in last week’s video. And that gold would likely do better this past week. It didn’t do great, but it did do better because as long as the dollar index is going down, that puts a little bit of strength into gold.
Now, basically a flat week, but again, still showing some kind of strength. What you want to look for, for next week is be careful. You can see that MA diff cross, that means the medium term trend is weakening against the longer term trend. That also points to some US dollar strength at the beginning of the month. We see that almost every month at the beginning of the month. We’ve discussed this in the Tampa seminars, in the live training rooms. Each week we go through this.
So I would recommend that if you are struggling with a VantagePoint software, you can sign up for the live training room and come in and see some of these strategies and see if they will work for you. But again, we have to be very cautious when we’re throwing out statements without fact, okay? Because, again, I can’t go back and repost the video. I can’t go back and change the time that it was posted. It’s all there in black and white.
So right now our main resistance going in is 1854.97 on gold. Now gold usually does better from a seasonal standpoint. But again, it must break through this level if we’re going to accelerate higher. But I don’t think next week is the week that’s going to happen because of that period of known US dollar strength. But there is a cell signal forming here on gold as long as we’re holding below that T-cross long at 1854.
S&P 500 Index
Now, when we look at the S&P 500, I would argue that one could almost trade off of something like CNBC, where basically last week at the beginning of the week they made the official call that the S&P 500 has entered into bear market territory they said is what they told us. Now, once again here, guys, this is just off the cuff free advice. Be very careful watching these shows every day because within a matter of days of them saying that… Actually I would argue within a matter of hours of them saying the S&P is officially in bear market territory. We have a massive rally up.
Now, part of that is because I believe as I’ve stated many times, I’m not in agreement with massive rate hikes here. I think it’s a mistake to be honest. I think the fed personally will pivot probably by October. And will say, “We’re not doing 50 basis points anymore. We’re going to cut it back to quarter basis points.” That’s what they hinted at in those minutes. And you did have a couple of dissenters in the FOMC minutes this week.
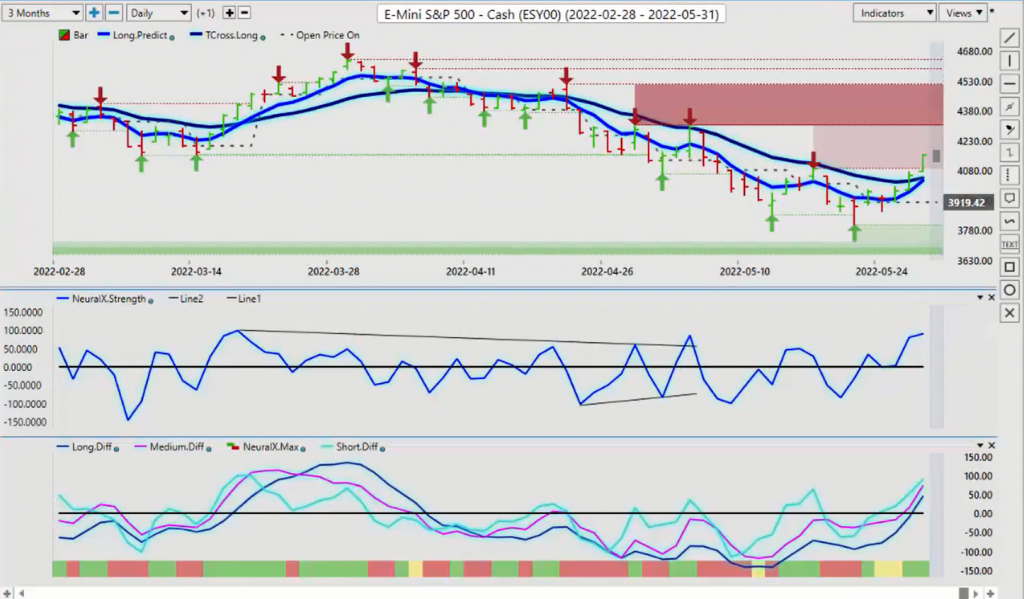
But the key thing is we can see that using the point in time indicator, the weekly opening price, looking at the indicators from VantagePoint to predicted short, medium and long term difference. And the one that I found really interesting was this one, the neural index strength going sideways along the zero line and were unable to penetrate down below that weekly opening price. We’re holding above it. So if you count the days back, one, two, three, four, five, we’re holding above that weekly opening price the entire week. The neural index strength is refusing to go lower. And the neural index itself went from green to yellow. Yellow, just like a traffic light, guys, it’s caution, right?
So sure enough did VantagePoint at least warn us that maybe those pundits on TV, your Jim Cramers and all these other guys, maybe they’re just reacting to what happened last week, right? So sure enough, the buyers come back in very, very strong. Did VantagePoint predict that, that was in progress. I would argue, yes, they did. They at least warned us. So if we come back and we look at this, once again, if we’re using the long, predicted 3940, we’re unable to close below 3940. This is the long predicted rate here. This is a pivot level that you look to buy and sell from, right?
So again, you can see this doesn’t mean that the S&P 500 is going to turn around and retake the 4800 mark, but it warns us that we should not be selling down here. We get the official bear market, the second they set it. Again, within hours, the market turns around. One would argue that, and some do argue that people say people on some of these podcasts and newscasts, they say things like this to get the market going the wrong way.
VatagePoint, if nothing else stopped us from taking shorts and buying into that, whole big bear market thing. Not that we’re not at a bear market, we are. We’re below the yearly opening price, but we do have strong buying this past week. We’ll look to build on that next week in order for this to remain long, the S&P 500. So I am absolutely crystal clear here.
We must hold above 4043, 4032. These are our main pivot levels. You’ll notice that, yes, we can look at the predicted high and predicted low if we’re scalping or we’re day trading day to day. It’s a very useful tool having that. But our main critical levels determining whether something is bullish or bearish, is are we above or below these two predicted moving averages, the long predicted, which is F8 on your keypad, F9 your T-cross long, which is used on the triple MA cross.
So we look to hold above that levels, these two levels and build on that.
Bitcoin
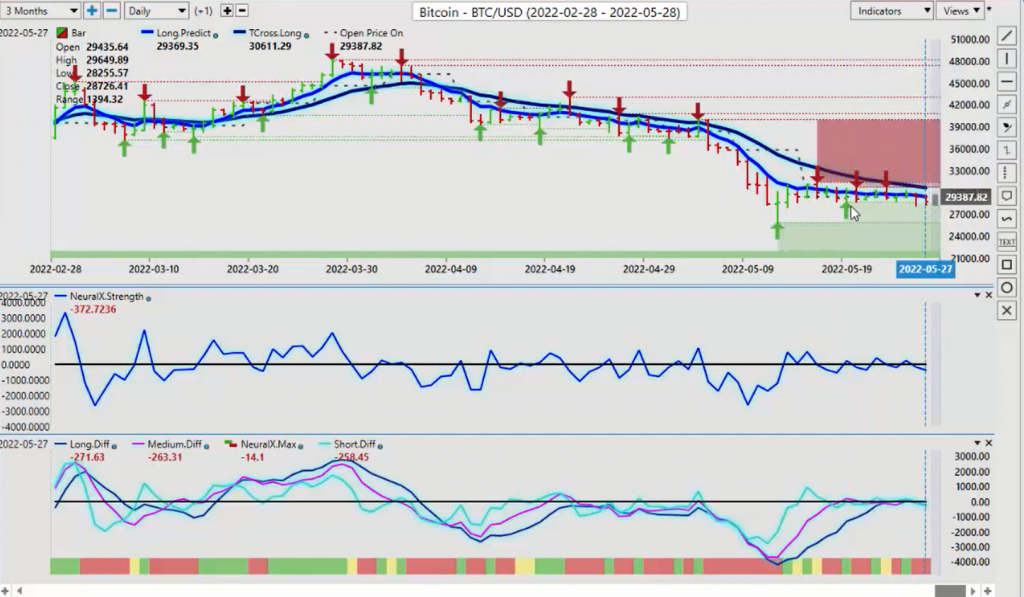
But if we can’t, then you can get your shorts in there immediately. Now, once again, with Bitcoin, I would argue with Bitcoin that the pundits, if the stock market can turn around, Bitcoin will turn around. You can see that we have absolutely no sellers here whatsoever.
This thing has been hanging on this low at 28,656 for weeks. So if the stock market can turn around, it would likely take Bitcoin backup with it. But I will point out that, again, it’s perfectly normal for Bitcoin to be going down at this time. Anyway, we’re almost exactly where we were last year, guys. So again, be cautious about getting caught up in the short-term trading, because a lot of times this is what causes people problems.
They’re only trading off the VantagePoint predicted high or predicted low. They’re not looking at the main core indicators. They’re not looking at the T-cross long, the long predicted. So again, this is a free website that is here to help. If you have any questions about the presentation, I am more than willing to answer those questions. I can even provide my email should you wish to have followup conversations on that.
But again, if you’re struggling with parts of the software, specifically state, what part of it you’re struggling with. So again, that low that’s coming down here is exactly where we were one year ago on July the 21st. This is a known seasonal pattern. My other favorite seasonal pattern with Bitcoin is from September to about early November is another classic period where I love to buy Bitcoin at that time over the last few years. You can see it right there in September. So two good rallies that can come in Bitcoin looking at the seasonal pattern there is again July and September. So keep an eye on those particular times.
Crude Oil
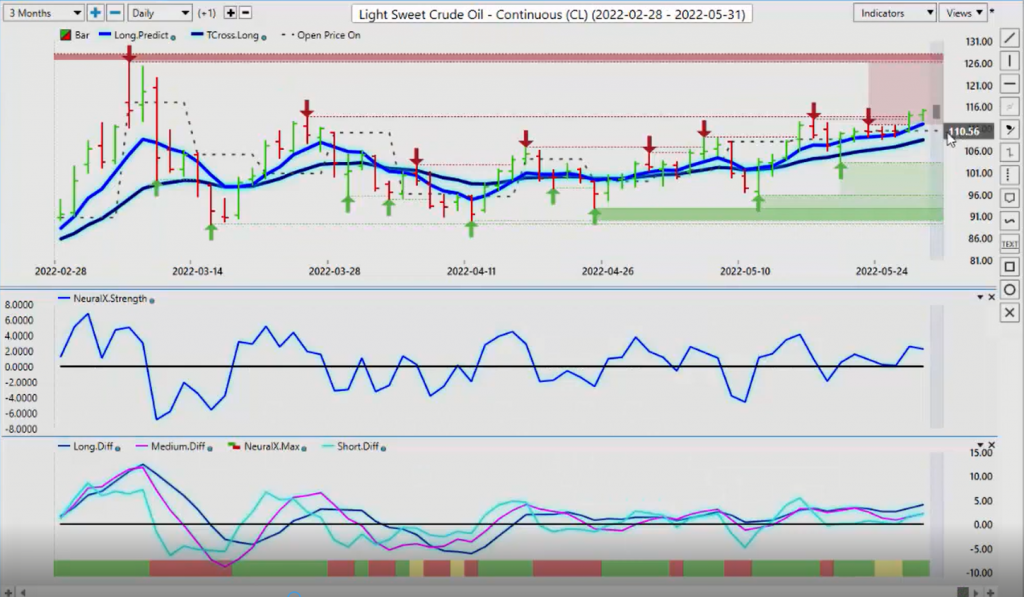
Now, with light sweet crude oil, we discussed it last week, again, with the verified support and resistance that it’s struggling. Oil prices are struggling around the high 113.20 or so. We’re pushing a little bit higher, but remember holiday thin markets here, guys, right? So you’re not going to get a lot of new positions coming in at the end of this past week because of the Memorial Day in the US.
But again, oil is still holding its ground, but it’s very, very choppy. Now, as we look at our main forex pairs, once again, when we look at what VantagePoint really forecasted last week for Euro US is I clearly outlined. So if there’s a challenge being made, is VantagePoint accurate? Then that challenge has already been accepted. All you have to do is review the previous email or the previous video from last week. But I’ll follow it up again, because again, it’s an educational site, right? What I had stated very clearly in last week’s video is that if the dollar index, if the forecast VantagePoint clearly forecasted the dollar index going lower, the last two weeks Euro US can only go one direction, guys.
Despite the Russia-Ukraine war, despite interest rates, the fed hiking, all these things, it can’t go lower during that time. And that’s exactly what I said in the video and warned everybody because I’m perfectly aware of the fact that everybody and their sister is long, the US dollar.
Euro versus U.S. Dollar
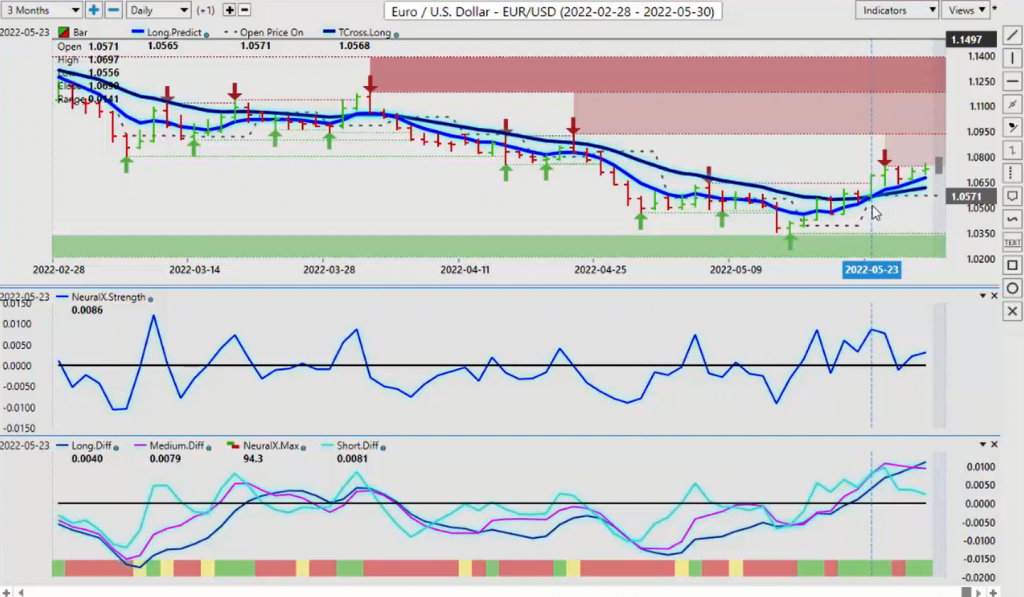
First of all, that’s a problem inside of itself. It’s a very overcrowded trade. So again, I warn people that, “Look, if we’re holding above the VantagePoint T-cross long the Euro has plenty of room to extend higher. So from the open of last Sunday, based around last video, we opened at 105.71 and we’ve gone all the way up to a high of just under 108. That is one heck of a long trade that was forecasted prior to it even happening. Not after, right?
And again, it’s all laid out in last week’s video. Crystal clear. Right? So again, if there’s a challenge being made, trust me, it’s been accepted. I’m still actually waiting for a response, which I didn’t get. So once again, when we look at this, facts. Facts matter, guys, right? We all know what fake news is. We see it, we hear it all the time. And I know that there’s a lot of different trolls running around different websites, poking at this, poking at that.
My skin is pretty thick, but we need to see facts here, right? This was forecasted that the dollar index is moving lower, the Euro is going higher. Now, we’ve got stiff resistance here. Very, very stiff resistance that’s newly formed at 107.48. If we can break through this verified resistance and stay above it, then we can look at targeting the 109 area.
But again, to be clear, the T-cross long pivot area is 106.19, long predicted 106.78. If we’re holding above 106.19 then there’s still room for the Euro to extend higher. If you disagree with what I’m saying, I respect that.
Again, just like in last week’s video guys, I identified a specific level. If it breaks, we’re going higher. If it breaks, we’re going lower. So the same thing. If you’re saying, “No, I’m a Euro US bear, I’m not going to disagree with you. Absolutely. But this is a pretty strong signal. The one signal that I will point out that is different is the MA diff cross. The medium term cross and the long term predicted difference is warning us that the Euro US is likely going to move lower.
It doesn’t mean it’s going to reverse and go back down to 103, but it’s warning us there isn’t a lot of strength up here. That’s what the software is telling us with this pink line crossing the blue line. So at the very least, I would anticipate a potential retracement down into 106.78 and more specifically 106.19. If you’re not a buyer of the Euro US, then you would simply set up your shorts below the T-cross long. If this is a fake move, moving higher, so be it.
Then you can wait and say, “Okay, I’ll put a limit order down around 105.95 or so and say, “Okay, if we break down below that VantagePoint T-cross long, then it’ll start breaking lower again.” That would be reasonable at this time of the month in early June. Right? So again, identifying these key levels and anything in the software that is saying that, that blue line cross, this crossover may only be a short term move. The MA diff warns us ahead of time of just exactly that.
U.S. Dollar versus Swiss Franc
Now, when we look at some additional forex pairs going through, the US Swiss Franc again is 90% correlated to the dollar index. What you have to understand is if you’re a forex trader that most transactions somehow involve the US dollar. So the dollar index, looking at the dollar index directly is important, right? So when I’m looking at this right now, I’m saying, “Okay, well, this moved down. It actually started at the exact same time the dollar index started.”
So you can see February the 16th, if we look over here, I can say that the dollar index right there, February the 13th, 15th, 16th. It’s the same exact trade. So if the dollar index at the beginning of each week, you have to make a decision. Am I a buyer or am I a seller of US dollars? Once you answer that question for yourself, your trading will immediately improve, right?
So again, I can assist with that. I try to do that each week. And again, there are no dumb questions, guys. All questions are valid questions. But statements need to be backed up with some kind of fact, not fiction. Okay?
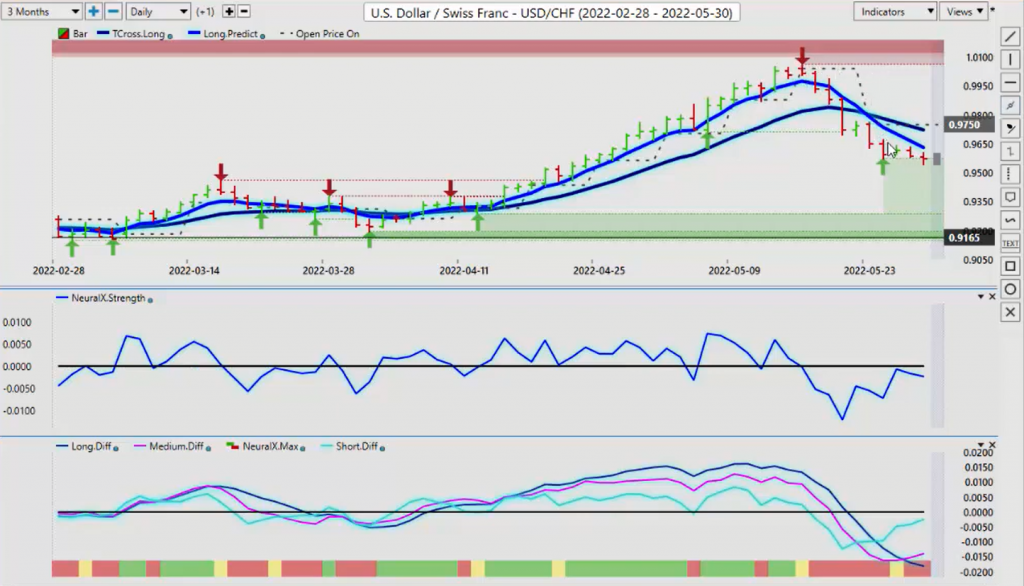
So when we look at this right now, I can say to begin the week, we have two main resistance points. The long predicted 102.05, the T-cross long at 102.63. That’s the dollar index. I take the same methodology and I apply it to US Swiss Franc and say, “Okay, I’ve got two main levels there, the T-cross long or the first is the long predicted 96.31. The T-cross long is above that at 97.23. The theory here is that we are short while below 97.23, the primary trend at least in the near term is shifted.
However, once again, we see an MA diff cross that is taking place, once again, warning us of at least some type of pending dollar strength. This would be corrective in nature at the current time up to the T-cross long. That is very likely to occur next week, but we already identify the pre levels. Pre-identify the levels, excuse me. Plus, we have a verified support low at 95.74.
British Pound versus U.S. Dollar
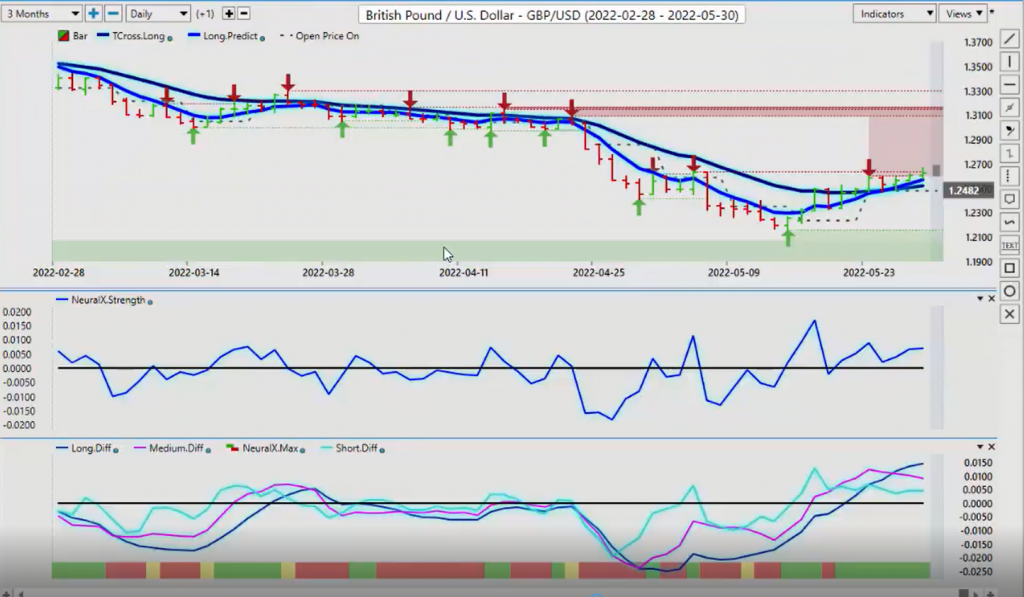
But once again, this trade last week is all based around the analysis on the dollar index, right? So looking forward into the pound dollar. We discussed this one at length in last week’s presentation. And what I had stated there too is that if we move above the T-cross long to start the week, then we have plenty of room to extend.
Well, again, when we look at the forecast from last week, was there any degree of accuracy in that prediction? Well, I would argue, of course there was because you can see it. This was all discussed. If that level… And I don’t like to show that. That’s too many contracts. Just a single little contract right there. That’s a $1,300 move. Right? But that was forecasted before, not after it happened. And it was all predicated on the fact, can we break or break above the key level that was clearly outlined in that video, right?
The second it started doing it, it accelerated. Then not only that, you had two more opportunities to come in and buy this again based around last week’s analysis. The market came right back down to the T-cross long 124.83 on Tuesday and on Wednesday. Easy peasy guys. Bing, bing, bing. Did VantagePoint forecast this accurately? Yes, they did. Again, fact not fiction, right? Fact not opinion. This is a big thing in trading guys.
Everybody out there has tons of opinions and that’s fine. But it has to be in some basis of fact. So again, when we look at this, this move was predicted before, not after it happened. Currently, right now, this is yet another warning sign that the MA diff cross is warning of pending US dollar strength.
So again, that doesn’t mean a complete and utter reversal here, but it would tell me that we’re going to probably come back down and test that T-cross long around the 125.21 area. So we should be prepared for that. Right? Does that mean we’re going to buy the predicted low on Monday and Tuesday? No. We would look at the two additional levels, the long predicted 125.68 and the T-cross long 125.21.
But the simple, easy way for me to say this is that these levels are pre-identified. So we’re long well above 125.21. But if we close below 125.21 then we switch over to shorts. Right? Easy peasy, guys. If you know the levels, like I always say, even in the VantagePoint live training room, know your levels. If you know your levels, then they’re easy to trade. So I actually missed the long trade on Sunday night, because I don’t trade Sunday nights.
But on Monday, there it was again. On Tuesday, there it was again, because I had forecasted that if we break that level, we’re going higher. Right? But you have to allow and understand where these critical levels are, the T-cross long and the long predicted. So for next week we’ve got a strong, verified resistance high that’s coming in at 126.37.
If we can’t get over that then we switch over here to the MA diff cross and say, “Okay, if nothing else, VantagePoint is forecasting a corrective move lower. If nothing else. Okay?” And again, these are the things we want to look for in our trading to pre-identify. So if we look at the dollar yen, the dollar yen, again, very toppy up here, but soon as the predicted differences cross over the zero line that I’m illustrating here, then the chances are the market is going to follow, which it did, right?
Now, we have a verified support low. We have an MA diff cross that we have a verified support zone. The neural index strength is attempting to make a cross so we could have some, again, yet another sign that we could see some dollar strength at the beginning of the month. It may only be short term, but you have large money flows here, guys that come in at the beginning of the month, in the end of the month.
We saw that with the S&P 500. We had a ton of money coming into stocks. But I believe I could argue that, again, making a call on CNBC that we’ve officially entered a bear market and stocks are going considerably lower only to rally the S&P 500 to rally two or 300 full points the very next day.
U.S. Dollar versus Japanese Yen
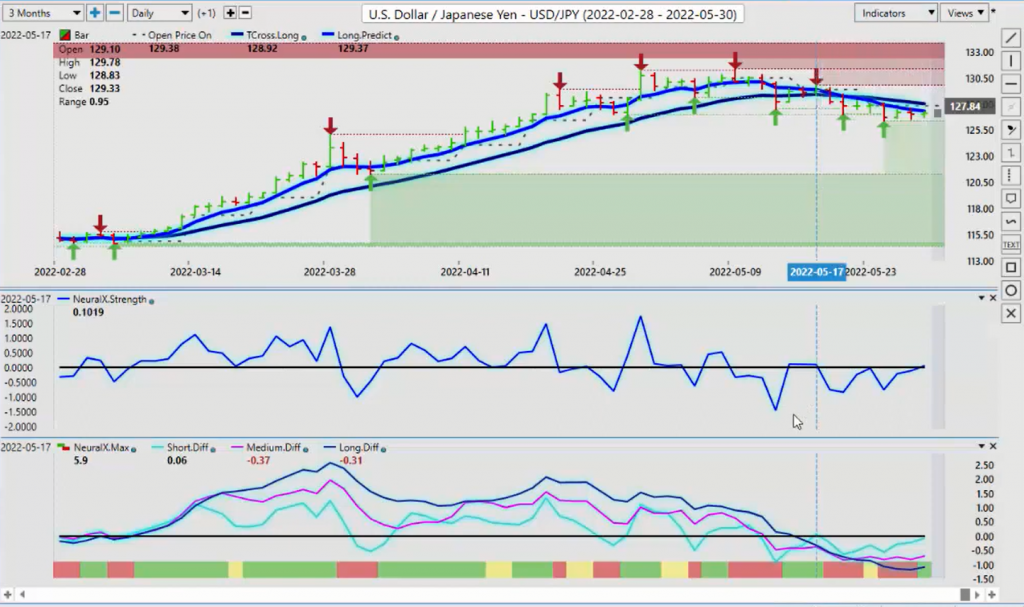
This is exactly why we want to use a program like VantagePoint, so we don’t get caught in these bull and bear traps, which that was a huge bear trap last week on the S&P. So the dollar yen, it looks like we may be able to pull a little bit higher. The T-cross long, 128 long predicted 127 .3, but we’re only going to add or look at longs if we can break back above 128.03. And I will reiterate, again, what I said last week, dollar yen has no business being up at these levels based every time a central bank intervenes.
Like the bank of Japan did, it’s never worked in an actual fact. In most cases, using the Euro Swiss Frank as an example, when they fixed that, tried to peg it, peg the Swiss Frank to the Euro, it was an epic failure. So, again, my bias remains down on this with some dollar strength.
U.S. Dollar versus Canadian Dollar
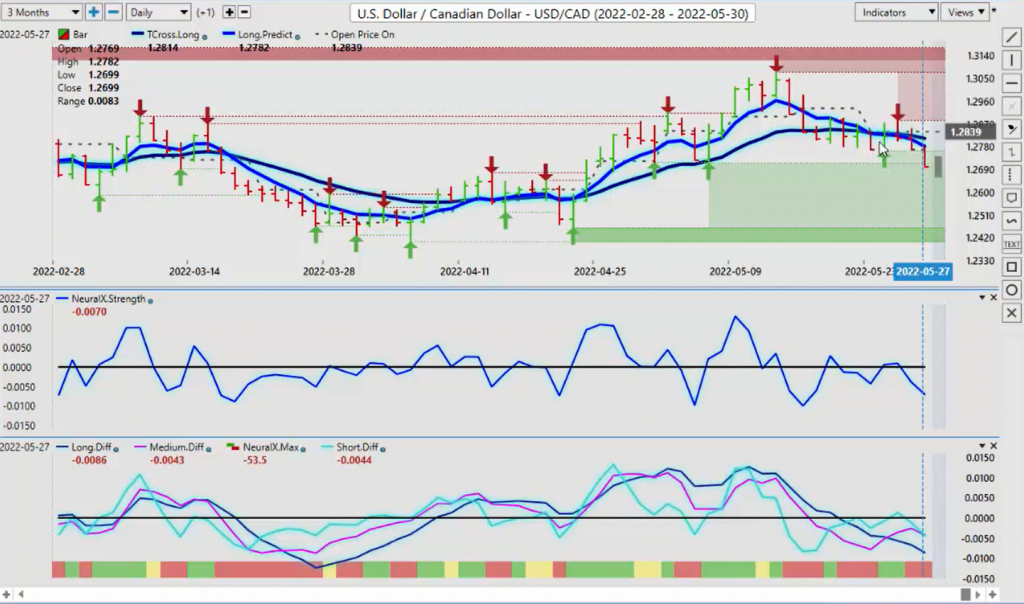
The US Canadian pair last week, same deal here, guys. Right? We discussed it in last week’s weekly outlook that the indicators from VantagePoint were telling us that we are likely moving lower. So if we can’t count back the days right here, right off the open, the neural index strength is down. It tried to recover. But as you can see, the neural index is chopping back and forth. But once we broke through that vanish point T-cross long and long predicted, it was game over for this thing. And down it went.
Remember we had these first two days. You had a Canadian bank holiday, a holiday in Canada in general, right? And then once they came back in, you had your fake price reversal. Then on Wednesday in high volume, we’re starting to get our real price here and you can see down it goes. So from last week’s presentation to start the week where we started the week and forecasting dollar weakness for this past week. Because again, guys, this isn’t a daily outlook and nor will I be doing daily outlooks. It’s a weekly outlook.
We want to try and avoid this intraday nonsense. People are becoming obsessed with it. And they can’t see the forest because of the trees. So take a step back and look at the bigger picture before you enter into a short term position. That’s my only advice here. The bias here is, again, the seasonality on the dollar. The US dollar is winding down. If that’s the case, then you’re going to see broad dollar weakness which was predicted last Sunday before the market’s opened.
I’m going to keep hitting that point. And it’s not about being right or wrong, it’s about clarifying factual information. What I said was it factual? It’s indisputable, it was, right? So when we look at this right now, you can see that the market is using these predicted moving averages as a pivot level, and they’re trading off it. Same as the pound dollar.
So once again, can US Canada move lower? Well, right now, the indicators are very mixed. We’ve got a verified support low, 127.13. We could see a bit of a bounce there, but again, we need that dollar index turning around. But here’s a trick. Another trick that you can use. The US Canadian pair will respond to oil and the S&P 500. If the S&P 500 continues to move higher, US Canada will continue to move lower. That’s the deal here, guys.
I don’t dictate intermarket correlations. I simply identify them and warn you guys to keep a close eye on them. So right now, our key levels on US Canada, T-cross long. The difference between buying and selling, 128.14. As long as we’re below 128.14, we’re short, right? We got 127. 82. We break above that, then we can start looking at longs.
I believe that longs could potentially work next week, but again, you’ve got a US holiday. So don’t go in there looking to buy a lot of currency pairs on Monday or even on Tuesday. Let all the markets come back in.
Now, the Aussie another favorite from last week that was predicted long before it happened. What I had stated very clearly in last week’s weekly outlook, if we break above the T-cross long, this thing has room to run towards the 72 level. Well, I guess I was wrong. It hits 71.66 after breaking the T-cross long and holding above the T-cross long. But you see these daily bars? This is where people get stopped out with tight stop losses. Don’t put your stop losses anywhere near the predicted high or predicted low.
Keep your stop losses well away from the T-cross long. So once it breaks above, you can see once again the same deal here, guys. What I had stated clearly in last week’s weekly outlook. If we break above there, then we’ve got a long trade. Once again, doesn’t this look just like pound dollar where you’re simply buying off that T-cross long and the long predicted?
We see the exact same thing as I had also stated in last week’s weekly outlook. The second we break above the T-cross long and close above it, you’re going to get a minor retracement then we’re good to go. Multiple opportunities to buy this off of these predicted moving averages. But people tend to focus on this. The predicted high and predicted low. Understand guys, that’s for one day and one day only. That’s all it’s for, right?
Australian Dollar versus U.S. Dollar
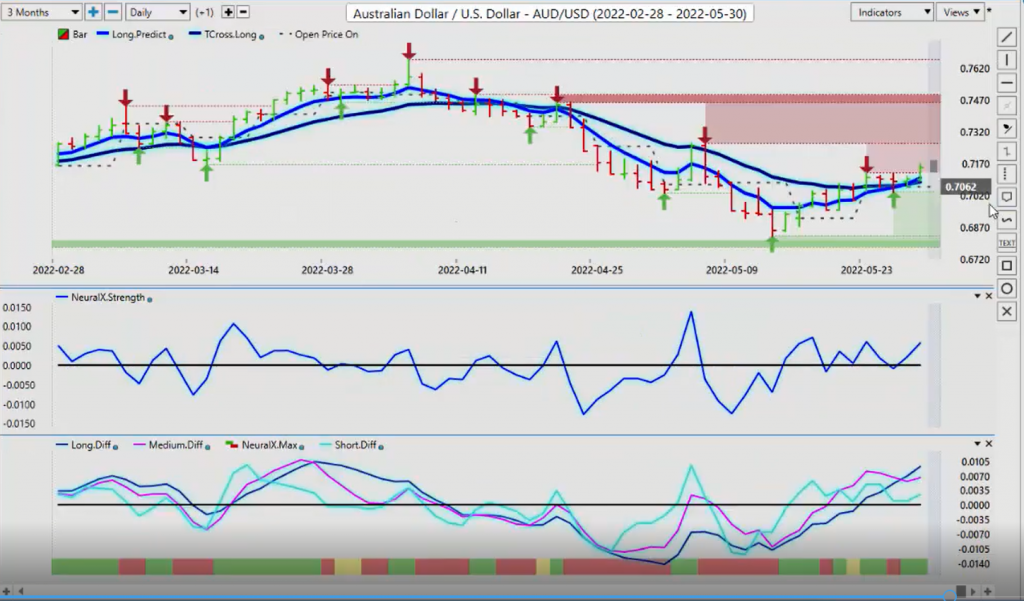
So for next week, once again, even with the Aussie and the New Zealand, you want to watch that MA diff cross because it’s warning that if nothing else there’s going to be about of dollar strength next week, at some point. This is perfectly normal. We’ve discussed it in the VantagePoint live training room multiple, multiple times about… At the beginning of the month, you have institutional funds and governments that are required.
New Zealand Dollar versus U.S. Dollar
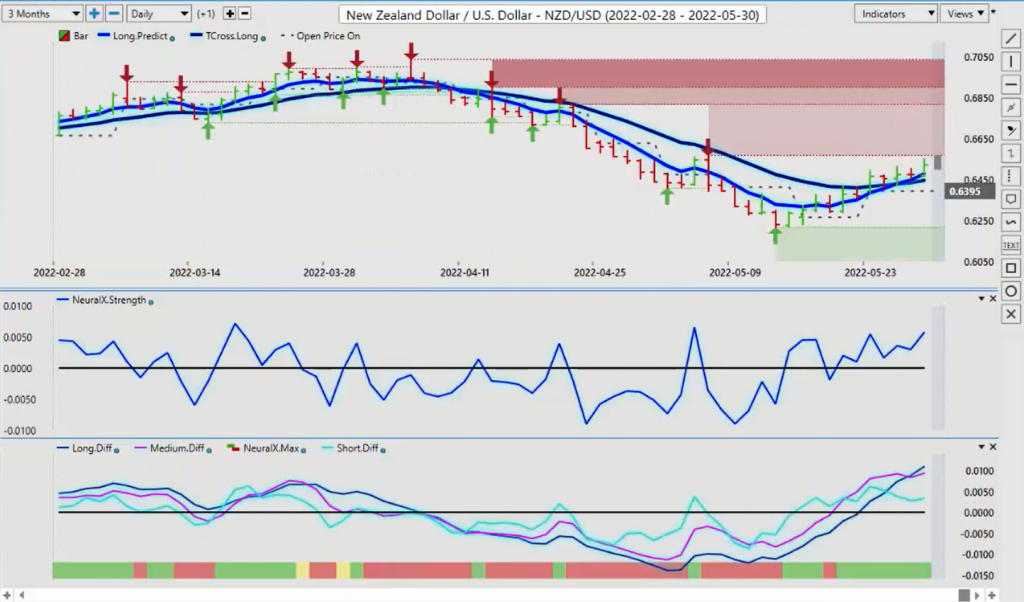
Maybe they don’t want to buy US dollars, but they must to settle their trade balances, pay pensions, pay government employees, pay retirement funds. All of these things contribute to the forex market. But just always remember guys in your forex trading, this is my advice, make a decision at the beginning of the week. Do I want to buy US dollars or sell them? Because all of these G7 pairs have one thing in common. They’re all trading against the US dollar. So with that said, this is the VantagePoint AI Market Outlook for the week of May the 31st, 2022.


