


The Hot Stocks Outlook uses VantagePoint’s market forecasts that are up to 87.4% accurate, demonstrating how traders can improve their timing and direction. In this week’s video, VantagePoint Software reviews forecasts for GoPro(GP), CincinnatiFinancial(CINF), DiscoveryInc.(DSCA), Franco-Nevada(FNV), PlainsAllAmerican (PAA) and FifthThirdBank(FITB)
Hello, again, traders, and welcome back to the Hot Stocks Outlook for March 19th, 2021. Hope you all are having an excellent week out in the markets. And as always, plenty to cover this week. We have about six markets to go over. It’s really a lot of things to cover and some interesting things going on in some very important areas of the marketplace. A really great example though of how all of these tools works, regardless of if we’re trading futures or commodities. Currencies, individual stocks.
GoPro(GP)
Here with GoPro, what we have is individual daily candles.
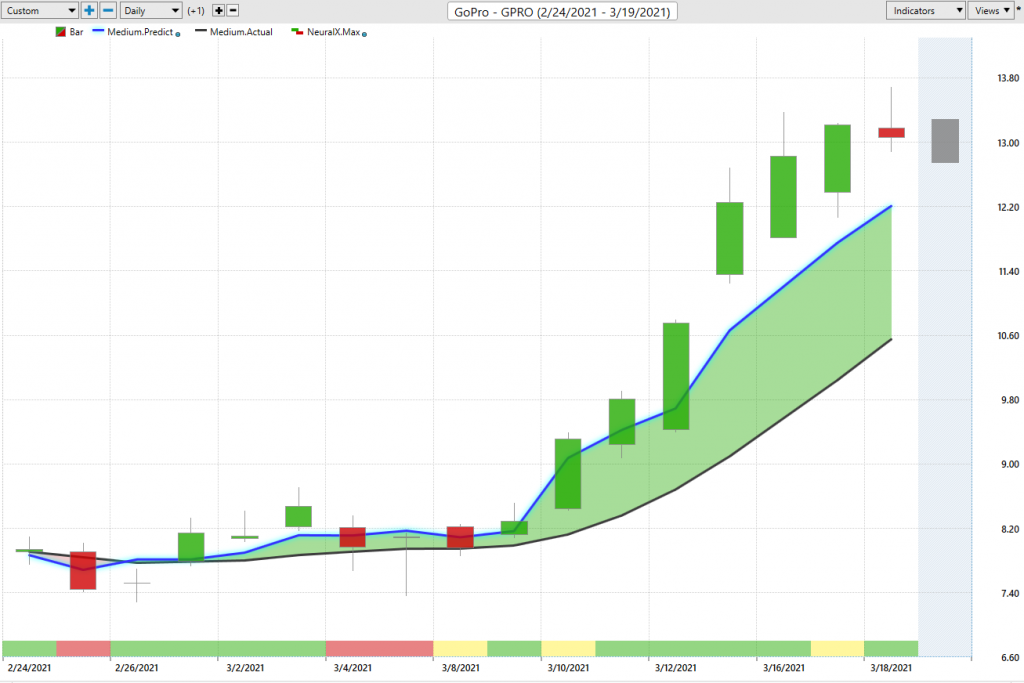
Each one of those trading days or candles there represents a full trading day. And you’ll see right up against that price data, you have there a black line and also a blue line. There’s a bar at the very bottom of your chart. And also at the very right hand side, you’ll actually see a shadow candle. And it’s really the combination of these three indicators that really act to build the entire forecast here from VantagePoint.
What we have right up against those daily bars and candles with that black line and the blue line, that is actually a simple moving average as far as that black value is concerned. It’s a very common technical indicator, and what it does is it looks back over previous close prices and adds all those close prices together, divided it by 10 in the case of a 10-day simple moving average, and it acts as a good measure of where market prices have already been in the past.
But of course, traders need to know where things going moving forward so we can be ahead of any market movements here. What we want to do is actually compare that black line or value to the value of this blue line. For that number to be calculated and plotted against the charts every evening, VantagePoint is performing what’s called intermarket analysis.
What that means is specifically for the target market, so in this place, GoPro, the artificial intelligence of artificial neural networks has identified other markets that are known to drive and influence future price moving forward. That’s going to be things like broad markets like the S&P 500, that’ll be ETF groups, in this case, in the technology space, but it’s also going to look and find relationships between individual stocks.
It may be looking at particular currencies, particular futures and commodity markets, which can be especially important when we’re looking at things like gold mining or oil companies or energy companies. Very important to understand how those intermarket relationships are factoring into your trading in whichever particular market you may be focused on.
What it’s able to do is look at those intermarket relationships and actually generate a true price prediction, so a future outlook of where average prices are headed, and it uses that number and those calculations to actually build into the value of these indicators, turning what was a lagging tool that just looks at previous close prices into a forward-looking predictive tool here. Whenever you see that blue line cross above the black line, it’s suggesting average prices are going to start moving higher.
Now, the same technology is applied to this bar at the very bottom, but this is configured differently to really only look ahead 48 hours at a time. This is a very short-term strength or weakness in the market. And again, that will be updated at the end of every single trading day forecasting for the next 48 hours of trading. It can really inform you of short-term strength or weakness in the marketplace.
You see here that when you get that blue line crossing above the black line and a short-term strong forecast, that’s generally a good place to go ahead and start getting involved in a potential trend trade situation. But you’ll notice that you get these situations where the blue line stays above the black line, so it’s telling you the overall trend is still up, but warning you that look, you may have some lower lows over the next 48 hours.
It doesn’t mean get out of the position, but says, look, be prepared for lower price levels to come through, to trade essentially below that predicted moving average at some point, but hold out for that overall trend. You see, once that neural index gets bullish once again, price really starts to accelerate to the upside. So here with shares of GoPro, this is a very cheap stock. And over a very short period of time, you’ve seen the market move up about 67% in just the past 13 trading days, so about three weeks of trading for the most part.
But we can take it closer look and say, okay, well, how did those predicted highs and lows perform on that daily level? And you see that every day you’re getting this information that says, look towards these particular levels if you want to be a potential buyer in the market. You see that you understand that. Okay, well, there’s some weakness coming in here, a couple of trading days where you move towards that predicted low, and then that market continuing that uptrend and the overall trend taking off. So about a 67% rally.
Even over just this period of time, right here, you see yesterday hitting this predicted low aggressively moving up towards the predicted high. You can use it to potentially add to your position as well. If you’ve made some money on the upside, you know where you want to add to that position and potentially take some profit with the help of that predicted high as well. Very important to understand when to hold on to a particular market though. So as long as that blue line remains above the black line, you would want to at least stay long.
It’s saying the overall trend is continuing. There’s no reason to jump away from that trade. But you see here, you get these periods where the neural index goes bearish and you get some short-term weakness over those shorter term window’s over just subsequent 48 hour periods. But overall, the trend very, very bullish here. You have one period here where you don’t get too much weakness here from the neural index. But aside from that, you get this extremely high level of accuracy from the neural index.
You can take that and pair that with your trading style and approach, and then, of course, bring in help from predicted highs and lows, so those very, very intraday short-term levels that are going to pick out intraday levels for you to come in and have limit orders waiting so that you don’t have to really be following the market the whole day. You’ve understand that, hey, there’s an area where I want to go ahead and be long. Here’s a little interesting…
Sometimes we’ll get these days where getting a lot of volatility, the overall trend to the upside, but you see here that this predicted low never gets hit, next day moving pretty much precisely to that level of the close coming in, and then that overall trend continuing. It’s going to help you, again, within those short-term periods of about a 48-hour window get some good entries in an existing trend and, of course, understand how likely is this trend to continue. Should I maintain that long or short position?
DiscoveryInc. (DISCA)
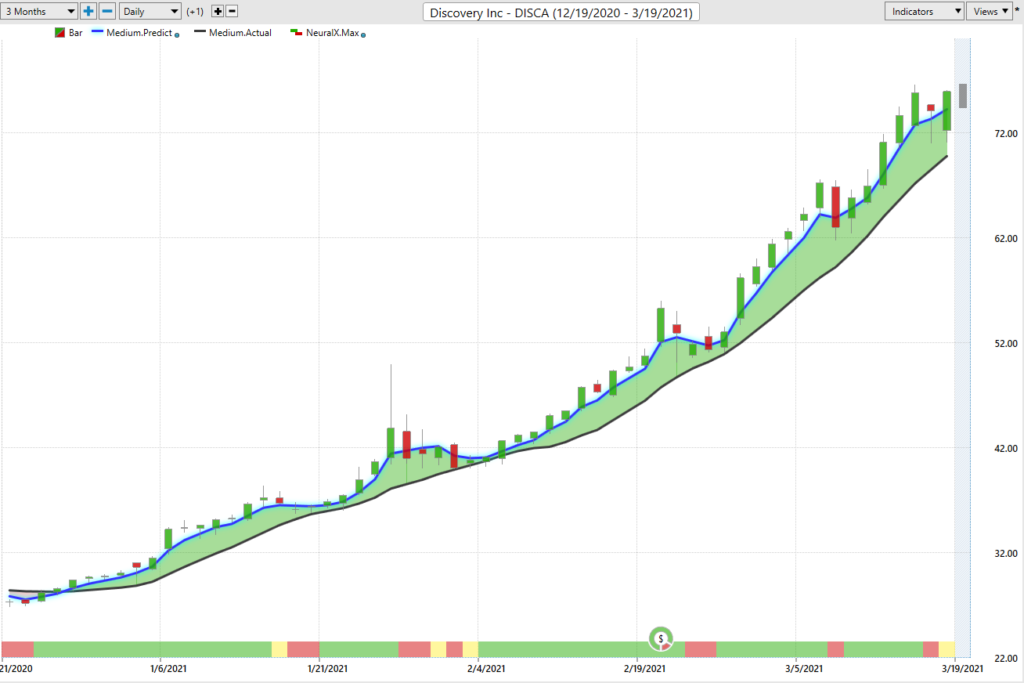
You see here, share is up over 153% in just 55 trading there in Discovery Inc. Moving forward, now this is much more recent about some things that we’ve identified in the marketplace. Gold mining stocks have all started to turn up at the same time. So you identify that something’s going on in this area of the market. And what’s really helpful here is to recognize things like this as far as the blue line crossing above the black line. We can scan for all of these features to identify fresh trend crossovers and new opportunities.
But what really helps is getting that good entry in a trend, and then you can decide if you want to take those profits, add to an existing position. But very recently here, you see this crossover to the upside, this predicted highs and lows coming through, and you see how effective, especially early on in these trends, to really get a good average price as far as that initial entry into the market. And then even days like this where you actually gapped down a little bit, if you had a limit order waiting, you’d be getting filled at that gap down, maybe a little better if your broker does a good job.
And then these subsequent levels that aren’t going to come in every single day, but you get this very good metric of, okay, well, once the trading day has closed, you see these close price comes in, you get additional information and the software does a really good job of adapting and telling you, okay, things have shifted not only in this market, but in those intermarket relationships, and understand where price is likely to gravitate to, to get the best entry in one of those opportunities, again, depending on your overall trading style.
If you want to be a trend trader, well, you can identify right as these crossovers come through and you’ve got almost a 12% move as far as this market in profit and potentially seeing, okay, if these things are going to keep running, great. You’ve got an excellent entry. You can run your stop loss, trail your stop, and have a nice entry if we do see gold prices over the broader sense and gold mining stocks appreciate here. Also, recently, you’ve seen some weakness in energies. Here’s a very popular stock, Plains All American Pipeline.
Last November is where we really saw energy stocks really start to move to the upside. So that first week of November, oil prices moved up, the stock market moved up, and energy stocks did extremely well. And we’ve had, again, an additional uptrend come through here as the S&P finds new highs and oil finds new highs. But very, very recently here, you see getting some warning signs, not only in oil, the commodity, but individual stocks related to oil.
PlainsAllAmerican (PAA)
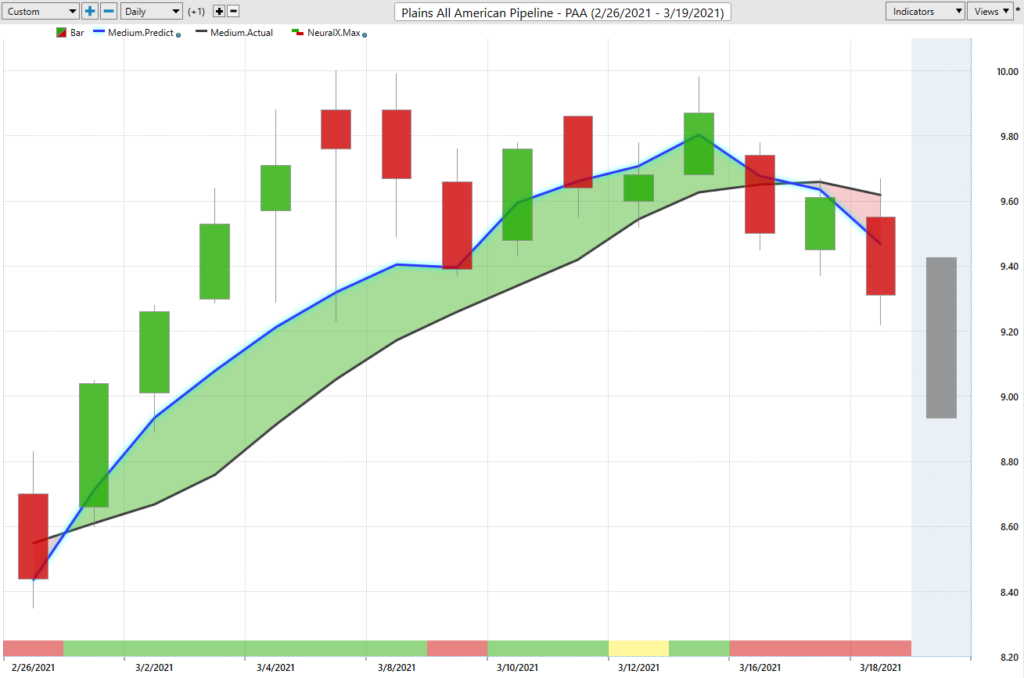
And this is really the benefit of that intermarket approach and understanding that if you’re going to trade a stock like Plains All American, you want to have a good sense of what’s going on in the broader energy commodity markets. Really nice opportunity to the upside. You see a little volatility coming in at the top here. We, of course, have our predicted highs and lows are going to do a good job of guiding you over those periods. But very quickly here, things have shifted.
If you are long, take some profits, get out of the way, and potentially even look to short the market as you’re getting those fresh opportunities as far as crossover and neural index bearish here.
CincinnatiFinancial(CINF)
We looked at last week at Cincinnati Financial and just wanted to update again for shorter-term traders. So here, just over the past week in Cincinnati Financial, obviously, this market’s been in a very strong uptrend. Great opportunity to make some money on the bullish side. But more recently, we can just see, okay, well, how has the software worked over the past week?
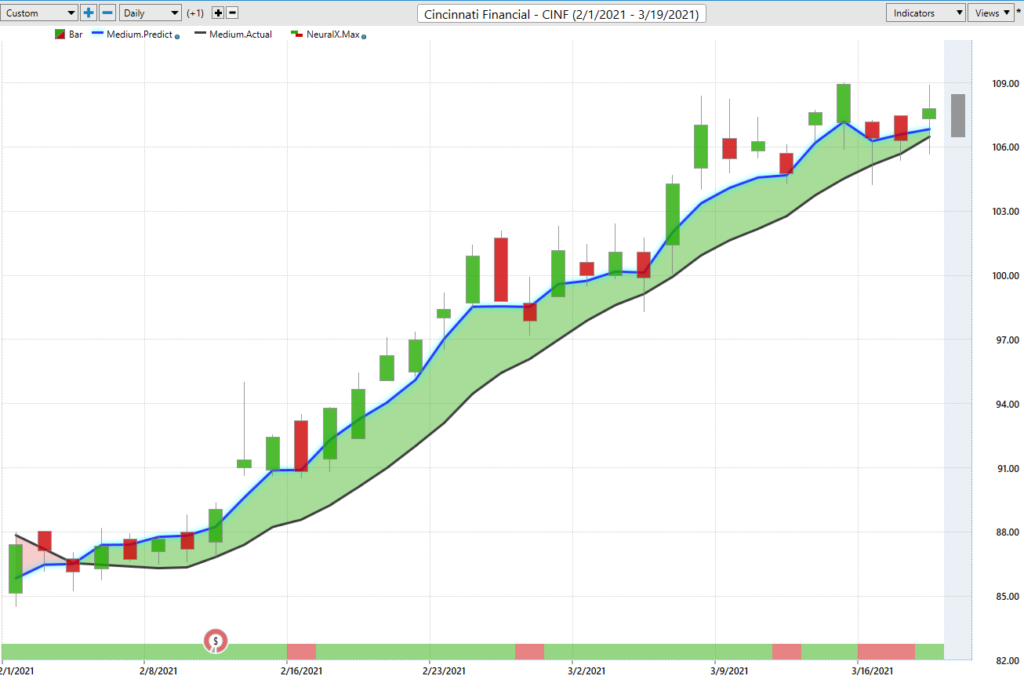
What you’ve seen here is neural index getting bearish here. So you say, okay, well, there’s likely to be some weakness. Maybe you take some profit on some positions here. And again, after this trading day, getting some weakness, letting you know, look for cheaper prices if you’re going to be that short term of a trader. There are certainly some cheaper prices to be had here. And we’ve seen just a lot of shifting going on in the marketplace.
So here in Cincinnati Financial, we obviously have this nice uptrend starting all the way back in February here. And again, to this point of really recognizing things going on in whether it be gold miners or energy stocks, you see here with Cincinnati Financial, we also have Fifth Third Bank Corp if we come over to this market. Very similar crossover to the upside coming through at the same time.
When you’re able to run these scans on a nightly basis and you’re running through, okay, which markets are having fresh opportunities come through, well, you recognize that sectors are starting to move and pivot and that’s what’s going to help you understand that, okay, well, in February, let’s take a close look here at financial stocks. Set up a game plan that we’re going to be willing to buy at predicted lows as the overall trend continues to the upside. And then more recently recognizing that, okay, things are shifting and energies.
Franco-Nevada(FNV)
Here in shares of Splunk, I think we looked at this a couple of weeks ago as well. Again, very clear crossover to the downside in that second week of February. You’ll get these periods again where the neural index gets bullish and you’ve got again, those higher highs that’ll pop through over that time period, but very clearly the downtrend very much to the downside. Then you see the extent of the distance between that predicted moving average and the actual moving average, suggesting that this is a very strong move lower and average prices are significantly below where they need to be for things to start moving higher.
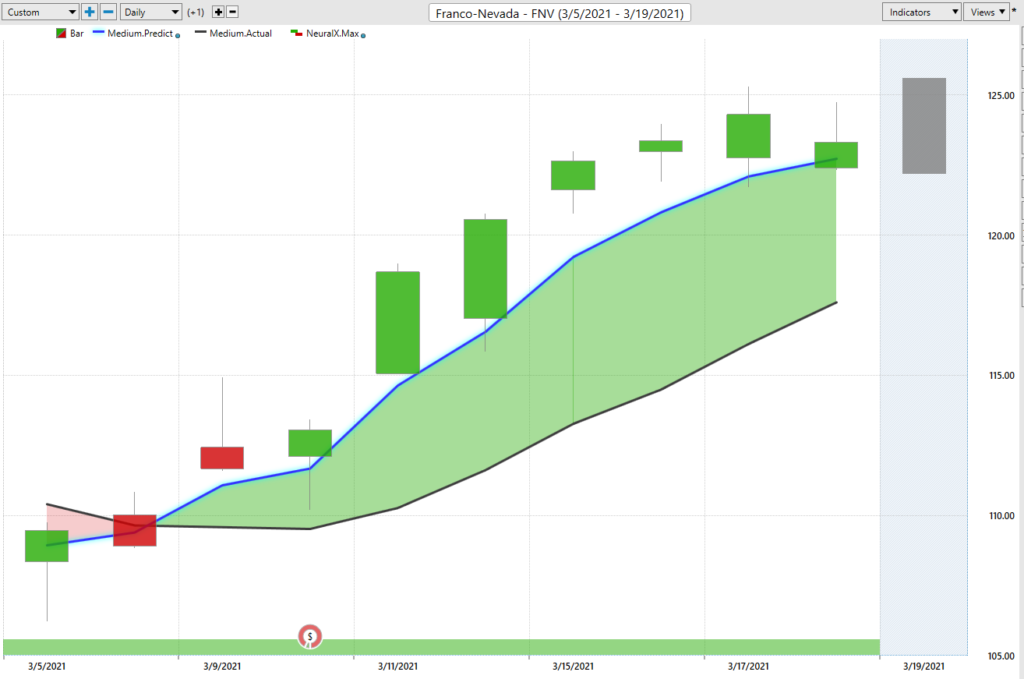
Things have shifted a couple of weeks ago potentially in gold mining stocks, so that you can construct that portfolio that’s going to have you benefiting as volatility comes into the marketplace. So regardless if the S&P is going to find new highs and move higher, great. If things are going to shift and oil prices are going to go lower, well, you want to be prepared for that when those big inflection points come through in the market.
FifthThirdBank(FITB)
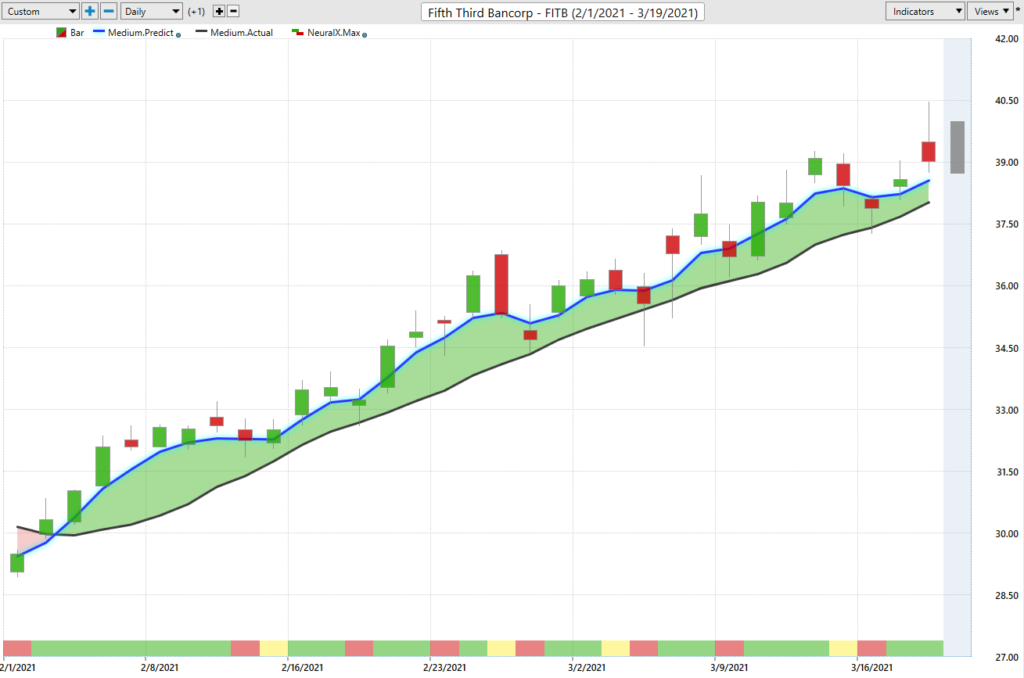
Just once again, we can take a look at Fifth Third Bank. I don’t think we looked overall at this opportunity.
But most of these financials, again, here you have a 26% move in just the past 30 trading days. So really nice opportunities again in these areas more recently, but new things are opening up, and of course, that’s going to open up some new trades and additional ways to get those good entries, hedge your portfolio, and really make money really regardless of what the broader markets do out there. Once again, this has been our hot stocks outlook for March 19th, 2021. Thank you all for watching. Best of luck out there, and bye for now.


