Register for a Free Live Training
The Hot Stocks Outlook uses VantagePoint’s market forecasts that are up to 87.4% accurate, demonstrating how traders can improve their timing and direction. In this week’s video, VantagePoint Software reviews forecasts for Activision ($ATV), Hanesbrands ($HBI), Valero Energy ($VLO), Nucor ($NUE), Apache ($APA), Schlumberger ($SLB)
Hello again traders, and welcome back to the Hot Stocks Outlook for October 14th, 2022. Hope y’all are having an excellent week out there in the financial markets, and as always, plenty to cover here in today’s outlook. And if you haven’t already, make sure you click on the available link below in the description and get that live demonstration. Learn more of the specifics about how this technology is going to help you as a trader make better trading decisions.
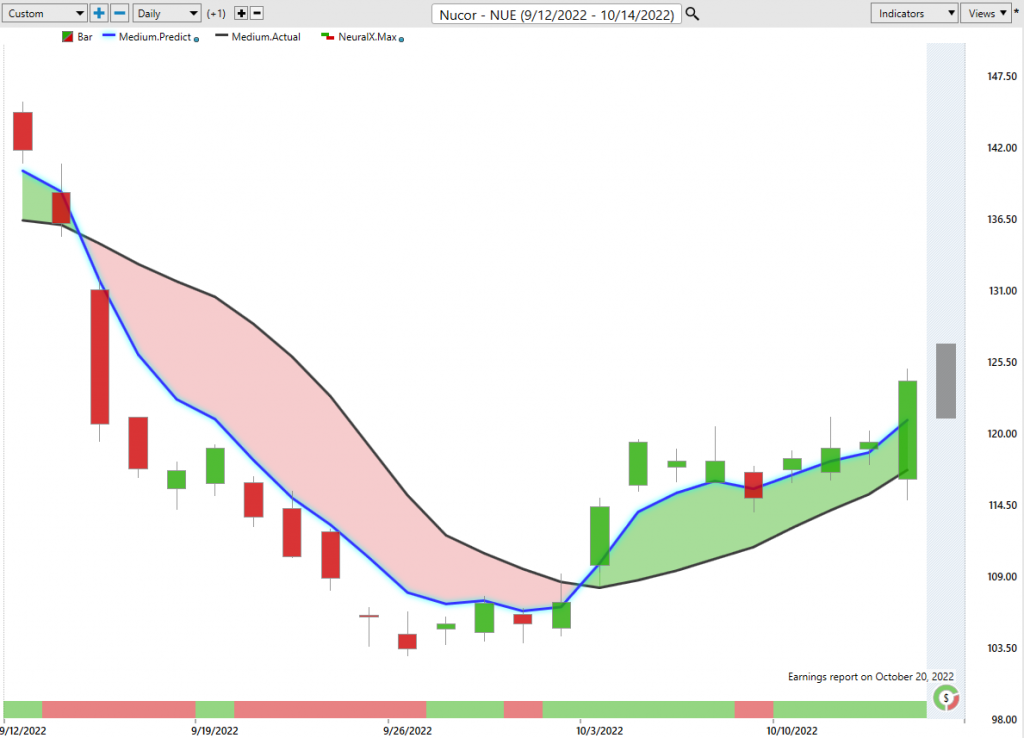
So we’re going to go ahead, we’ll start out with shares of Nucor steel here. A lot of energy opportunities I want to go ahead and go through, and then we’ll end on Haynes brand and Activision, which we’ve looked at over the past couple of weeks here as well. So starting out with shares of Nucor, really good example of how every forecast is going to work here in the software. So you’ve got daily price action here. Each one of these candles represents a full and complete trading day. And right up against that price data, you’ll notice that there is a black line there, and also a blue line. So the black line that you’re seeing there, that is actually a simple moving average. So it’s a very common technical indicator, and specifically in this case, what it’s doing is looking back at the previous 10 closes, it’ll add those all together and divide by 10.
So what that does for a trader is, really it acts to smooth out the existing price action, but it really just lets us know where a market has been over a given period of time. Obviously as traders, we want to be ahead of that next move, and understand where are prices going next. And so what the trader’s able to do is actually compare that black lagging moving average, or simple moving average to this blue line. And this is a proprietary predicted moving average, and for it to be generated, this is where the technology of artificial neural networks are coming into play. And specifically they’re performing what’s called intermarket analysis.
So it’s applying those artificial neural networks to a data set. And what is that data set? Well, it’s all the markets that are known to drive and influence future prices, specifically of the markets that you’re trading. So here in really most markets, if you’ve been trading, seeing how important dollar index has been to your portfolio. But also things like other metals and the gold market, or the crude oil market. But also subtle things like global interest rates or global currencies. And it goes all the way down to those ETF groups, as well as other individual stocks which share some very important market relationships. And these relationships offer clues to future price. So what happens is those artificial neural networks generate future price predictions based on those intermarket relationships, and generate a highly accurate forecast of where prices are headed next. So in the context of the overall trend, whenever we see this blue line, or predicted moving average cross above the actual moving average, it’s suggesting average price are going to start moving higher.
Now, in addition to that predicted moving average, those neural networks are at work doing some other problem solving for you. So if you look at the very bottom of the chart, you see this bar that goes from green to red and back to green. And this also is updated each and every trading day, but it’s forecasting short term strength or weakness just over the next 48 hours. So you can combine that with your trend forecast to understand, okay, well what’s going on here? What should I expect over the next 48 hours to deal with that volatility appropriately? And then to really round out these forecasts, you’re even provided a predicted high, so an intra day predicted high and predicted low level that the trader can use to set stop limits and all those advanced orders.
So here you see we have this Nucore crossover to the upside, neural index bullish. And this neural index is highly accurate. Pretty much four out of five times. So when you’re using it to get that short-term strength or weakness, you see it goes bearish here and we get a little bit of sideways price action and price doesn’t move much, but the very next day it gets bullish, stays bullish, and the market advances. So what we like to do in these hot stocks outlook is also look at these predicted highs and lows. And what you have to understand is these levels are provided before each and every trading day.
So when you’re running through some of your scanning features that actually can highlight a lot of these crossovers right as they occur, what you’re going to recognize is, “Hey, something’s going on in Nucoresteel, but this is now two weeks ago.” So you can recognize that something’s shifting in certain areas of the market, but at this time, did you want to be buying tech stocks, or any of those popular stocks out there? Well, no. But in Nucore we have a strong cross of the upside and these levels to help you identify places of value to trade. And so here’s yesterday where there was a lot of volatility, a ton of markets found new lows. But what happened in Nucore? Well, Nucor was in an up trend. The blue line was above the black line, and you see that yes, you get a little bit of a gap down, but how strong are those forecasts there? Saying, look, if you want to look for a bullish trade, this is a more appropriate place to do it. And if you’re there ready, I mean you’re going to get filled at the open and make a lot of money as that market advances.
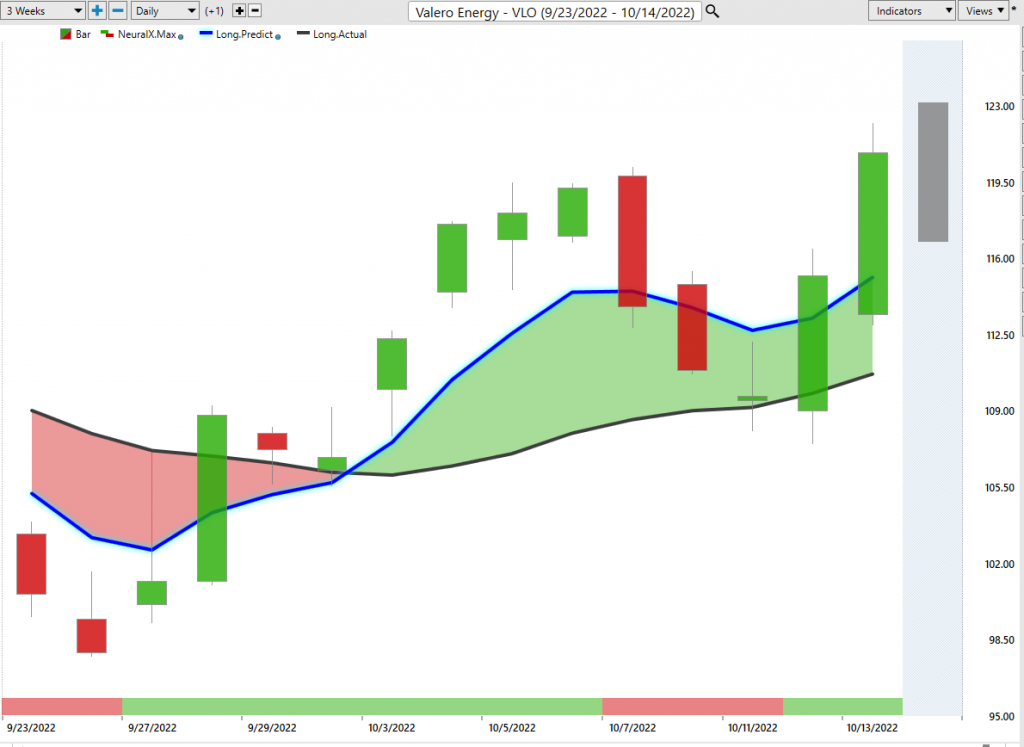
Now, last week we looked at Valero. It’s a very similar situation here, but longer in the trend. And this is what’s cool about this. As you see, we get this crossover to the upside long before all those volatility comes into the market. And that’s what you need understand is when you can get those good entries, then volatility comes in, but you can more appropriately deal with that volatility when you have that advanced notice.
So we looked at this last week. Valero blue line crossing over black line, really nice entries here early on in the trade, but also letting you know that, hey, crude oil’s moving up here. These crude oil energy stocks, you need to be careful. But what we got here is all this volatility and what you’re able to detect is, “Okay, well what’s going on here? Is this market starting to reverse or is this still in an up trend?” And you see how these predicted lows do a really great job of letting you know, “Hey, intra day, look down at these levels if you still want to be a buyer.”
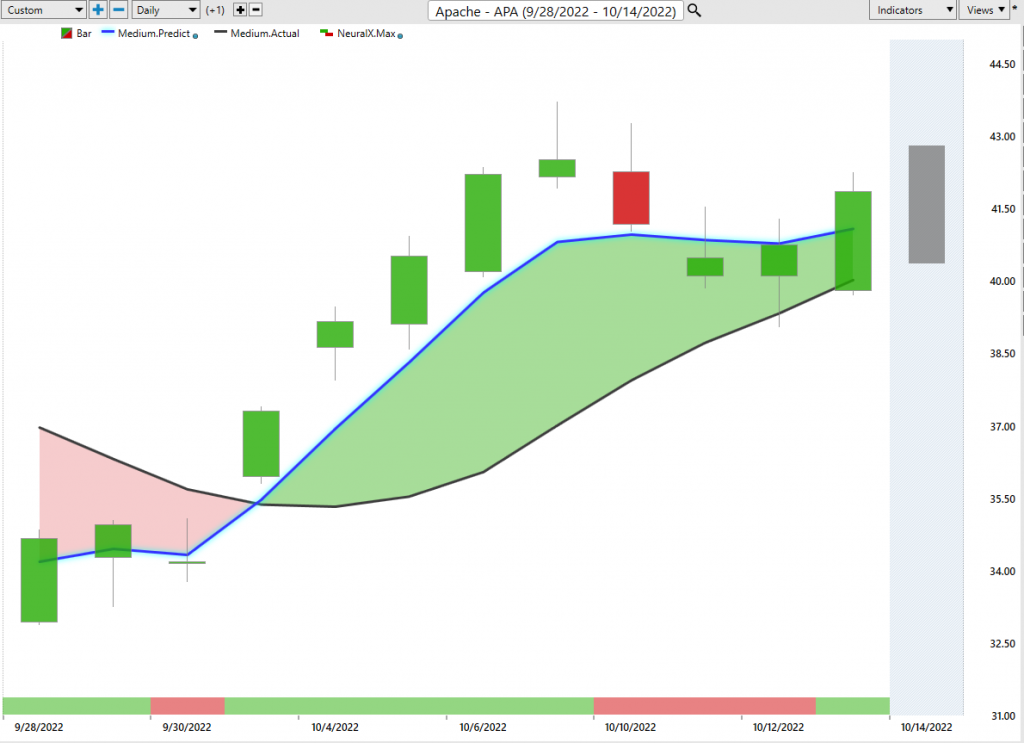
And we also notice that, hey, well our blue line is still above the black line. We never got that crossover to the downside, and not only did we not get that crossover to the downside when we look at other shares like Apache here, very similar crossover to the upside, and you see this neural index bearish and a lot of strength as far as the distance between that blue line and the black line. And again, if you’re looking for places within the energy space to trade, well, it became apparent that you can look to buy on the dip, and if you want to do that, look towards these predicted levels.
So when we get this lower move in oil and prices come off, well this is where things can guide you to make the most of that opportunity, and even make money in these environments where you’re buying at these predicted lows, targeting these predicted highs, and keep expressing that trade idea. So here in shares of Apache, again, a pretty nice move here in many of the energy shares here. About a 16% rally in the past nine trading days.
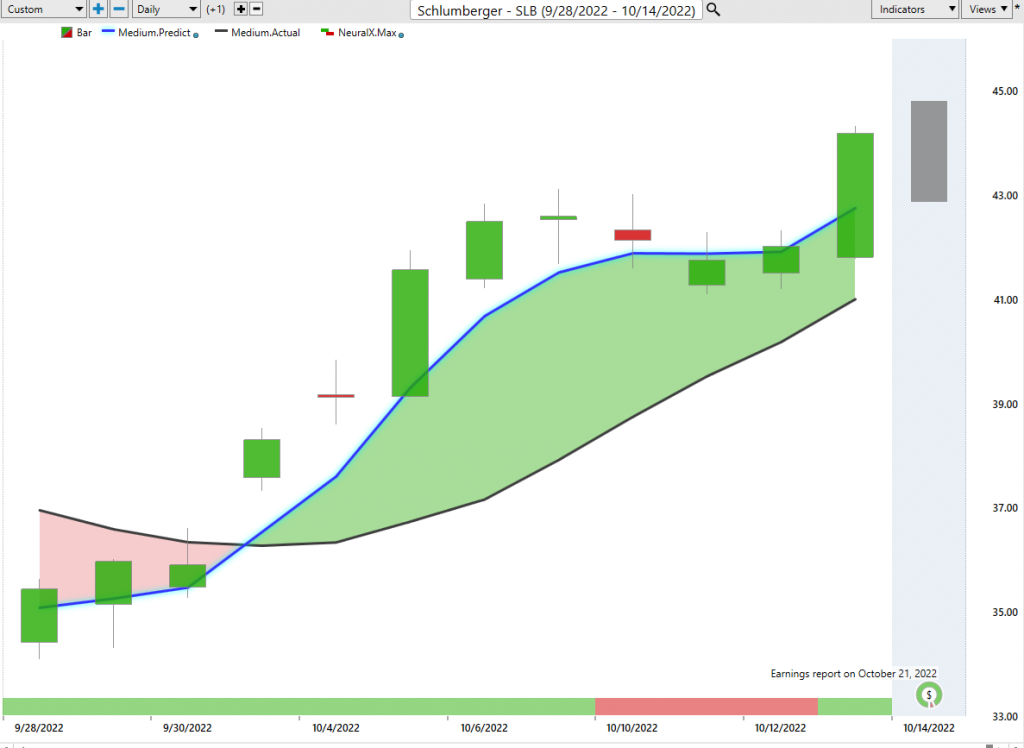
Here’s Schlumberger. And you see how similar all these examples are, so when you’re looking at, okay, well markets are still very weak here. We don’t want to be buying up everything, but something’s going on in energy, Valero, Apache, Schlumberger, the crude oil market itself, all getting these crossovers to the upside and indicating to the trader that now’s the time to get long, and here you may see some weakness and some sideways price action, but you’ve got the help of those artificial neural network driven levels.
And this is where you’re going to have an advantage over the other market participants when you’ve identified a place to trade, and then have to go in and execute and manage that position. Pull some money out of it. So really nice move here in shares of Schlumberger, and again, you can see when you take a look at this is the effectiveness of these short term forecasts. Neural index very bullish, lot of strength. Neural index gets bearish, you’re in retracement period. But when you’re ahead and aware of what’s going on, it’s going to be a lot easier to scoop out some money there.
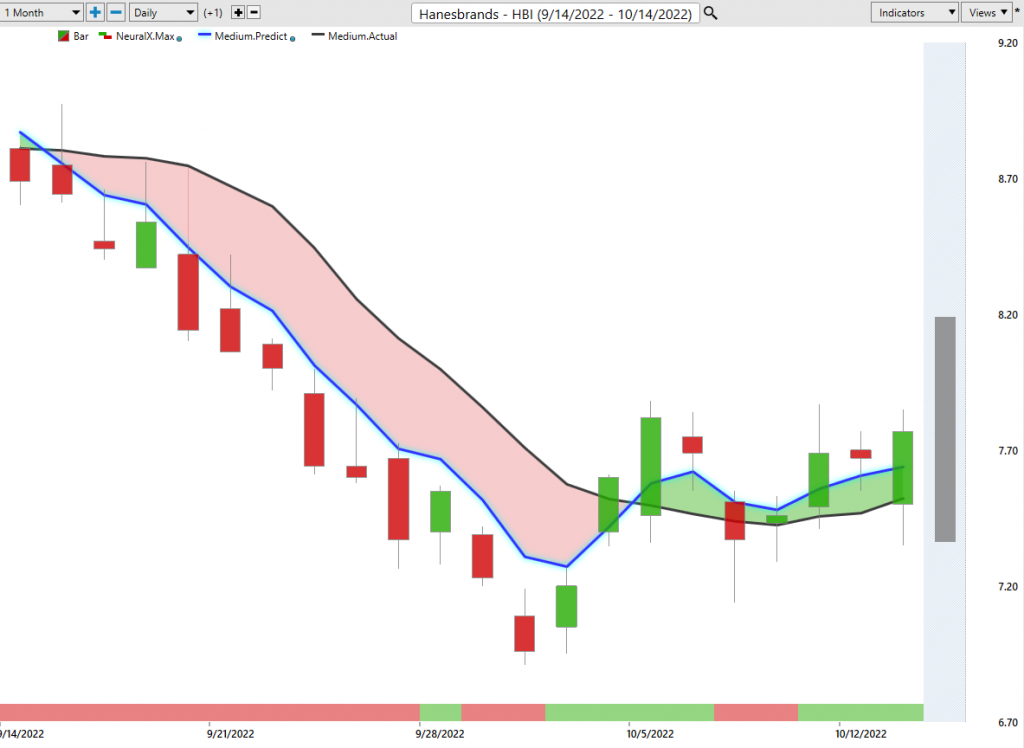
Now, I brought through this stock last week just because we started to see some markets shift. And it’s back to this point of you want to be in this stuff if you’re getting long that’s in up trend, and avoids things that are still in the down trend based on the forecast. So here we have shares of Hanes brand, you get this crossover to the upside and you see markets pretty much run flat here. But again, when you have a really effective tool that’s going to help you manage these opportunities, you see that, okay, well you get this squirrly day coming outside the range, but this is what’s so cool about artificial neural networks is it’s going to take in all the data from this. It’s going to look at those inter market relationships, it’s going to then forecast future prices and then get those forecasts back online for the trader so that they can make better trading decisions. And again, you see that neural index gets bullish, and here on this wild day in the market, you go all the way down to that predicted low, it’s about 740 and you’re trading up towards about 790 very, very quickly there.
So it’s a very aggressive move, four or five percent move intra day, but from the levels that you’ve identified in the markets where you’ve at least identified that, look, these aren’t in down trends anymore.
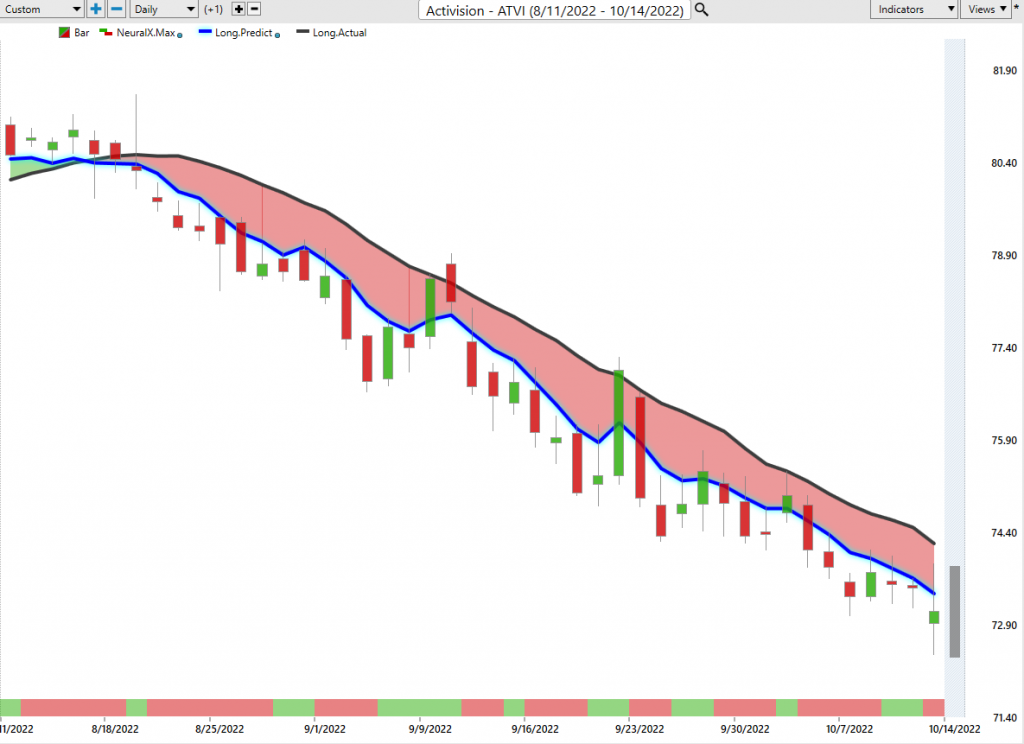
Now we kept looking, week after week, at Activision. And so curious enough, here we have Activision not moving into an up trend. So you had a lot of markets pivoted and turn there. Okay, great, you can make money in the energies in some of these other areas. But here in Activision you see that that blue line stays below the black line. You never get any crossovers to the bullish side. And then again, the help of these predicted highs and predicted low levels. So this week if you’re looking for a short, well there it is screaming at you there at that predicted high to get some bearish exposure potentially to equities, and make some money even yesterday as some markets move up, but not here in shares of Activision.
So it just makes it easier to say, “Okay, well where are the markets that are doing the things that are more likely to perform well, and where should I avoid?” So you’ve gotten about a 10% decline here as the market just grinds lower and lower. We keep highlighting this each and every week here, because you’re not getting that pivot to the upside like you are in some of these other areas. And it becomes very clear if you want to stake out any bulls positions where you should focus that attention, get those good entries, and make a lot of money as things advance.
So we’ll go ahead and leave it there. Once again, this has been the hot stocks outlook for October 14th, 2022. Thank you all for watching. Best of luck and bye for now.