Register for a Free Live Training
The Hot Stocks Outlook uses VantagePoint’s market forecasts that are up to 87.4% accurate, demonstrating how traders can improve their timing and direction. In this week’s video, VantagePoint Software reviews forecasts for Chubb ($CB), Texas Instruments ($TXN), Activision ($ATVI), Pfizer ($PFE) Target ($TGT), Royal Caribbean Cruises ($RCL), and Ulta Salon ($ULTA)
Hello again, traders and welcome back to the Hot Stocks Outlook for September 9th, 2022. Hope y’all are having a great week out there in the financial markets. And as always plenty to cover here in today’s outlook. I really have a lot of charts I’d like to cover here.
We’re going to start out with Chubb. We’ve got Texas Instruments and Activision. So a couple of the tech stocks we looked at over the past couple weeks. Pfizer, Target, Royal Caribbean, and Ulta salon. And I really want to go through all these and really highlight this point of how to utilize this technology to make better trading decisions here. So starting out here with shares of Chubb, this is a really good example of what’s been going on in the broader market. We had past couple weeks of some weakness coming in. That’s really where we highlighted a couple of these tech stocks, but let’s go ahead and go through this chart as an example of how to use all of these tools, really, regardless of your trading strategy or approach here.
Now, what you have here is daily price action. So each one of these candles represents a full and complete trading day. And right up against that price data, what you’ll notice is there is a black line there and also a blue line. So the black line that you’re seeing there is actually a simple moving average. So that’s a very common technical indicator. In this case what it’s doing is just looking back at the previous 10 close prices. It’ll add those all together and divide by 10. And really the weakness of an indicator like that is it’s really just getting all of the information from past close prices. And so it acts as a good measure of where market prices have been over a given period of time, but obviously a trader wants to be ahead of that next move and understand where are prices headed next.
And so what the VantagePoint users are able to do is actually compare that black simple moving average, or what we might call a lagging moving average to this proprietary predicted moving average. And so for that number to get plotted and calculated and plotted against the chart each evening, this is where the technology of artificial neural networks are performing what’s called intermarket analysis. And before that value gets plotted, VantagePoint’s technology is looking at intermarket relationships. So markets that are known to drive and influence the future price of the market you’re trading. So that can be things like the broader markets, like the S&P 500, that can be things like individual ETF groups, but as we’ve seen more broadly in the markets, how important has the Dollar Index been to the broader market or oil prices or gold, depending on what stocks you might be trading.
And it’s able to look at those relationships, even down to other individual stocks that share those important, whether they be positive, inverse relationships, and it’s summarizing all of that information and generating a true price prediction. And it’s that technologically driven price prediction and that value that’s used to construct these indicators. Rather than having a tool that just looks back at the past close prices, this is a forward looking predictive technology. So whenever that blue line crosses, in this case, you see below the black line, it’s suggesting average prices are going to start moving lower. And this is again, what we see as we run features like the IntelliScan and it picks up on this broad based market weakness.
Now, if you go to the bottom of the chart, you’ll see that you have another bar here and it can go from green to red, back to green. And this as well is utilizing that technology of artificial neural networks, but very important to understand, it’s solving a different problem for the trader and this problem being short term strength or weakness in the market. You can think this as really a 48 hour indicator. Really a couple candles is really what it’s covering. And again, it’s extremely accurate. Has an accuracy of upwards of 80 plus percent accuracy over really a wide number of markets through earnings reports, Fed announcements. And it’s getting that very short term forecast of strength or weakness. And we can take those short term forecasts and combine them with the other predictive indicators.
So you’ll see here as the neural index and the crossovers move to the downside, we just get broad based weakness over that time period. You see the neural index pops up to a one here and you get actually a gap up, but the overall trend is very much to the downside. So you can expect those higher highs over the next couple of training days, but the bigger move is clearly to the downside. You’ll notice as the neural index gets bullish, we start seeing this strength come back into the market. And so a trader who’s managing this position can understand, hey, look, there’s likely to be some strength over the next couple of trading days, but as we’ve run a lot of the features IntelliScan and utilize these tools to track these markets moving forward, well, we’ve potentially seen a very important shift here.
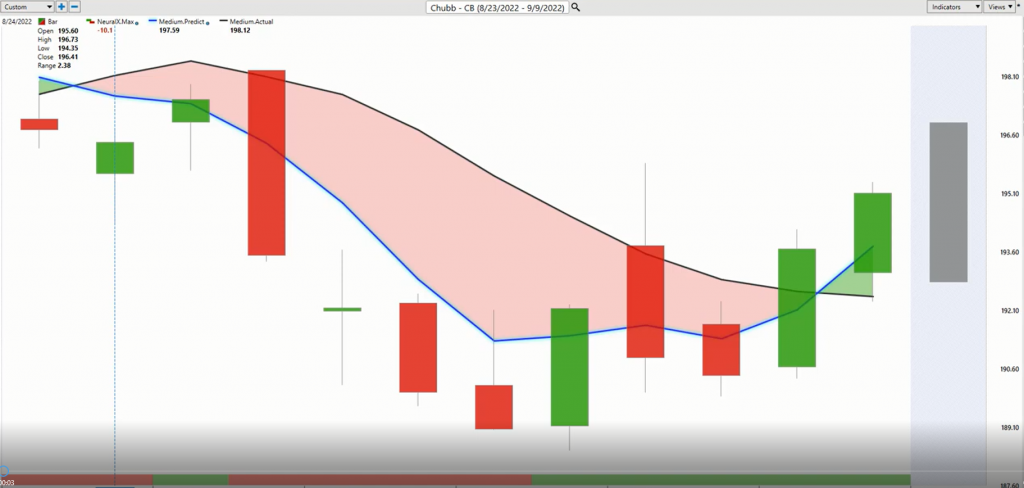
Here. We see shares of Chubb, a very strong crossover to the upside, blue line over black line neural index bullish. And as we go through these subsequent forecasts, what we’re going to also look at is you get a predicted high and a predicted low, so intraday levels to help guide those trading decisions. And you can see just how accurate on the way down. Well, these are some great levels to go ahead and look to short up near those predicted highs. And you see as the market recovers, how you want to go ahead and cover these positions down towards these predicted lows, expect the market to move up towards these predicted highs. But now we’ve got a situation where that crossover is very much to the upside. So let’s go through this and let’s take a look at this.
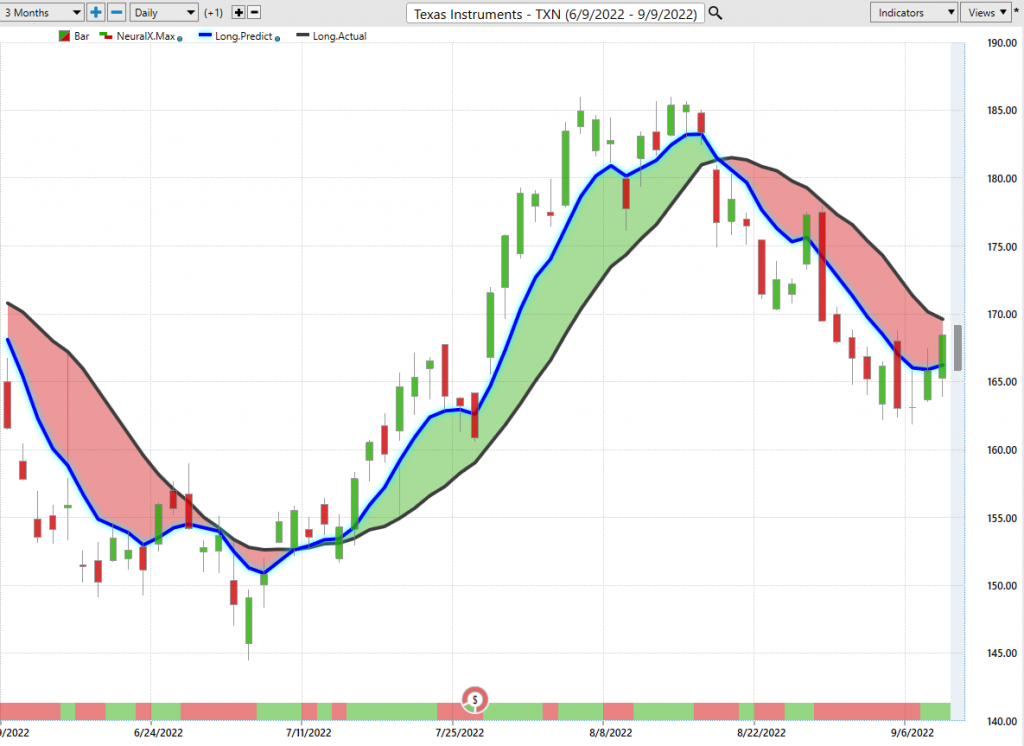
Now I wanted to highlight a couple of these stocks, Texas Instruments and Activision, just to highlight that we do have some crossovers to the upside. If you’re trying to position the portfolio along, you can utilize the IntelliScan features to identify where those markets are shifting. But here Texas Instruments, you see, you have this crossover to the downside neural index bearish. And this is one of these markets that we brought through, now, I mean, I think it was the day of the crossover here, highlighting this shift towards the bearish side of the market. And so you see Texas Instruments, you only want to take profits on shorts and you don’t have that blue line crossing above the black line.
Now that doesn’t mean that you can’t go ahead and get long in the market, it just means that maybe there’s some better places outside of Texas Instruments to go ahead and take on that exposure. And so we see this market still moving lower here, the crossover to the downside, but we’re seeing strength come in here. We see the neural index gets bullish. We see that predicted moving average start to narrow, and we’re actually starting to see some areas of the market reverse. So again, here’s Activision. This was again, one of these early markets that we started to see this weakness and understand look, pivot that portfolio, get some exposure potentially to the bearish side, if not take profits on your Apple longs or whatever it was at the time.
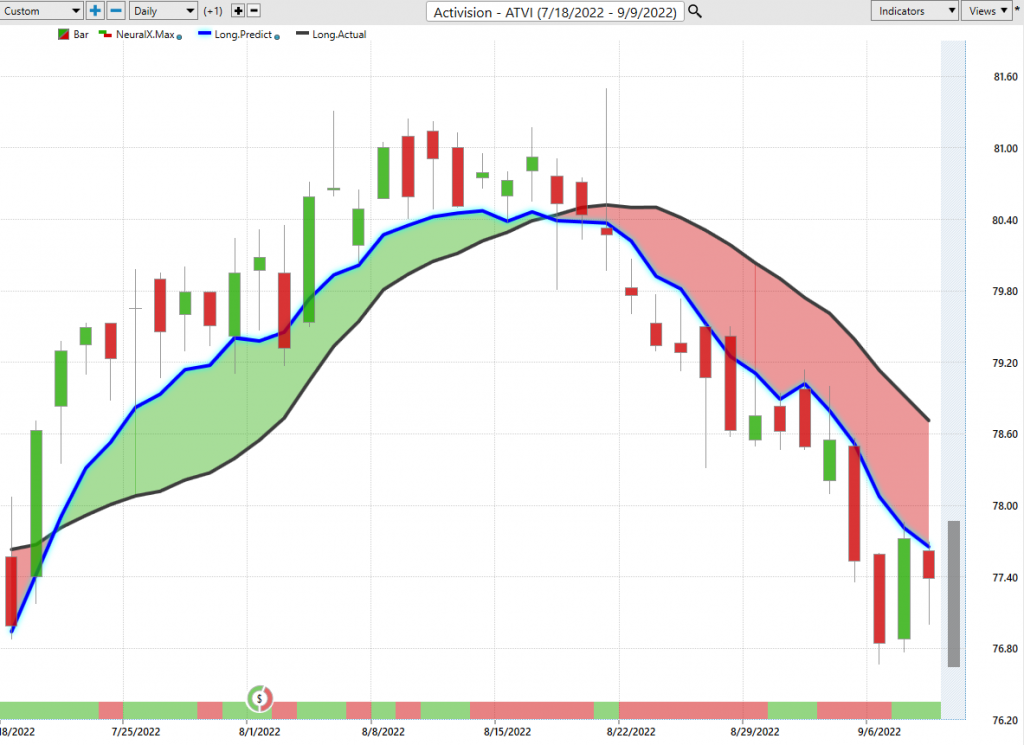
But here Activision, you see, this is not looking good.
So if you’re looking for areas to go ahead and get long in the tech space Activision is still not looking all that great. Now this isn’t a huge move. It’s just been grinding lower and lower as we’ve seen this broad based market weakness. But again, you can bring in tools like the predicted highs and lows and see how accurate a lot of these levels are. I love bringing in days like this, where you see this predicted high here, and you see that the market just gravitates towards these levels. So you get a lot of illiquid price action here, things flopping around, but these levels often end up getting filled and you want to have orders potentially waiting at these levels to take profit, make trade adjustments. But you see very clearly is you only want to be short taking profits on shorts, potentially taking profits towards these predicted lows and resetting that short position.
But again, just highlighting this shift to the downside that we’ve seen and how a lot of the tools within VantagePoint like the IntelliScan feature, help us identify that and clearly places where you do not want to be buying the market. But let’s again, understand how these tools can help us recognize some of these shifts. And while some of these things may be in a down trend, what we’ve seen Chubb, here, shares of Pfizer, actually having a crossover to the upside here. And I just bring this through to very clearly had a lot of weakness come through. So go back and watch the previous hot stocks outlooks.
We see those crossovers, keep moving to the downside, highlighting a lot of this weakness, just cascading over the broader S&P and the NASDAQ, dollars shooting straight up. Well, that led to a period where, hey, maybe you want to short, take profits on short positions. And the guidance here would say, okay, well look towards these predicted highs and lows to go ahead and express that position. But as the market starts to shift your VantagePoint tools and that process that you set up will actually clue you in that, hey, things are shifting here. Now, Texas Instruments and Activision, may be a little bit more weak here, but clearly Pfizer’s now in an uptrend and you may want to actually change the overall trajectory of that portfolio to accommodate these bigger shifts that are happening in the S&P, the Dollar Index and some of these important markets.
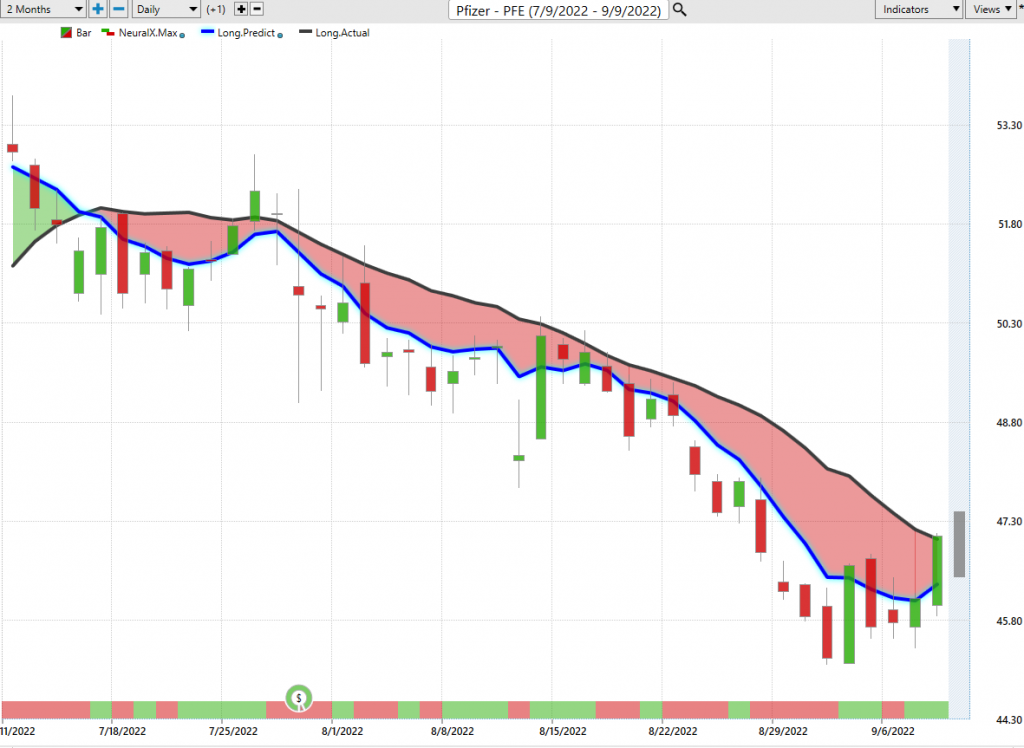
So here, Pfizer, we just had a crossover more recently, but where might, you may see some of this strength already starting to creep into the market?
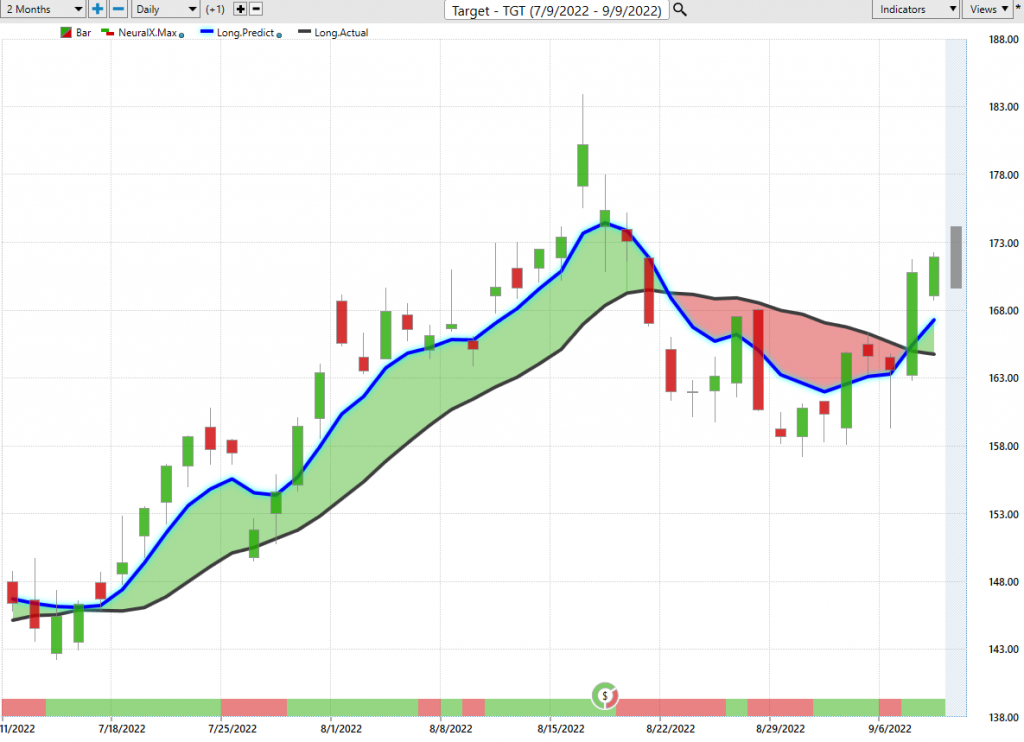
Well, here shares of Target, you see three, four full days ago here with that crossover to the upside neural index bullish. And you see here how the tools all work together, that if you’re coming into a day like here on September 6th, saying, okay, well, I want to look to be a buyer. You have these tools again, this predicted previous low, this predicted low here, and you see the market close within the range. And the overall trend is to the upside, meaning this is clearly a place where there is some strength and will likely benefit when the broader markets start to catch up here. And you see a lot of separation between that blue line and the black line, and a very strong neural index that 48 hour forecast, as well as the predicted high and low moving higher over this time period.
Royal Caribbean Cruises ($RCL)
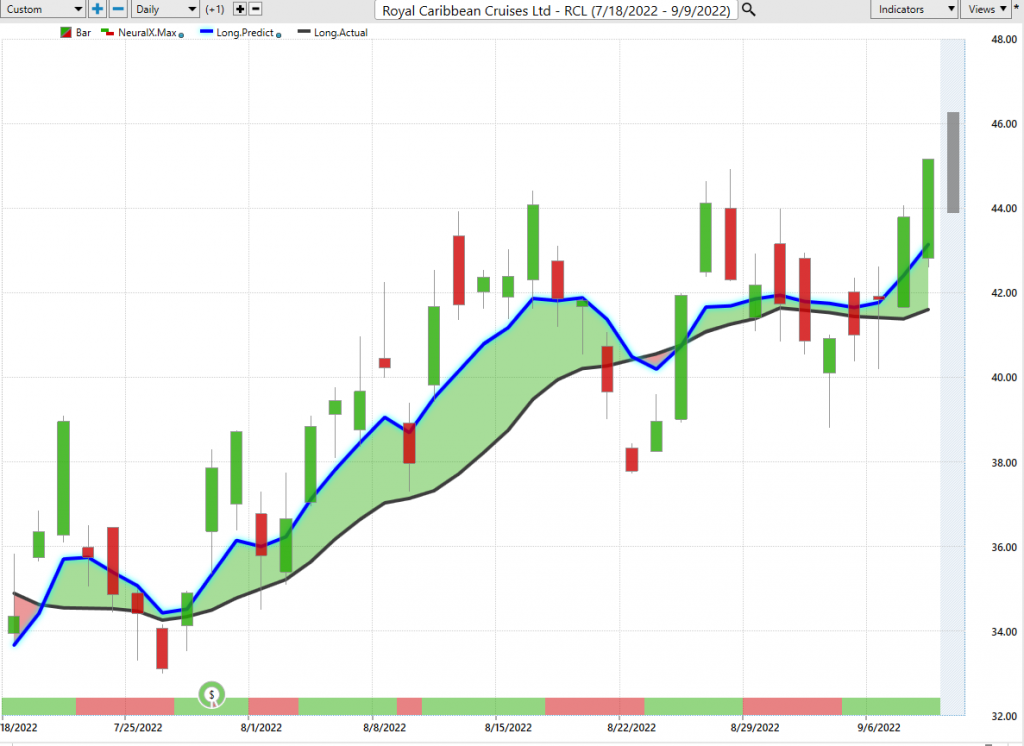
Here’s Royal Caribbean, and again, a crossover all the way back here in the market. And as that broad base weakness is still playing out on the S&P and the broader markets and Dollar Index is shooting straight up. You see that it puts some pressure on this stock and things run sideways, and the neural index does a good job of picking up on that. So you can imagine that with the short term forecast, you’ve got things like the Dollar Index, a factor in that analysis and saying, look, in the short term, there’s going to be some weight on these individual stocks. But as long as that blue line is still above the black line, this is really a place where there’s more strength.
And you see, as the S&P and things start to recover, this market does extremely well. And the forecast coming all the way back here since the 5th of September showing, look, there’s a lot of strength here. If you want to use even shorter term predicted high and low tools. Well, this is again where VantagePoint can be very effective highlighting these places of strength, and then come in with those shorter term forecasts to exploit that opportunity. So shares of Royal Caribbean here, again, very early on here. We haven’t gotten huge moves in the market or anything, but market’s popping up a little bit here about 9%, really just in the past couple trading days as this market moves higher.
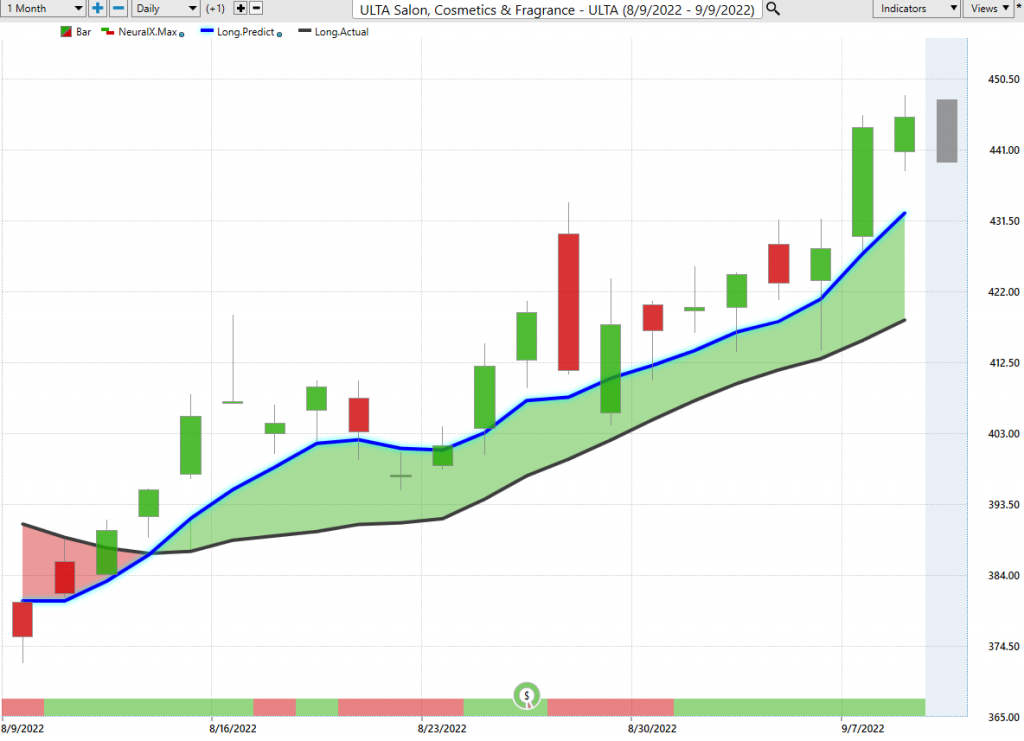
Here’s Ulta, and again, just highlighting that there are some stocks where there’s been some persistent strength here. Clearly you don’t want to go ahead and short, like some of the tech space here over the past couple weeks, and this can be a really clear roadmap of where you might want to exploit the bullish side of the market. So you see here over the past couple weeks, if you’re looking for bullish forecast, well here in Ulta blue line well above the black line neural index, very bullish. And if you’re using those short term tools, you’ve got a pretty good roadmap here of where might you want to look to scoop up some shares of some value here.
We looked at this very similar situation in the energy space. A couple weeks ago, we’re going into the week, stocks are really looking terrible sideways and down, but the energy space had some really good levels to take a position. And we saw oil pop higher, and a lot of things do well here. Well, this is where you want to focus is where all that strength is coming in. And maybe more importantly, recognize those shifts in the marketplace, because those represent not only dangers, if you’re on the wrong side of that, but really fantastic opportunities that are opening up throughout the market.
So again, just highlighting, we’ve had this move lower, but you got to pay attention here and realize that things are shifting and where might be the better places to go ahead and exploit that strength and other areas where you may just want to avoid entirely, get them off the radar and focus on again, where things are shifting and leading the way. So we’ll go ahead and leave it there. This again has been the Hot Stocks Outlook for September 9th, 2022. Thank you all for watching best of luck and bye for now.