Register for a Free Live Training
The Hot Stocks Outlook uses VantagePoint’s market forecasts that are up to 87.4% accurate, demonstrating how traders can improve their timing and direction. In this week’s video, VantagePoint Software reviews forecasts for Southwest Airlines ($LUV), Lululemon Athletics ($LULU), Pfizer ($PFE), Johnson and Johnson($JNJ), and United Rentals ($URI)
Hello, again, traders and welcome back to the Hot Stocks Outlook for April 1st, 2022. Hope you all are having an excellent week out there in the financial markets and like always, plenty to cover here in today’s outlook. Now, we’ll start out with shares of Johnson & Johnson. We also have Southwest Airlines, Lululemon, Pfizer, and United Rentals here. What I really want to focus on here with this Hot Stocks Outlook is really the adaptability of the software here.
We’re going to, like we always do, look at these really nice opportunities and look at the overall move. But I want to focus today on the neural index and how traders can utilize this tool to adapt, right? Understand that, hey, that most recent information has come into the market and this is where the technology of artificial neural networks really do an excellent job of recognizing those changes, not only in the target market, but those inner markets and giving you valuable information to make better trading decisions.
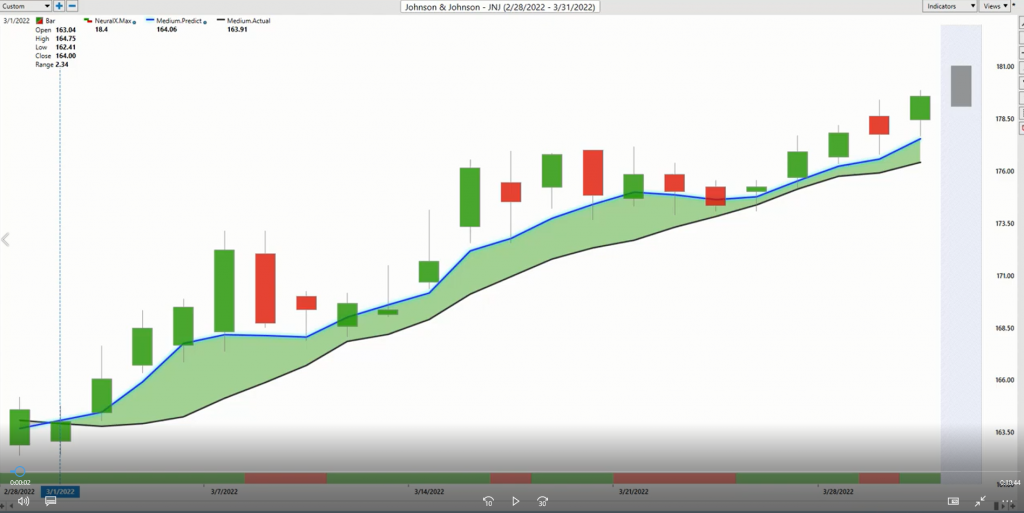
When we look here in Johnson &Johnson, what we have here is daily price action, right? Each one of these candles is representing a complete trading day. You can see we’re going all the way back to really the beginning of March here. Right up against that praise data, you’ll see that there is a black line and also a blue line. The black line that you’re seeing there is actually a very common technical analysis indicator. It’s a simple moving average.
And in this case, this is actually a 10 day simple moving average, so it looks back over the previous 10 closes. It’ll add those all together and divide by 10 and smooth out the existing price action. It’s a good tool to let us know where market prices have already been over a given period of time, but traders, of course, need to be ahead of the next move. What we’re able to do is actually compare that simple moving average, that measurement of where prices have been, to this blue value.
And for that number to get calculated and plotted against the chart every evening, this is where the technology of artificial neural networks come in and perform what’s called intermarket analysis. It’s important to understand that there’s extremely important price clues that can be pulled out of not only Johnson & Johnson, but markets that are known to drive and influence prices here. Now, this can be things like ETF groups. This can be into individual stocks, but it can also be important things like the value of the dollar index.
It can be global interest rates, as well as global commodities and futures prices. This is where some extremely valuable clues can be extracted from that data, not only as far as what’s happening next, but then when shifts happen throughout the marketplace, artificial intelligence does an excellent job of adapting and reacclimating those forecasts, so as the trader, you can adapt and continue to make good trading decisions.
Whenever that blue line, in this case, that value crosses above the black line, like every week we look at this, it suggests average prices are going to start moving higher, and therefore, it would make sense to look to take long positions. Right now there’s a long period of time here where you see that blue line remains above the black line. This is where tools like the neural index can help shorter term traders. You see this indicator at the bottom of the chart here, it can go from green to red.
At the very right hand side of the chart is where that will be updated each and every trading day. This will either be red or green after today’s trading day and inform you of short-term strength or weakness over the next 48 hours. Again, short-term strength or weakness just over the next 48 hour window. If you’re trading system can take in that timeframe, work with that, as well as these other tools, like the predicted highs and lows, you can again make better trading decisions in these windows, whether it’s adding to existing positions or just taking outright trades and positions freshly on the market for that day.
You see about a 9% rally, but take a close look at this neural index, which, again, you always want to look at as providing a signal then for the subsequent 48 hours. You’ll see that it stays green here and subsequently goes red here, and you see you get that weakness over the 48 hours of price action. You see it goes red over these periods and the market is running sideways, but that blue line remains above the black line, the neural index gets bullish once again, and then that momentum to of the upside accelerates.
Combining tools like this with, of course, these daily predicted highs and lows that are provided before each and every trading day occurs, allows traders to understand not only which markets you might want to be focused on because the IntelliScan will help you recognize those big shifts as far as the predicted moving averages, but where you want to maintain that focus and understand that, okay, well, if you’re managing this opportunity, you’ll see that on this trading date, right, we have a big down day.
You closed a little bit below the predicted low. This is where the technology is updating and saying, “Okay, well, let’s take that in. Look at what’s happening,” and then forecast out with these predicted lows to help you over that next period of trading. We see this often at times the market will maybe not hit a predicted high or low, but then the next day it hits this previous predicted high. And that’s those neural networks identifying those important levels, and then that volume coming to the market and moving towards them.
But you just see all these excellent entries along the way to help the trader manage the opportunity effectively. Shares of Johnson & Johnson, of course, really nice move here, but multiple pieces of the market taken out here as you’re getting increasingly better and better entries each and every trading day.
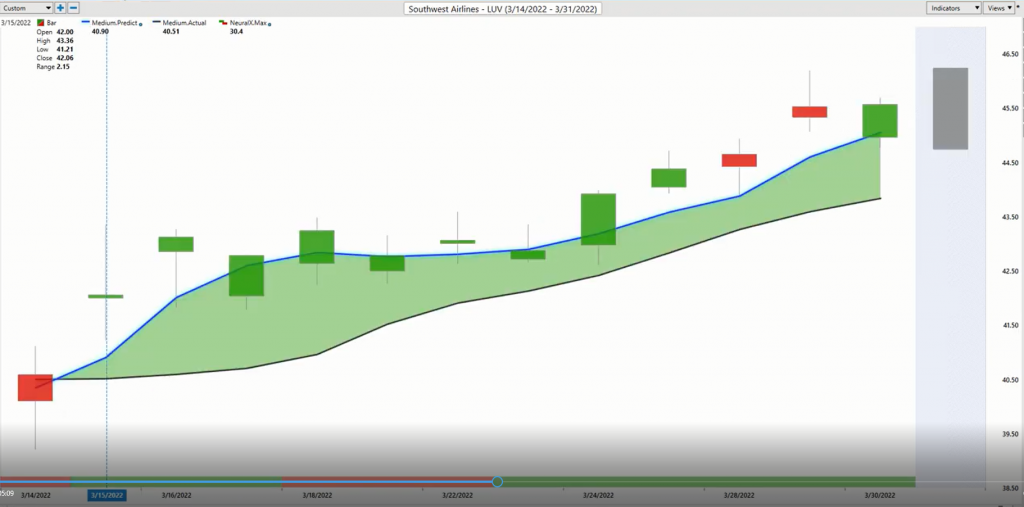
Now, here’s Southwest Airlines. Again, I want to be focused on we can… It’s very simple to see that blue line crossing the black line.
Very clearly we can see, okay, the trend is up, but really looking at the minutia of how this will actual trading decisions. About an 8% rally, but look very closely at our neural index. It goes bearish here, letting you know that over those subsequent 48 hours of price action, there’s some weakness, but then it gets bullish and you see the next day that momentum picking up to the upside. It’s important to recognizing this, again, is just looking ahead short-term, 48 hours at a time, and again will help you get ahead of that move.
Of course, tying in with predicted highs and lows here. We can take a look at those and see how effective they are, right? You understand that, hey, there might be some weakness here after this trading day. Certainly look down towards those predicted lows if you want to be a buyer and try to get the best price possible, but you clearly want to be long here.
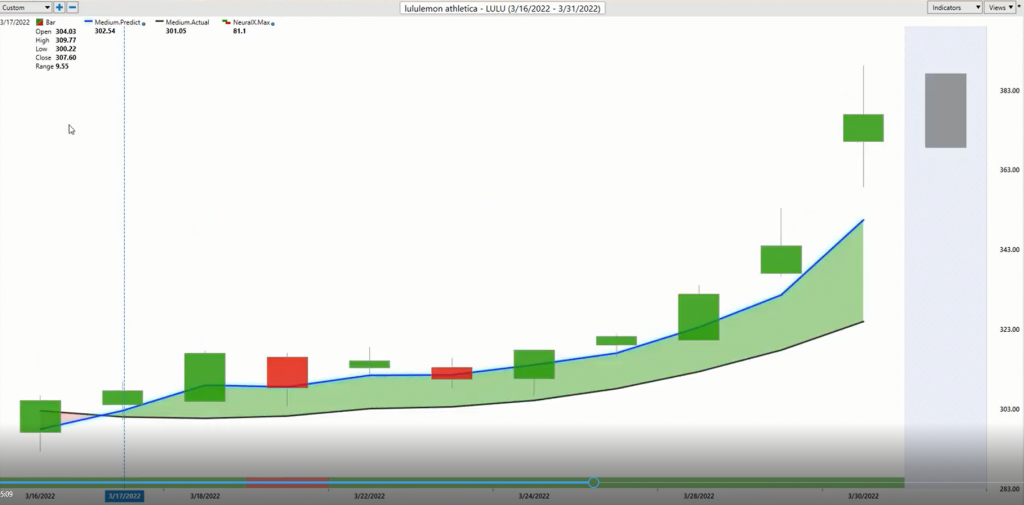
All right, so let’s move forward to Lululemon here. See this crossover to the upside? Neural index bullish.
Again, you see the bearishness of the neural index here leads to some sideways price action over the next 48 hours. But over those 48 hours, the subsequent forecast get bullish and say the next 48 hours, we should see things move higher. Again, you have to look at this as predictive. It’s always generating that forecast for a period, 48 hours ahead of that neural index.
This may it very easy for traders to understand that, okay, well, maybe there’s some weakness over the next 48 hours here, but I also have these intraday levels from VantagePoint to help me understand where that weakness is likely to move to. Again, helping whatever the trading style is, whether you’re a trend trader and wanting to add to the position, whether you’re just a day trader looking at where these forecasts the strongest. You see about a 23% rally.
We do have earnings coming through here, but the whole point is the software does an excellent job regardless of earnings, Fed announcements. The accuracy of this neural index is upwards of 80 plus percent accuracy, regardless of what’s happening over a huge number of markets. This is where when you work this into the trading decisions that you’re making, it can have some serious impacts onto where you’re even looking or how you’re getting involved in opportunity. Here’s Pfizer.
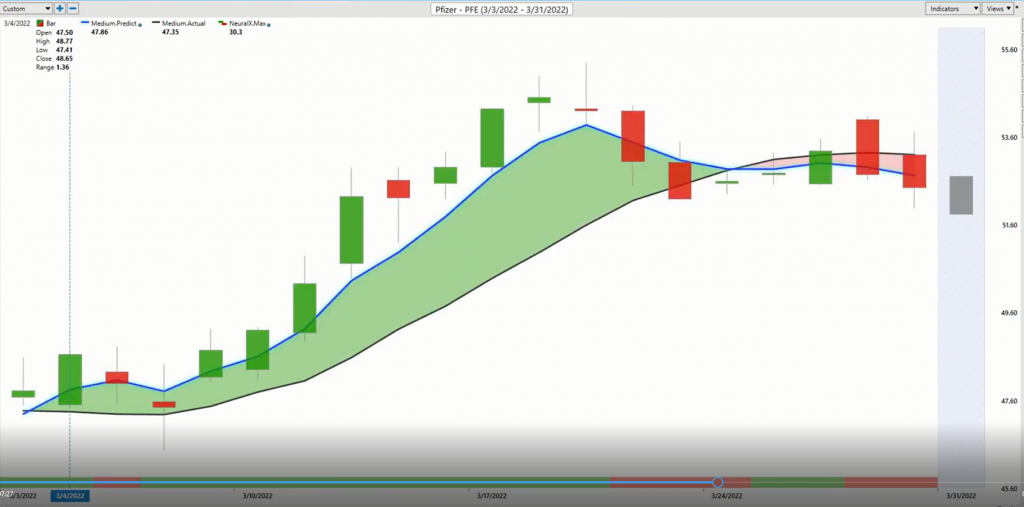
We looked at this actually a couple of weeks ago, as we recognized a lot of the strength coming into the market. But as always, it’s about recognizing that shifts, right? Adapting to the changing our market conditions. You see here, the neural index goes bullish and you get some lower lows over the next 48 hours, but even after the market actually trades lower that trading day, right? It gaps down and closes at a lower level relative to the previous days.
Neural index is bullish and saying strength over the next 48 hour periods, and you see that strength come in. But I just want to update these forecasts and highlight how these things can say, “Okay, well, neural index gets bearish here,” and it’s telling you expect that weakness, right? Expect the very least lower lows over the next 48 hours. You can see that’s important for a trader to understand and say, “Okay, well, at the very least, look for these lower price levels.”
But by the time we get down there, you recognize that, well, there’s actually been a cross over to the downside. So while this has been a nice opportunity on the way up, you see that blue line crossing below the black line and actually suggesting that the trader utilizing these approaches… Well, I’m going to slow down here, and this is where this gets really interesting, right? You’ll notice that the blue line is crossing below the black line, but the neural index is bullish.
Well, there’s higher highs over the next 48 hours of price action, but the overall trend is actually still moving lower here. You want to understand that as a trader, especially a short-term trader. Rather than looking at these predicted lows as good opportunities to get long, not only that, but you’re actually looking at these predicted highs as good areas to take profit if you are still long and actually look to short and make money as you, again, see this subsequent weakness move through over the week.
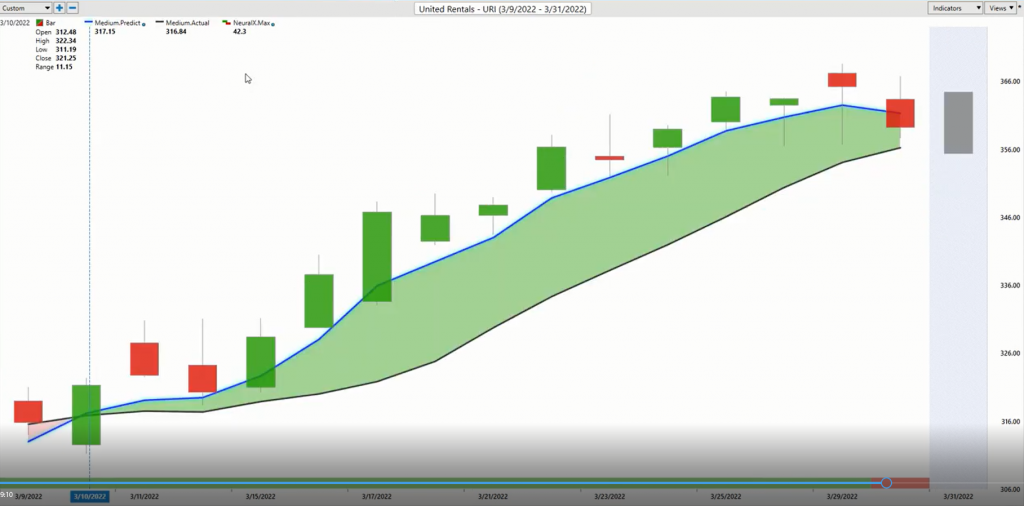
Lastly here, United Rentals.
And again, just neural index bullish up until really this previous trading day here. But again, I just want to bring these things in and highlight how it’s not just about recognizing when this crossover comes through. Certainly that helps us recognize these important shifts in the market, helps us recognize which sectors to focus in on, and this is where, again, these predictive tools when programmed year IntelliScan feature make it very easy to identify the types of opportunities that you’re looking for.
But within those strategies, if they are longer term, there’s opportunity to do some trade management here. You see about a 13% rally. You see over those 13 days, pretty much a straight line up saying, look, you want to be a buyer here. Take profits on longs. Your VantagePoint tools will, of course, be of assistance there if you’re trying to exploit that bullish behavior. But more recently, you see, okay, now expect some lower prices, expect some weakness over the next 48 hours.
And should something like you get that crossover to the downside like on Pfizer, you may need to make those longer term adjustments for your trading strategy, right? Take that 10% profit and make sure you’re not giving it back as the market wants to potentially move lower. Now, if the blue line crosses above the black line again, well, we can start utilizing these tools again to get long.
But we have to appreciate those tools for what they’re doing and how they’re going to consistently affect our trading decisions to help us make better trading decisions off of the help with this technology. I’ll leave it there. This has been the Hot Stocks Outlook for April 1st, 2022. Thank you all for watching. Best of luck and bye for now all.