


The Hot Stocks Outlook uses VantagePoint’s market forecasts that are up to 87.4% accurate, demonstrating how traders can improve their timing and direction. In this week’s video, VantagePoint Software reviews forecasts for Acorda Therapeutics (ACOR), Callon Petroleum (CPE), Dollar General(DG), and Electronic Arts (EA)
Register for a Free Live Training
Hello again traders, and welcome back to the Hot Stocks Outlook for September 3rd, 2021. Hope you all are having an excellent week out in the financial markets, and as always, plenty to cover here in today’s outlook. We’re going to start, we have shares of Acorda Therapeutics that really serve as a good example of how these VantagePoint forecasts work, really regardless of the markets that you’re trading. We have EA, we’ll look at Dollar General, and lastly take a look at Callon Petroleum which we’ve looked at really week after week after week here. But sort of highlight what happens with these intermarket relationships, and how this approach can really benefit you.
Acorda Therapeutics
So what we have here with Acorda Therapeutics is daily price action. So each one of these candles represents a full and complete trading day, and all of these forecasts work off of end of day data. So you have all this information going into the trading the day really at 6:00 PM the night before, and then after the close all this gets updated, so you have all the information you need for the next trading day. So what happens is right up against that price data, you’ll see that there is a black line and also a blue line there. Now important to understand these values and what they are.
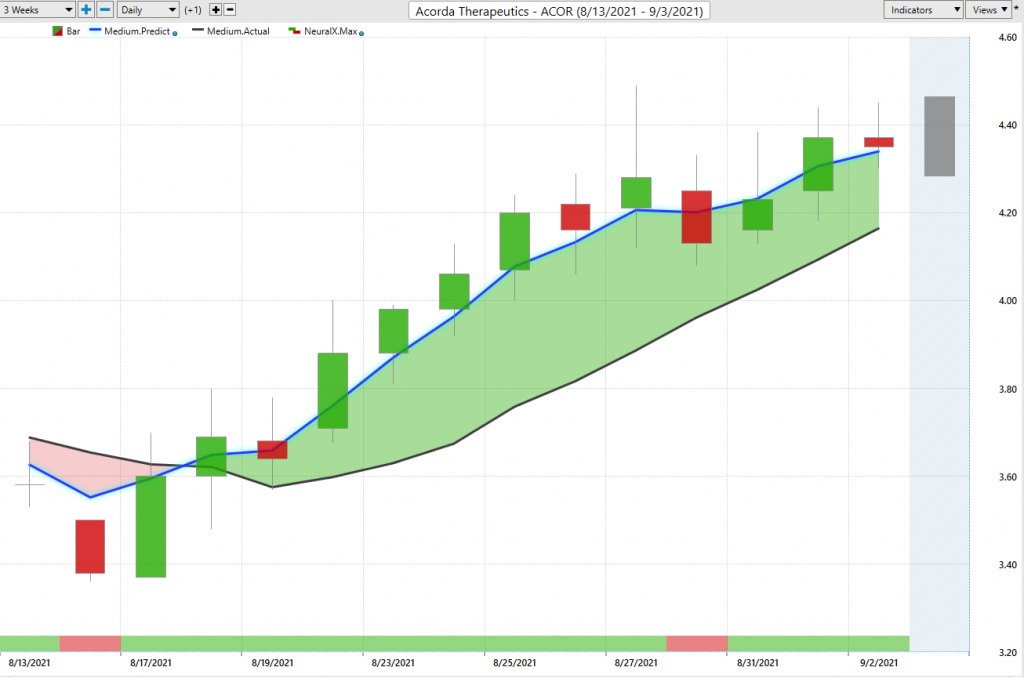
Now, the black line that you’re seeing there, that is a simple moving average. So very common technical indicator. All it does is it’s going to take the past 10 close prices in this case, 10 closes, add those all together, divide by 10, and it acts to smooth out the price data. So we can think of that as letting us know where the market has been over a given period of time. We don’t just want to look at the close. Say, okay, well where on average has this market been trading around?
But traders need to know where the market’s going next, right? They need to be ahead of a move. And so this is where VantagePoint comes in. And so what we’re able to do is use that simple moving average essentially as a baseline, and what we can do is compare that to this blue line that you see against the chart. But for that value to get plotted and calculated against the chart and updated every single trading day, VantagePoint is performing what’s called intermarket analysis, and it’s utilizing the technology of artificial neural networks to do that.
Now, let’s break apart what that means. Now what that means is, specifically for Acorda Therapeutics, the artificial intelligence has determined that there’s up to 30, 35, upwards of 40 markets in some instances, of markets that are known to drive and influence the future price of shares here. Now, that can be things like ETF groups, right? That can be things like individual stocks. That can certainly be things like the broader stock indices, global currencies, global interest rates, or global commodities like crude oil, gold prices. And so it’s taking all of that into account, understanding those relationships, and actually generating with that information a future price prediction of where prices are expected to go.
So rather than having technical indicators that only look back at past prices and really just reconfigure past prices in new ways, they’re not predictive at all. What this tool is able to do is look at those intermarket relationships, gather insights that a human just wouldn’t be able to do, and actually project forward of how those markets are affecting the markets that you are trading in. Essentially the target market we call it. So this is very important, because what happens is that predictive data that’s generated via the technology is then built into this value. So rather than having a backward looking simple moving average, you have a forward looking predicted moving average that’s going to do a lot of good, especially when we want to find trend reversals in the market and really get a sense of how different markets and sectors are rotating, and how we can recognize these shifts in the marketplace. It can be extremely profitable.
Now in addition to just that predicted moving average though, you look at the bottom of the chart here and you see that there’s a green bar. You see it goes red here back to green. And in the same way, it’s at the end of the trading day, so this is really yesterday’s trading. At the end of the trading day, that will get updated with whatever occurred today. And not only will you get this neural index output of green or red, but let’s explain this. This is also using that artificial intelligence, but it’s a very short-term strength or weakness in the market, and it’s configured to just be a 48 hour forecast.
So what’s very important with neural networks is that you can train them to have a goal, and they can be very good at learning how to accurately achieve that goal, and that’s what’s happening here. What we have is a tool that essentially, four out of five times it’s going to get right short-term price action up or down. Now that’s about an 80% overall accuracy, and you can see here that it’s getting it right, getting it right, getting it right. It gets it wrong here because the market price continues higher, but you see how it quickly gets bullish again and the market’s moving up. Overall, the trend has said, look, the overall trend is up, expect average prices to move higher. And this is how we’re able to use these tools, but actually in combination here with the last part of this, a actually predicted high and predicted low.
So really piece this all together. You’ve got your predicted moving average, short-term strength or weakness that can help you with volatility over these types of moves, and an intra-day predicted high and low level which we can actually go see, how accurate are those levels at helping us assess what’s going on, and I’ll bring those up. And we do this every single week, and we can go back and look at markets we’ve looked at previously and see how the updated forecasts have fared here. But you see here that when you have a tool like this, it’s very easy to say look, you know you only want to be a buyer. And what the software actually does really well is, even when you get volatility and things maybe go a little bit outside the range, it does a great job of adjusting and getting things back on track, because it understands those intermarket relationships, it understands what’s changed here, and what’s changed in other markets that may be affecting things going forward.
And so really nice move here so far on Acorda Therapeutics, but this is just like those markets that we looked at a few weeks ago that are benefiting off of the strength broadly in the S&P 500. And so we had that selloff in stocks, and then they recovered. And there’s a lot of areas where VantagePoint says, here’s the places to buy. You see you’ve got about a 20% rally over about 10 trading days.
Electronic Arts
Now let’s go over to shares of Electronic Arts, and the exact same approach, but you see here that here, we get this crossover to the upside. The overall trend is up, but there’s longer periods here where you see the neural index goes bearish. And how I like to think about this is, if we have a accurate predicted moving average and neural index or 48 hours of strength or weakness is showing us weakness, we should expect that the market can spend some time below that average or below that blue line. In addition to that though, we understand that we have the intra-day predicted low levels, so we understand that, hey yeah, if there’s weakness in the market here, we know we want to be long because the blue line is above the black line. But expect that weakness, and intra-day, this is about where we should be headed towards, so that’s where you want to put on those positions if you’re trying to take on that long position.
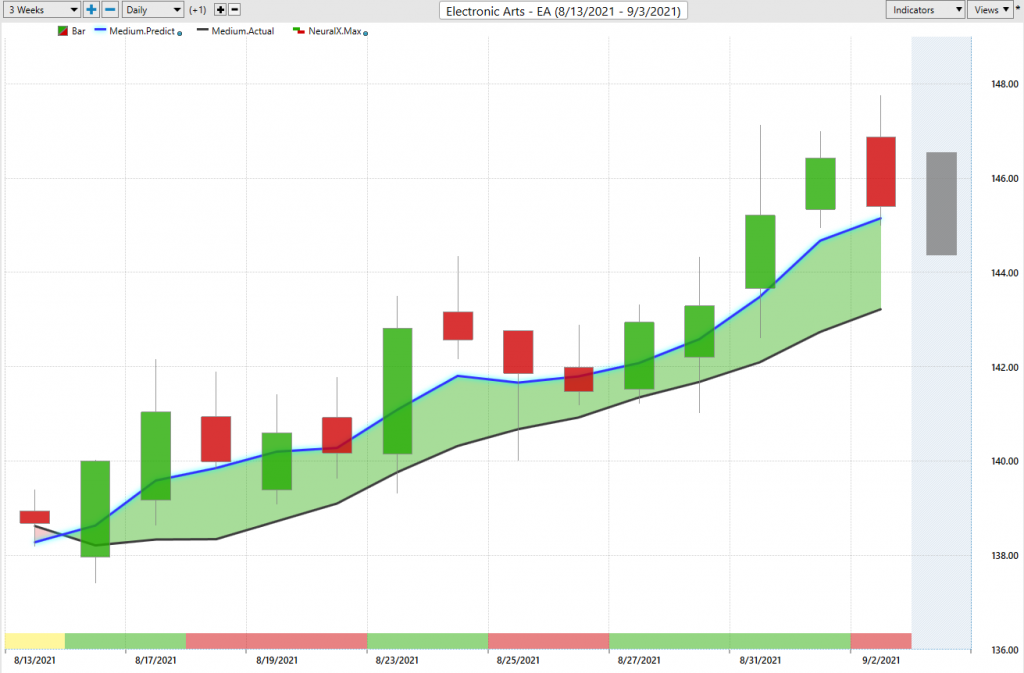
And we see that, okay, well the market finds some footing, starts to move higher. You get another blip here where the neural index goes bearish and you run sideways, but overall the trend is up. You only want to take long positions, but understand that look, there may be some weakness coming in over the next couple of days here, next couple days here. And you’ve got to remember, this is end of day data. This is 72 hours of trading. This is another 72 hours, but you’ve got that information again even intra-day that says, what should I be doing, where can I add onto the position to even improve the position, right? If you add some back here, maybe you can take some profit, add some more as the trend progresses.
But here we have EA continuing to trend higher, looks pretty good, but it’s really about the trade management. The market’s only moved up about 5%, but you’ve gotten a great entry, potentially multiple entries as the trend really starts to accelerate.
Dollar General
Now here’s Dollar General. And so I wanted to bring this through to highlight this point of, even when unexpected things happen and a lot of volatility comes in, the software is adaptive. So it’s able to understand that, hey, something happened in this target market, and look at the landscape of what happened in those other markets. And how are things going to likely be affected by that moving forward? And so here’s shares of Dollar General, and you can see pretty clearly here, and you get this crossover to the upside, you can actually see, look, neural index bearish, you’re getting some lower lows over the next trading day. But even after that trading day, you get more separation from that predicted moving average, saying look, the trend is up. You’d only want to go long, take profits on longs.
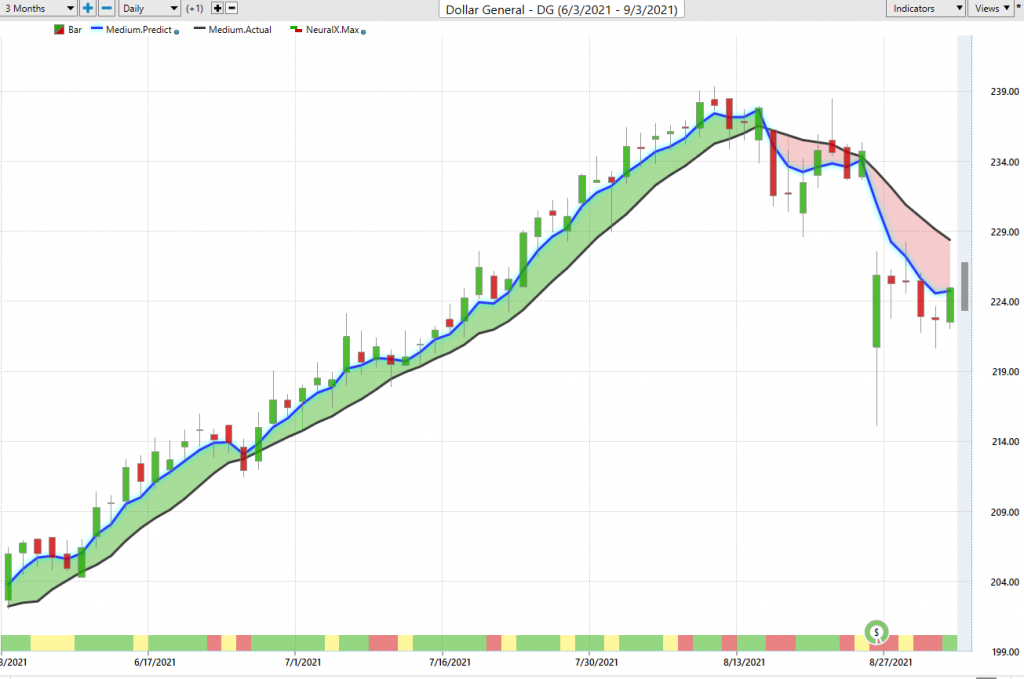
Again, these little blips where the neural index goes bearish, you see you’ve got a gap down here, a little bit of pullback here, pullback here. Maybe these are off days here, but overall it’s telling you look, you want to be long in the market. Take profit on long positions. Be able to anticipate the short-term weakness in the market, but then you see this big drop-off in the market, right? So you get about a 16, 17% move, you get I don’t know how many entries over the course of this move potentially. Entries in here, over here, over here, over all through here, so a long period where a short-term trader can be trading, taking profits here.
But then we get that day right there, and it’s like I don’t know what happened there. I wasn’t specifically trading this market. But look at that day where it’s like, okay, something happened. Ideally you would’ve started the position all the way back here, right? But something’s happened there. And look at these predicted lows the next trading day. So all that volatility comes in, the market closes. You say, “Okay, what happened here?” Well it’s telling you, look, Dollar General’s now in a downtrend. And so if you’re long here, maybe you have long position trades, well it’s telling you look, try to get out of this market.
And next day’s predicted high, you see we nailed that perfectly. We rattled around three of these predicted highs. You can get out of your position more gracefully if you need to, but additionally maybe even just go ahead and reverse the position, because now it’s telling you short from these levels, and then that there I believe is earnings. And then you see again, volatility, a lot going on. The software can’t account for earnings because it doesn’t look at that data and no one knows what the earnings numbers will be. But you see all that volatility come in, and then reset. These predicted highs and lows getting back on track even in an extremely volatile environment where the ranges are expanding, where the bid/ask spread is spreading out. You’ve got a very good tool to assess this, and 17% up, well you’ve already, probably call it 7-8% already to the downside there if you’re reversing that position, shorting, buying put options.
Callon Petroleum
Now I talked a lot about crude oil and all these things going on, and I just want to highlight that if you’re a futures or commodities trader, the software works in those markets as well. So what I was just trying to highlight was, yeah, we knew that energies were weak over the past couple of months here. We saw that happen with Callon Petroleum and many of these things. But we had the shift in dollar, and that really put a kink in… you saw a big… crude oil had sold off going into the Friday, and then Monday immediately was like, boom. And that was the clue that said, look, things are reversing here.
And so you see we get this crossover to the downside in the US dollar index, and we get a little bit of volatility around Fed announcements and information coming into the markets. But you see here what occurs. The next trading day you move right up to the predicted high. It’s telling you expect the range to go up a little bit, get a little bit of volatility, but the move is down. And you only want to be shorting the market, taking profits on shorts, and even as I make this video we’ve moved down to the predicted low. And so for again this last week for the short-term traders, that’s where the forecasts have been directing things.
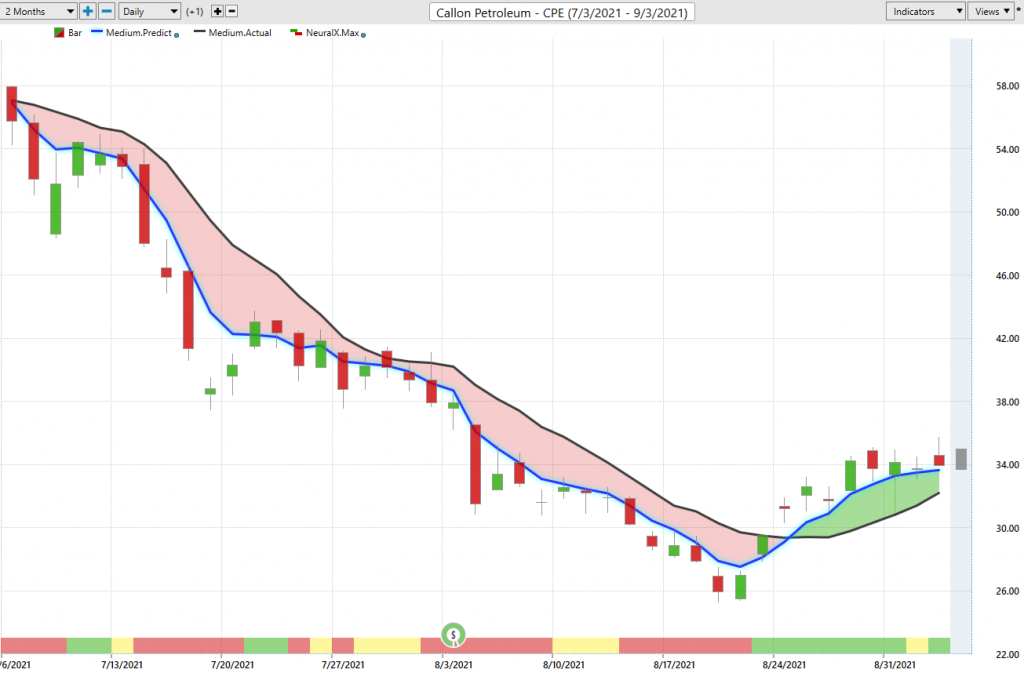
If you’re on the futures side, maybe you’re trading currencies and things like that, but this ties into this chart for Callon Petroleum. And I just keep bringing this through, because it was a great proxy when we noticed that there’s some weakness in energies. We saw all that volatility come in, stock selloff, energy selloff. And then when we got that selloff recently, we talked about there’s strength here, right? That’s what we’re talking about with Acorda Therapeutics and the stocks like Insight and AIC from last week. Well there real strength here and dollar weakness. Generally not a real bearish case for things like crude oil.
And so not only do we not really need to know all of that, it’s helpful, but we can just understand the forecast here. We’ve seen that, well what’s happened? Well we’ve seen a lot of these energy stocks move to the upside. And this doesn’t say where the bigger move in crude oil and things are necessarily going to go, but certainly from a trading perspective, look at these short-term forecasts from VantagePoint on Callon, where you’re buying at this predicted low, here’s the predicted high you would’ve targeted, and you see what happens there. The market trades up, hits that level. And then again, moving lower to these, hits this predicted high, maybe take some profit there. We gapped up today, because energy has popped again today.
So again, if you’re a short-term trader or even if you’re a trend trader, it’s become very difficult to really even trade that energy scenario. But there’s all these stocks where there’s opportunities opening up. There’s opportunities in currencies opening up. And this is where this intermarket approach and looking at the markets with this global perspective is really going to help traders navigate this, and understand that maybe at one point you want to be shorting crude oil or energy stocks, but things shift. And when currency shifts, it can have an effect on maybe those trades that you’re taking in currencies, commodities, or even individual stocks as we’ve seen. It’s very, very important. That dollar gets weak, and it actually has a very bullish effect on equities.
And so we’ll leave it there for today. Just some really interesting periods in the markets, and big in the macro side of the market. And we brought this Callon Petroleum last week, and if you’re trading this on the long side, you see how accurate those short-term forecasts are at really having to do a great job as far as taking those positions and entries and navigating it day-to-day with the help of these tools.
So once again, this has been the Hot Stocks Outlook for September 3rd, 2021. Thank you all for watching. Best of luck out there, thanks again, and bye for now.


