


Welcome to the Artificial Intelligence Outlook for Forex trading.
VIDEO TRANSCRIPT
Hello, everyone, and welcome back. My name is Greg Furman, and this is the VantagePoint AI Market Outlook for the week of March the 28th, 2022. Now to get started this week, we’re going to begin where we always do with that very important US dollar index. But first let’s have a look at the custom indicators we’re going to be using in forecasting next week’s markets moves.
Now we’ll using bars, not candles. We’ve got our long term crossover, which has been modified to remove the black line. And we’re just going to use the long predicted, the predicted moving average by itself. We’ve got our short, medium, and long term predicted differences. We’ve got our neural index, but we’re also monitoring the neural index strength. That allows us a window inside the neural index to see the slope and the angle of the neural index and whether it has momentum or not. We’re also using the point in time. Very important to use this particular indicator to identify where we are in the calendar year in each particular market, meaning whether we’re above or below the yearly opening price to clearly determine what the trend is.
We’re using the triple EMA cross, which also has been modified to remove the short term predicted difference in the long term predicted, or excuse me, the long term crossover in the medium term crossover. What we’re doing is we’re using the predicted differences to measure those crossover points. And of course, the very popular and useful verified support and resistance zones.
U.S. Dollar Index
So when we look at the dollar, the dollar has had a decent week against certain pairs like the Japanese yen. And the Euro, it didn’t do too bad, but it didn’t really hold its ground against the Aussie, the New Zealand. The CAD as projected in last week’s four X weekly outlook that the Aussie US, the New Zealand US were gaining strength. The US Canada was preparing to move lower. That’s come to fruition. So now we have to review this going into the week of the non-farm payroll number.
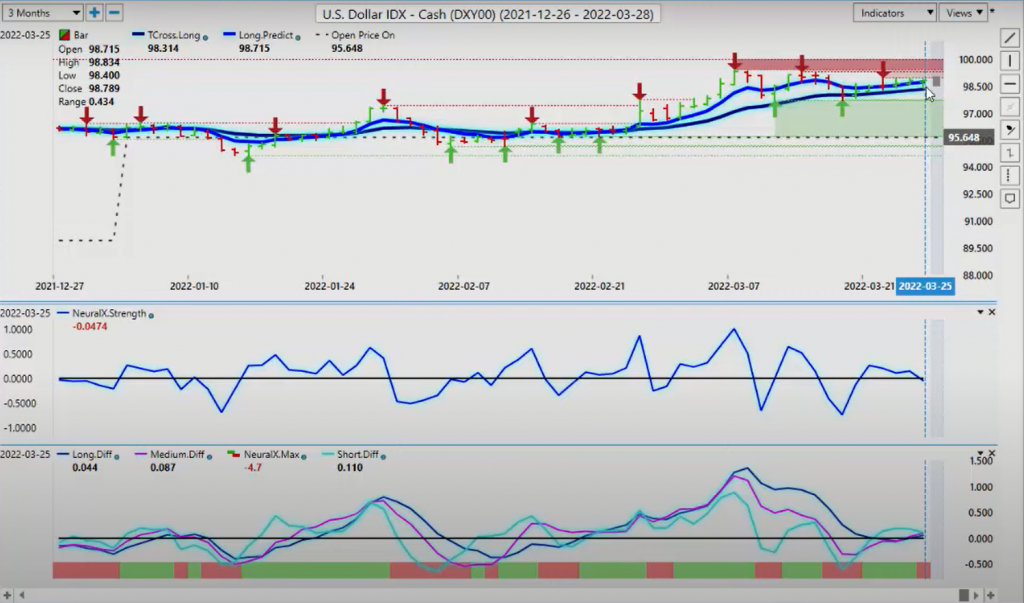
So our key support level using these VantagePoint predicted moving average is very similar to what you will see people on Bloomberg or maybe CNBC, where they talk about the 50-day and the 200-day moving average. Or it’s just conceptually, guys, it’s the same, except we’re getting closer to price action. Meaning there’s a tremendous amount of lag in a 200-day moving average, a 50-day moving average. But they’re very useful when price gets close to it. With VantagePoint, these predicted moving averages we use, we can use them as daily and weekly and monthly pivot levels. So our long predicted is 9871, and our T cross long is 9831. So the theory here is we would be long while above those particular levels. But we can see that while our neural index is switched to down, our neural index strength also has been moving lower for several days, showing us that dollar weakness, particularly on March the 22nd.
I saw something very similar in last week’s weekly outlook where the neural index strength internally, it can still show a green, but internally it’s a lot weaker than what it appears to be and it’s starting to shift. Now, this doesn’t surprise me one bit. We have a dollar cycle, which I’ve talked about, where the dollar is usually strong up until the first week of the new month. The seasonal pattern that I would be looking at for the dollar is that it usually sells off either way by about April the 6th. April the 10th, the dollar has made most of its gains for the year. We can see that we’ve been firmly above the yearly opening price of 9564. I would respectfully submit that if these verified resistance high continue to hold at 9941, then the dollar gains are likely going to be limited here going into the month of April.
So again, our neural index strength pointing down, but our MA Diff cross, now when we look at the predicted differences down here, these predicted differences when the market crosses above the zero line, that means a crossover took place on the short term crossover, the medium term crossover, and the long term crossover. They are all above the zero line and they’ve recently crossed. So when I look at this, it’s telling me, okay, I’ve still got a little bit more dollar strength here, but I’m mindful of that seasonality going into the end of the first week of April that the dollar is likely on borrowed time here. Now we’ve got the Russia-Ukraine thing. That’s keeping the dollar up, but if that starts to settle, then the dollar strength will come out of the market likely rather quickly, in my respectful opinion. But the key thing is to identify these critical support and resistance zones, and whether you’re above or below the yearly opening price.
So with the week of the non-farm payroll, it’s very likely we will see dollar strength into the end of the week. And this could be the final move potentially for the next few months of dollar strength, but we will monitor this on a weekly basis to see where we’re at.
Gold
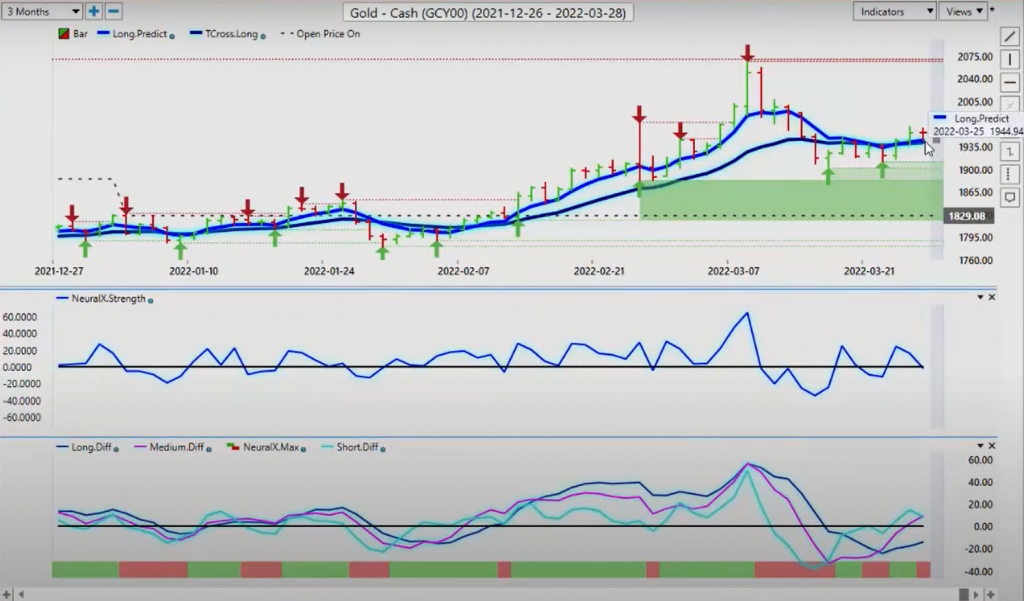
Now with gold, gold has been moving up and down with the US dollar, but this is yet another warning sign here that potentially the dollar rally is coming to a short to medium term end soon. Gold is recovering. It’s moving back up. We’re holding above the T cross long at 1941. Gold firmly bullish on the year, it’s yearly opening price is 1829. We have a lot of different market opinions, market gurus talking about overbought, oversold. I don’t support that methodology of trading.
In the current market, we have momentum. When we have momentum-based trading based around algorithmic programs, they don’t care if something is overbought or oversold. If they’re either going to buy at a certain level or they’re going to sell at a certain level, and they can be very aggressive when doing it. So right now we have our T-cross long, like I said, 1941, long predicted 1944.
We’ve got an MA Diff cross that took place several days ago. And you can see when this pink line crossed this blue line that tells us two things. That the medium term trend is weakening against the longer term trend. And when that pink line crosses over the zero line, a medium term crossover took place. In this particular case, the short term crossover took place first, and then it’s followed. Now you’ll notice the darker colored blue line, it is still holding. That’s the long term crossover or the F-8 in your VantagePoint software is still below the zero line. A crossover has not taken place, but again, using that as a pivot level, the long predicted 1944, we’re still holding in there. We’ve closed at 1957, so we’ll continue to monitor this. But again, there is still some life in the gold contracts.
S&P 500 Index
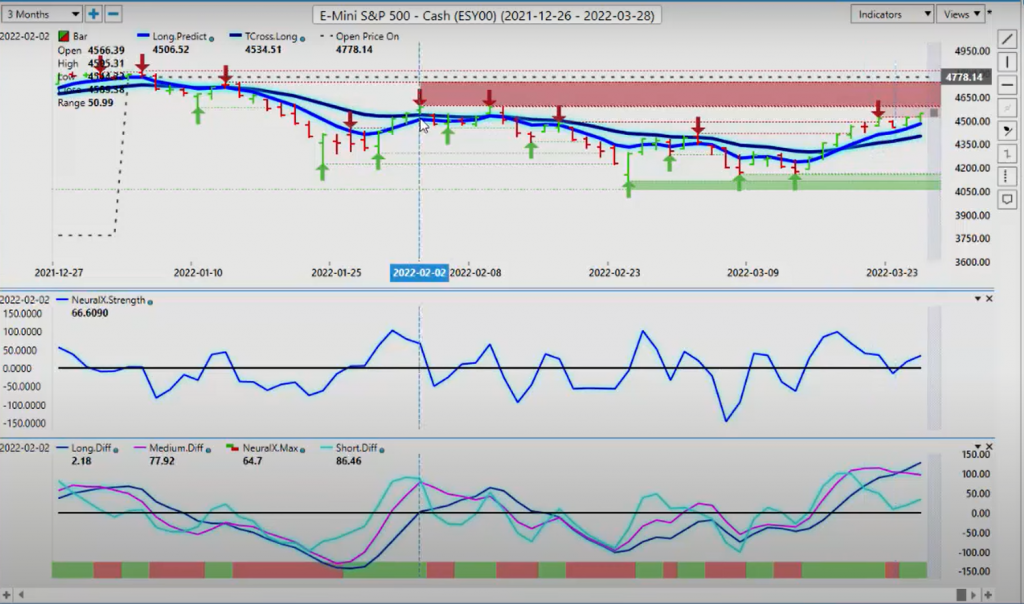
Now when we look at the global equity markets, and what I’ll usually do is gauge the global equity markets more or less off of the S & P 500. I don’t want the volatility of the Dow. I just want to see what the top 500 companies are doing, see where we’re going there. So using that again, that long predicted as a daily pivot area, you can see that the market is in constant contact with this and as the market moves higher. Now what I’ve discussed with this in the VantagePoint Live training room and on here is that this is very, very significant resistance up here. Now if we can’t get through this, then my view is then the equity markets are simply correcting higher. So I’ll just pull this out visually so you can see it better.
That high is, we’re just going to round it out and say 4600. So the S & P 500 needs to clear 4600. But to be clear, we are still bearish on the year. The yearly opening price is 4778. So if we have any chance of retracing, and that’s what we’re doing, we’re tracing back to it, we haven’t confirmed a new trend to the upside yet and I think the market is getting ahead of themselves, we must just clear this very powerful, verified resistance high that’s been identified using the VantagePoint verified support and resistance zone. So again, if we can clear that level, then and only then do we have at least a shot at getting back up to the 4778 mark. Our indicators are warning that that is unlikely. At the current time, we’re losing that momentum, the medium term crossing over the long term predicted difference. On a positive note, the neural index strength has got a reverse check mark and it’s pointing back up.
So I anticipate a decent open providing nothing else happens with Russia and the Ukraine. And I did get a few comments about how come I’m waiting till midday Sunday to do the weekly outlook. And the answer for that is because I’m waiting as long as I possibly can to make sure that nothing crazy happens with Ukraine and Russia over the weekend that could completely undo the forecast, right? So be mindful, keep an eye of that, what’s going on. But again, we must clear 4600. Now when we look at one of my absolute favorites again, we’ve had a very, very good buying opportunity that I’ve talked about for several months now is this heavy support zone down at 3700. This continues to hold. We’re advancing.
Bitcoin
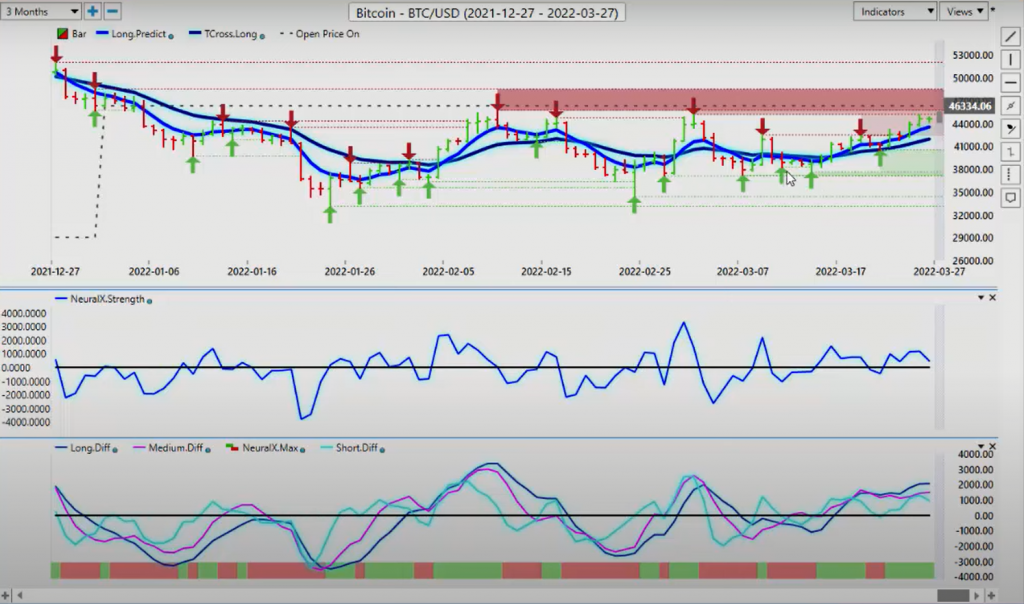
Now Bitcoin again is below its yearly opening price at 46,334. We need to get over this. Now in my view, if Bitcoin can clear its yearly opening price, which I believe it can, because the seasonal pattern here is that Bitcoin would be strong starting in the mid-part of April or even sooner and we can already see that happening over here. So if we combine our seasonal tools, whatever that may be that you’re using, and we combine it with the VP software, we can clearly see that this is a leading indicator. So again, my concern, however, again, is we are still trading in a blocked out range, so I can identify that for everybody so you can see it, and I’ll just draw a line like this so everybody can see it. This is what you’re trading with, guys. Okay? There’s your top. There’s your bottom. Easy peasy, right? So if we can clear this and get above this verified zone, then we would start moving our way back towards that 55-60,000 mark. That’s what I would like to see.
But either way, I’ve been a strong buyer on Bitcoin down here. And if the stock market, more specifically the S & P and the NASDAQ, can start turning higher than that would further push Bitcoin up. So our key support levels are long predicted 43,500. Our T cross long is at about 42,000. We stay long while above that particular area. And as long as we’re supported by the key VantagePoint indicators, the predicted differences, the neural index, and the neural index strength. Now it’s sloping down, but it’s still holding above the zero line, which does look promising.
Crude Oil
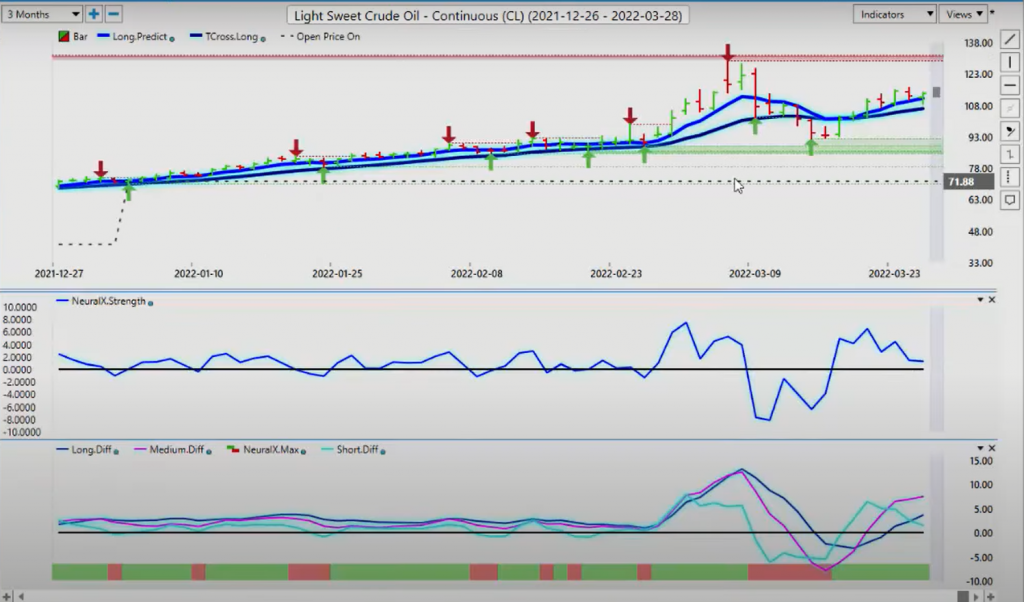
Now looking at oil contracts here, to be perfectly blunt I would almost be inclined to not even bother trying to forecast light sweet crude oil or WTI right now. It’s so heavily manipulated in there, guys, with this Russian-Ukraine thing, but let’s have a look at it, right, because there are opportunities using the VantagePoint software. Once again, when we look at this neural index strength, and this is an important thing that I want to point out, is that the neural index strength was sloping right here and pointing higher. So this gives us a bit of an edge. I would argue a couple of days edge to see that the neural index strength is a completely different indicator where it measures the internals of that neural index. We see a green and red down out here, but we can go one step further with this and say, okay, this thing is starting to turn. Then we combine that with our predicted moving averages only, the two blue lines, right?
So as soon as we cross over that and close it two days in a row, that is a trigger, but I will strongly argue that the neural index strength then looking at the MA Diff cross, now we don’t have a medium term crossover, but we’ve effectively removed all lag from the crossovers because we’re using the predicted differences. So when the medium term crosses the long term predicted difference, that is usually an indicator to me that if nothing else, I do not want to sell down here, that is going to be a problem. I’ve also got these heavy verified support zones down around $89 a barrel. We’ve got a newly-formed support, low verified zone at 9208. That’s your main support. The additional support, of course, is the T cross long at 10649. So at the current time, obviously it’s very difficult to recommend any kind of shorts. These wild spikes that we’re seeing are likely to continue. But if we look at these VP indicators, we can assess here that we have very, very strong buying at $100 a barrel, and that is likely to continue potentially into next week.
Euro versus U.S. Dollar
Now as we move into some of our 4X pairs for next week, again, I think the dollar will still, for the most part, have a decent week. I expect that the non-farm payroll number on Friday will be decent. We’ll get a first view on Wednesday at 8:15 AM Eastern. You can tune in to CNBC to get that number live. But the ADP report has not been overly good, to be perfectly honest. It’s been off quite a bit. So I don’t go by that. But once again, when we look at this setup and we connect the dots in our VP software, we can see that we have daily selling points along the T cross long, which is 11043. So if we connect the dots between the predicted moving average using it as a pivot level and identifying that, then we can say, okay, our line in the sand is currently, I will argue, is 11043. As long as we’re closing below 11043 consistently, then shorts are still viable.
We then look at our neural index strength. It failed right on the zero line and it’s pointing down, right? Then we further combine that with the MA Diff cross. This equals sell, sell, sell every single day, a short in here. And this is where the dollar actually did do quite well last week for the most part. But the dollar did not do well against some of the other pairs. So it’s all about picking your poison here, guys, which ones are good. So when we know this level at 11043, we can easily trade off that on a daily basis and we can straddle that with the 11043 area and say, okay, well, I’ve got an additional verified high here at 11121. So if I can short into here up until 11121 and then have long pending, or you can have pending long orders sitting right above 11050 if you want, that’s totally up to you, but the key thing is to identify those levels. So still a bias to the downside for next week.
U.S. Dollar versus Swiss Franc
Now if that’s true, then US Swiss franc will start to slowly turn around. If we’re in a week of known dollar strength, then we look for places of value potentially to buy dollars. Now it’s been a mixed bag with the Russia-Ukraine war on the monthly cycle, but usually there is something there. So we’re stalling right out here. You can see, we penetrated the VantagePoint T cross long in the long predicted, but we couldn’t close below that T cross long. It’s very, very close, but you can see that our strength here is just hovering below the zero line. Our predicted differences are still pointing lower. But to be clear, the trend is up on this particular pair. It’s correcting lower, but our price on open is 9109.
Now we could head towards that in mid to latter part of April. That’s difficult to say, but for now, there’s a slight upward buyers tier, even though everything is negative here because of the week we’re going into. Again, if that’s a strong payroll number out of the US, then you’re going to have a lot of dollar buying. That’s going to trigger more fed rate hikes. You’re going to start hearing the rumors of 50 basis points again versus 25 basis points. So again, this is a place of value potentially to buy dollars.
British Pound versus U.S. Dollar
Now when we look at pound dollars, or excuse me, the pound dollar, we can see that the pound actually had a pretty decent week last week. We were playing with this, buying this in the VantagePoint Live training room, had some pretty decent moves, but the problem here is once again we are not getting above that T cross long on a consistent basis. We only manage to close above it one day. The very next day it slips below it. And then Thursday and Friday, once again, we’re below it. Now the concern here again is simply right or wrong, good, bad or indifferent, we connect the dots here. We’ve got our T cross long right here. We’ve got our neural index strength that has told us we’re losing momentum, right? Then we now combine that with our MA Diff cross and our main neural index. So for now, that’s strike one, strike two, strike three. You’re out. Okay?
So that doesn’t mean the pound dollar… I believe the pound dollar will go higher, but not until likely after April the 6th. That’s when the seasonality will start to kick in. But again, it’s not a great month for the pound dollar. So slight bias tier to the downside. The key resistance level you want to watch for next week, 13210. So even if we look at the VP predicted high and predicted low, it’s predicting 13239, for example, on Monday, but it may not be able to get to 13239. It may stall at, again, that T cross long, that’s what’s blocking it, guys, 13210. So watch those two levels very closely in Monday’s trading.
U.S. Dollar versus Japanese Yen
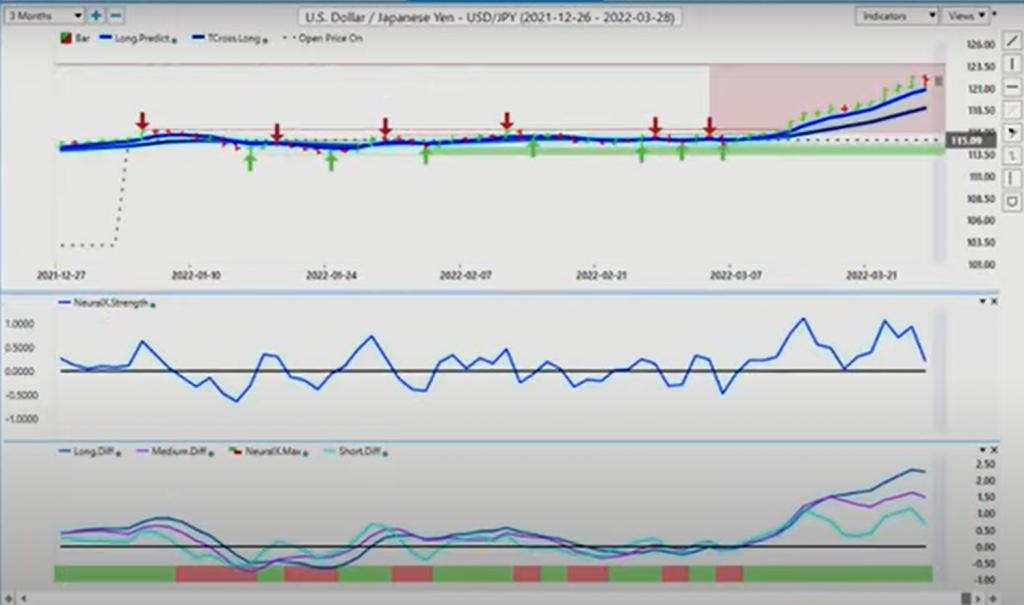
Now with the dollar yen for next week, I’ve largely avoided this pair after the break of that break of that channel rate here, that coming in at about the 11634 area. Again, this one defies logic here. It’s something new even for me, because when gold prices are anywhere near 1900, then the inner market correlation would put the dollar yen around the 108 mark, 109. It certainly would not be at 122. So there’s a bit of a overshoot here, in my opinion. You can see we’re coming up. There’s a verified resistance high around 123. We appear to be heading towards that.
But this is what I find interesting right there. Our neural index strength is pointing straight down. So we’re losing this upward momentum here. Our predicted differences here, they are already warning us at the high, 11912, that, look, we’re losing momentum, but then it kicked in again. So with this one, whenever I see the neural index bar green for this amount of time, usually the move down is just as big as the move up. So I would be watching this one for a short, but for now I would be very cautious.
U.S. Dollar versus Canadian Dollar
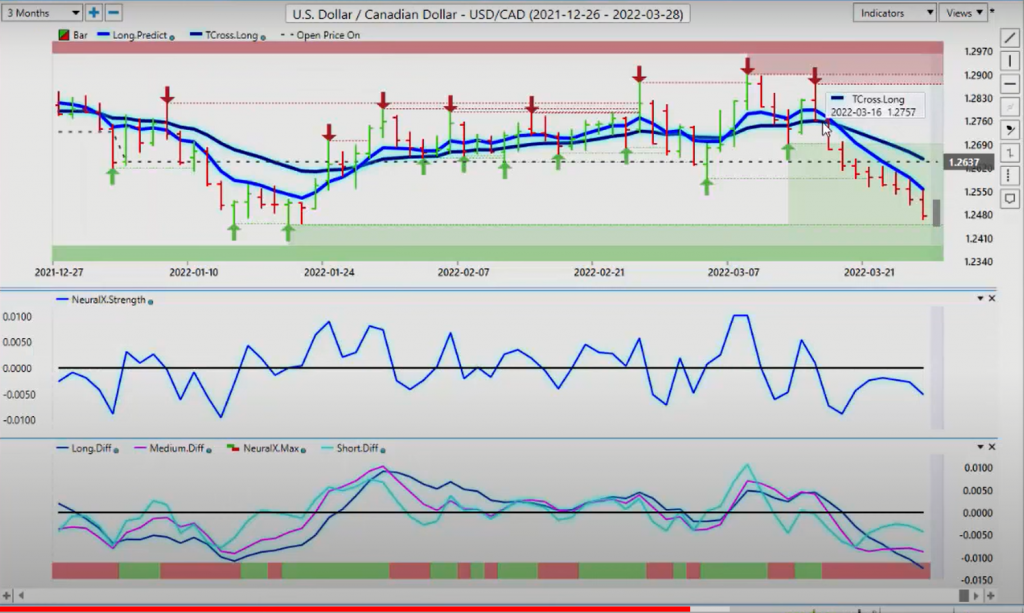
With the US Canadian pair, once again, we do this every week in the VantagePoint Live training room, I certainly suggest everybody come in and visit us in there, because this one has been a relatively easy trade on the downside. Now we started, we broke it down up here. First of all, we were shorting up around this 128, 129 level. And then we really started losing momentum. But the key move here is when this pair broke down finally below the yearly opening price, the price on open right here. And when you connect the dots and you look at this, even though we’re in a period of a strong dollar, it was too much for it right here. It closed below the yearly opening price. It closed below the key VantagePoint levels up here.
Then we had multiple retracements again to the long predicted. So if you connect the dot to that blue line, this gives you an actual pivot level to short from. So each day you go back in and just keep hitting that blue line, and then you keep your stop above the VantagePoint T cross long provided you apply proper leverage to your account. Never apply excessive leverage in any market, particularly in options and in 4X. Limit your liability here, guys.
So when we look at this right now, once again, fascinating to me, getting an internal view of the neural index right here where we can see the slope breaking down, staying down below the zero line this whole time. So once again, when we look at this and we clear all this out, we say, okay, we close below here, strike one. We look at this, strike two. Right there, strike three. And then, boom, you’ve got a big move down. Now in my view, I think we need to be a little bit cautious. And this is where the verified zones come in.
We’ve got this verified low, and that’s coming in about 12451 and that is the broader channel. So if we’re going to see some buyers here, then that would likely be around midweek. Okay? So just keep an eye on 12451, because again, price action still rules supreme. We just apply it to the intermarket correlations and the predictions. So if we can breakdown and stay below that, well, then that would tell me we should be pulling out a little bit further to see if we’ve been down here before. So you can see, we actually have. That would open up another verified support low at 123. So that is entirely possible to get down there here, guys, if commodities continue to advance.
But to start the week again, you look at those key pivot levels using the long predicted 12556. We’ve got our VantagePoint predicted high. That’s coming in at 12522. So when we combine the predicted high with the VantagePoint T cross long, that gives us an entry point, guys, right? That homes in a very specific entry point from a predictive standpoint, because again, this is an outlook, not a recap of something that already happened. Now when we look at the Aussie US and the New Zealand US, we were strong buyers of this one in the VantagePoint Live training room. And as I had discussed in last week’s weekly outlook, that look, we’ve got a move going on here. We’re sitting right on that yearly opening price. And in the first quarter of the year, the yearly opening price is the best non-indicator, in my opinion, you can get along with the weekly opening price combining the both.
So when both the weekly opening price and the yearly opening price are in agreement, then we fire at will. So if I bring this up and I look at my point in time, I can very easily switch that over to the weekly open and I can hit apply. So when we look at what’s happened this week, you can see it. On Monday we closed, which Monday under my five-point plan is always a fake price. Then on Tuesday, we start breaking above the weekly opening price where I will straddle it. And you can see it makes contact with the VantagePoint long predicted at 7380. Well, this pair didn’t look back, guys, and we finish the week out here hitting a high of 7512. That’s a fantastic trade and it was fully supported in the VP software by looking at the neural index, the neural index strength, the MA Diff cross, all of these connected. So what you always want to make sure you’re doing is connecting the dots.
So my yearly opening price is good. I’m above that. I extend past the weekly opening price. My neural index strength is good. Then on top of everything else, I’m lucky enough to get an MA Diff cross from VP. And again, when we cross over this zero line, I don’t necessarily have to look at the crossovers because I can see them in the predictive difference. The blue line, the pink line, and the darker colored blue line, they all crossed above the zero line, which means a crossover took place in the short, the medium, and the long term in all of the VP indicators, and then identifying these pivot areas. So by visually showing everybody using the epic pen tool here, you can really see what’s been happening. And again, it’s predicting.
Now a bit of a concern I have going into next week is the same thing that gave me such a great long trade, potentially could give me a pretty decent short trade.
Australian Dollar versus U.S. Dollar
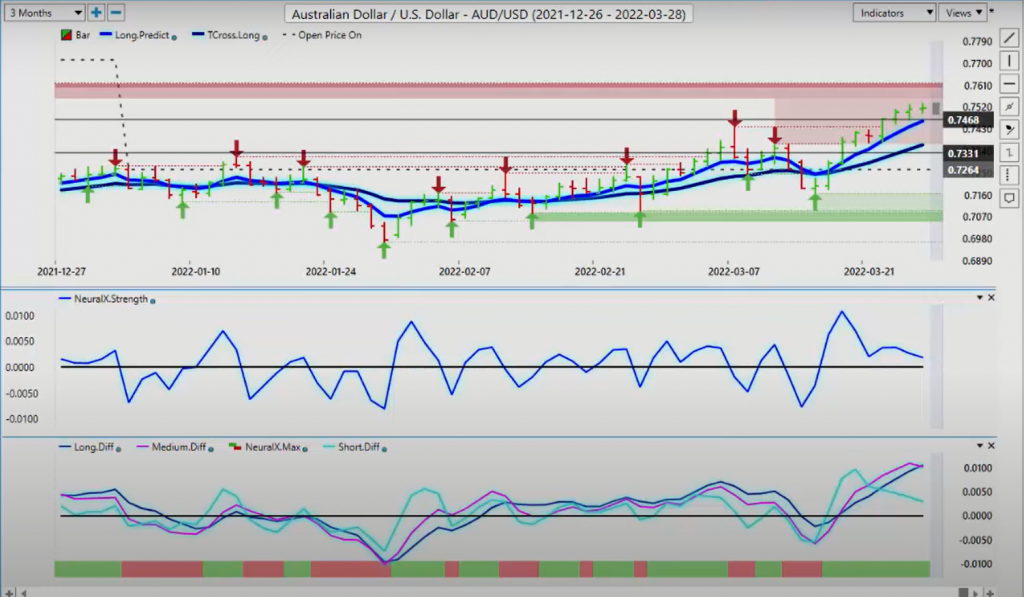
Now the Aussie and the New Zealand and the CAD have completely ignored the volatility in the stock markets. They’ve ignored just about everything. And those three currencies have been very strong, meaning the CAD, the Kiwi, and the Aussie. So right now there is a warning sign that potentially we’ve got a problem. So keep an eye on the neural index strength and the neural index itself to see if we’re about to fail up here or just simply correct lower. But always remember here, guys, that if you know where your yearly opening price is, then you can say, okay, well, I’m not going to panic here because it’s moving lower for a few days or maybe even a week, right? So we go back to that yearly opening price and say, okay, the price on open is 7264 and then I have my VP pivot levels down here at 7462 and 7365.
So we can easily identify potential buying opportunities, knowing that there’s the potential that this is going to move lower first.
New Zealand Dollar versus Canadian Dollar
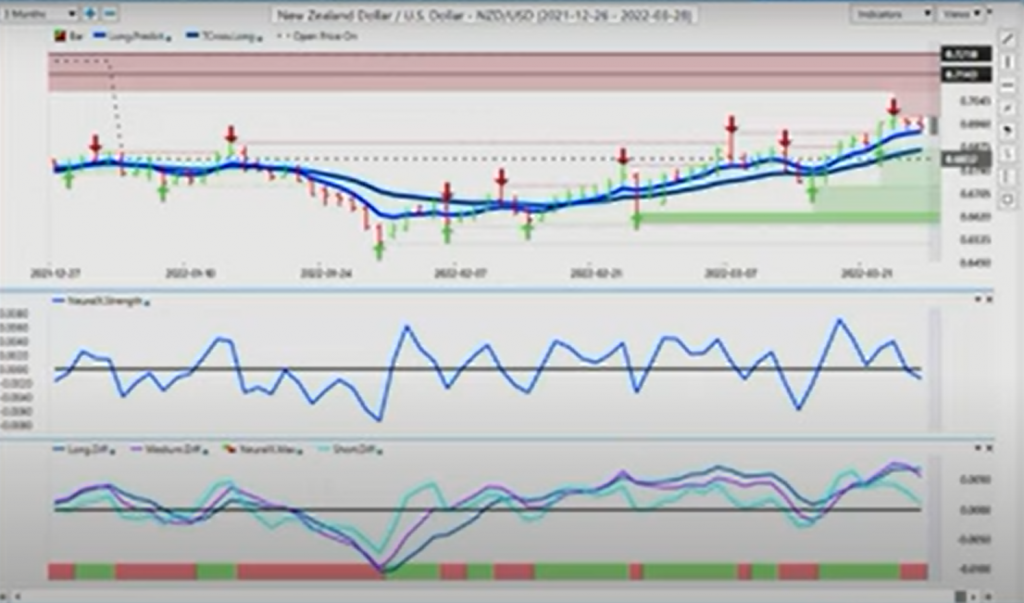
We then would apply the exact same methodology to the New Zealand US dollar. You can see we have a more pronounced MA Diff cross right here. We have a clear MA Diff cross. We have a neural index that’s down, right? We have a newly-formed verified resistance high. So again, when we connect the dots in a 1, 2, 3, 4 step pattern, then we can very quickly analyze the markets using these extremely powerful VP tools.
So with that said, this is the VantagePoint AI Market Outlook for the week of March the 28th, 2022.


