


Register for a Free Live Training
The Hot Stocks Outlook uses VantagePoint’s market forecasts that are up to 87.4% accurate, demonstrating how traders can improve their timing and direction. In this week’s video, VantagePoint Software reviews forecasts for Activision ($ATV), Carnival Cruise ($CCL), Nike ($NKE), Hanesbrands ($HBI), Valero Energy ($VLO) and Freeport McMoran Copper and Gold ($FCX)
Hello again, traders, and welcome back to the Hot Stocks Outlook for October 7th, 2022. Hope you all are having a great week out there in the financial markets. As always, plenty to cover here in the Outlook. We’re going to take a look at Activision, which we’ve actually looked at over the past few weeks, as well as some of the cruise lines. So we’ll go ahead and refresh things there. We’ve got Nike, Hanes brand, and lastly, taking a look in the energy, metal, and mining space. Some really important things going on there. So make sure, if you haven’t already, that you go ahead and click on the link below and get that live demonstration, and you can learn more specifics about how this technology is going to help you make better trading decisions for the style of trading, whether you’re a day, swing, or position trader or whichever markets that you are trading.
We forecast for stocks as well as futures, commodities, and even the four x market. So let’s go ahead and start out here though.
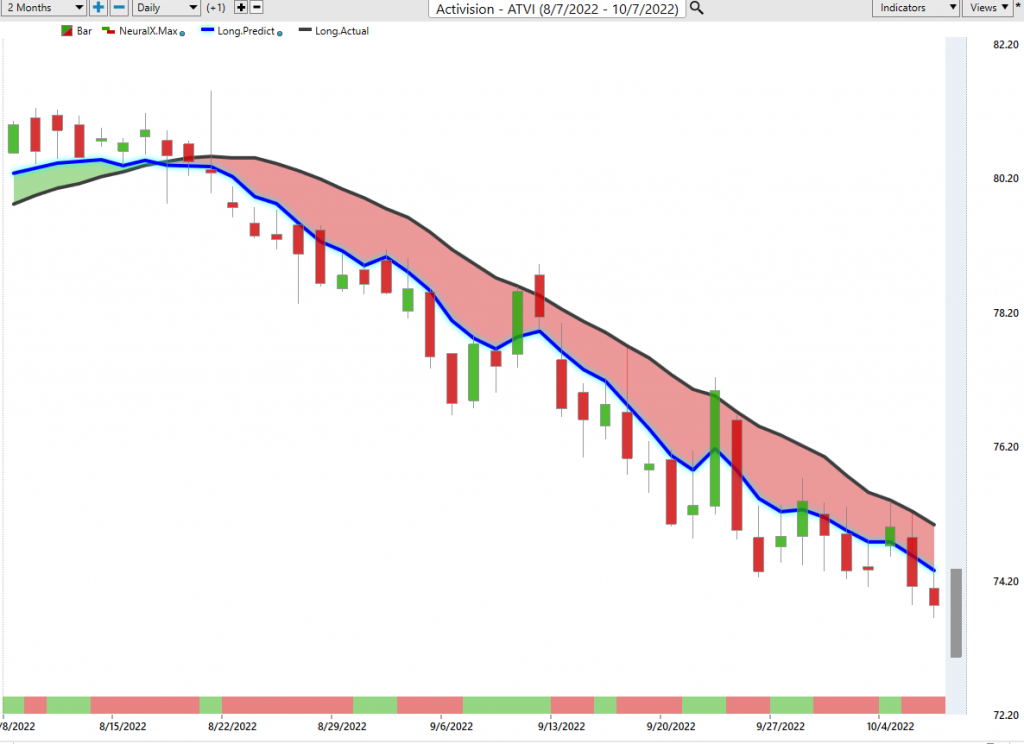
We got shares of Activision. And all of these forecasts work exactly the same way. So what we can see here is that we’re looking at daily price action where each one of these candles is representing a full and complete trading day. And so right up against all that price data, you’ll see that there is a black line and also a blue line there. Now the black line that you’re seeing there, that is actually a simple moving average or what we refer to as the actual simple moving average. And so in this case, this is a 10 day simple moving average, so it’ll look back at the previous 10 close prices, add them all together and divide by 10. So what this does for us is really smooth out the existing price action and really let us know where the market has been over a given period of time.
But traders need to be ahead of that next move in the market. And so what we’re able to do is compare that black lagging moving average to this blue value. And for that number to get plotted and calculated on the chart every evening for the trade, this is where the technology of artificial neural networks come in. So what is this technology doing? Well, specifically for shares of Activision, what this technology understands is there are markets that drive and influence the future price of shares of Activision. Now that’s going to be things like ETF groups, that’ll be things like other individual stocks within the tech space and maybe outside of the tech space. But it’s also going to be things like the value of the dollar index, crude oil prices, the broader indices like the NASDAQ and the S&P 500. And so what it’s able to do is take all of this into account, summarize that information into a true predictive forecast.
And that’s really what artificial neural networks are good at doing, taking in huge amounts of data and making highly accurate predictive forecast. And so what we do is we take that data, that true price prediction and use that data to construct these moving average, turning what we’re lagging tools that really just reconstruct past prices and plot them along into a forward looking predictive tool that’s going to let traders know in this case of where are average prices likely to go next. And so whenever that blue line is below the black line, it’s suggesting average prices are below the actual simple moving average prices and you therefore would want to look to, in this case, short the market.
So I keep bringing in Activision the highlight that, okay, well that blue line you see is still below the black line. And there’s been some volatility here. We’ll go ahead and get to some of these areas where things are shaken around. But if you’re trading Activision, you’re in that market deciding, okay, well this is where I’m deciding to be, this is where I want to trade, you can use these tools to help you manage this opportunity. So what I’m doing here is what we’ve done each and every week and highlighting that in addition to that predicted moving average that had across all the way back here, you’re provided with other predictive indicators, one of the most notable ones being this predictive neural index at the bottom of the chart. And this goes from green to red, back to green.
And this indicator is forecasting very short term. It’s doing a 48 hour forecast and forecasting short term strength or weakness in the market. So traders can use that in combination with the predicted moving average to understand, okay, well what is the overall trend, but also when is short term momentum picking up so I can exploit those opportunities? And on top of all that, we get a predicted high and low, which we look at each week. So before the next trading day, you’re provided some intra day levels that are going to act as a great guide to let you knowing where you can set limit orders and potential profit targets. So we’ll go through all of these charts in the exact same way. And so once you understand the overall trend direction, you see how many day opportunities show up here, specifically at some of these predicted high levels.
But even if you’re just using it as a predicted range to let you know, okay, well try to short as this market moves higher and look to target some of those predicted low levels. And you see you get plenty of entries here to keep exploiting that opportunity. But what you need to pay attention to are these very important shifts in the market. And so what we understand is Activision shifted all the way back here. It hasn’t shifted up, and therefore if you want bearish exposure in the portfolio, well, you see this is a good place to keep expressing that bearish position, now we can move forward.
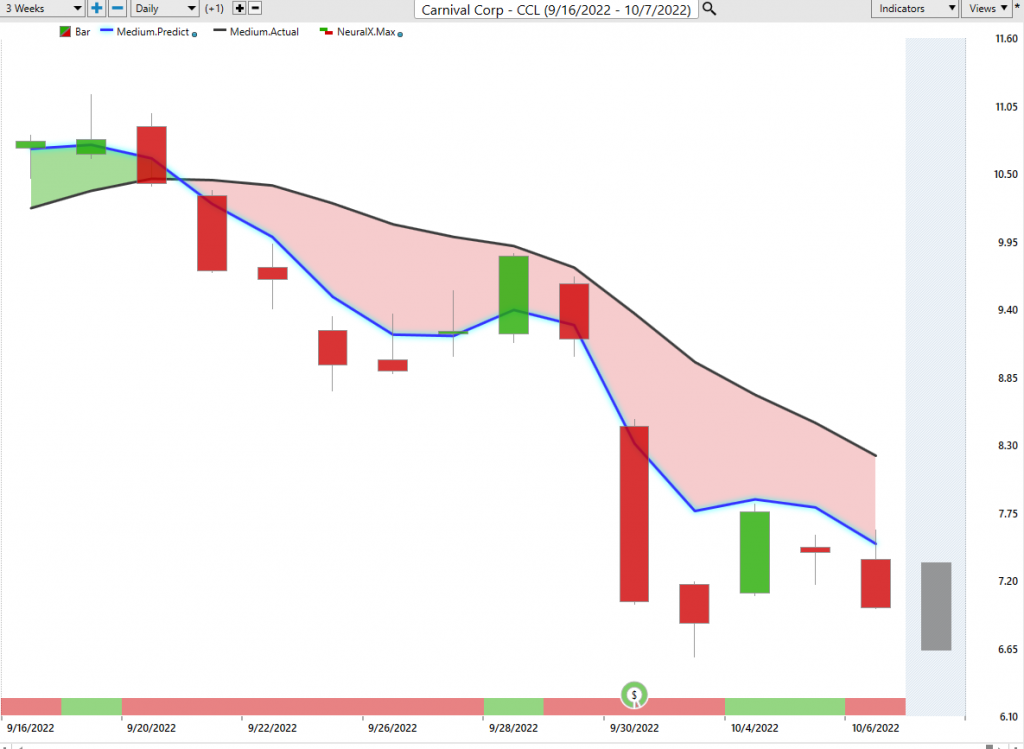
We got shares of Carnival Corp, and this was interesting because a couple of weeks ago we looked at this on the upside, it was one of the few markets in a very bearish overall S&P and Nasdaq that was doing well.
But as the crossovers move to the downside, it becomes very clear that you only want to short and take profits on shorts. And you see what was waiting for you about two weeks after that crossover moved to the downside, some extreme volatility as shares move lower. So again, we can look at these predicted highs and they act as a very good level to let traders know where to get that position on so that even during periods of volatility, like we’re going into another Friday session here with some news, well, you have some areas where you’ve gotten some excellent positions in the market and you can keep expressing those, keep those positions on so that as volatility kicks in and those trends continue, you’re there to make a lot of money.
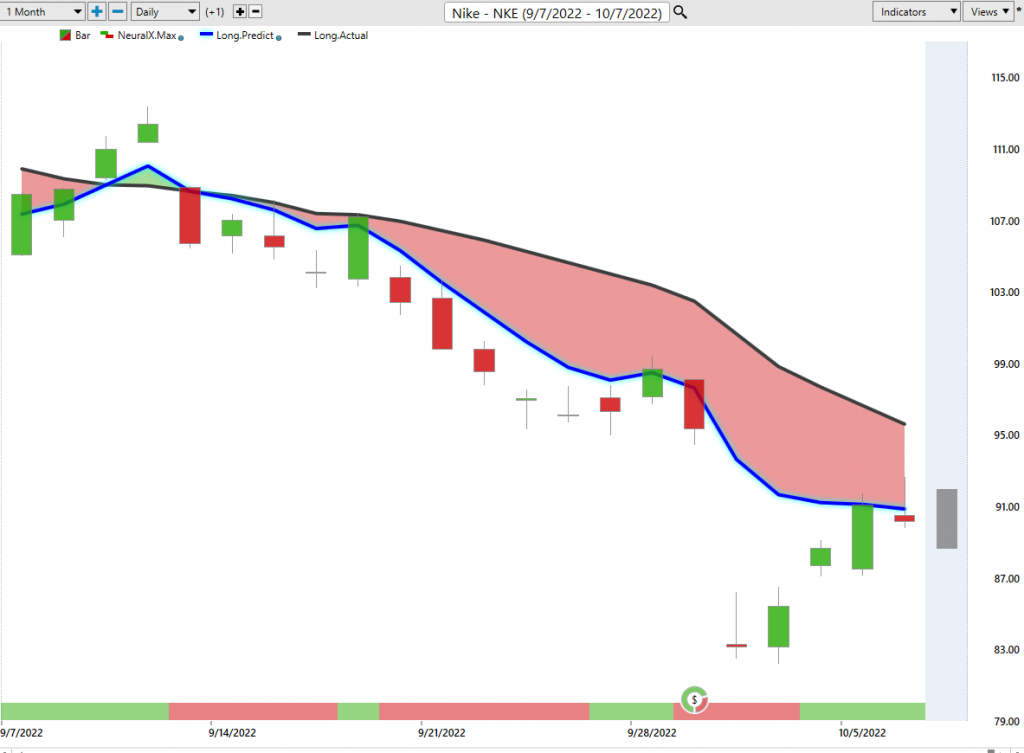
We can move forward to shares of Nike. And here we had some earnings and what’s great about the software is this very high level of accuracy, especially from things like the neural index, this is upwards of 85%, 86% accurate across a whole wide range of markets.
But you can think of it pretty much right four out of five times. And this will be very helpful to help guide those traders and understand again, where is that momentum really kicking into the marketplace? And so we can use that to know, okay, well, despite earnings, despite fed announcements, despite CPI, despite unemployment claims, you’re getting that very high level of accuracy linked to what you’re using to make your decisions. And so here we see Nike off about 15% in the past 16 trading days. It’s about 200 shares, about a $3,200 move to the downside. And you see just a lot of volatility here around earnings you see in the short term, it’s letting you know, look, expect some short term strength here. And that’s how you can do some trade management to make the most of each of these opportunities. Now, I want to pivot things over here and highlight some sort of different opportunities and how we’ve seen things shift literally from last week.
So I make these videos every Thursday night going into Friday morning. And these are some very important shifts that traders need to be aware of that are happening throughout the market.
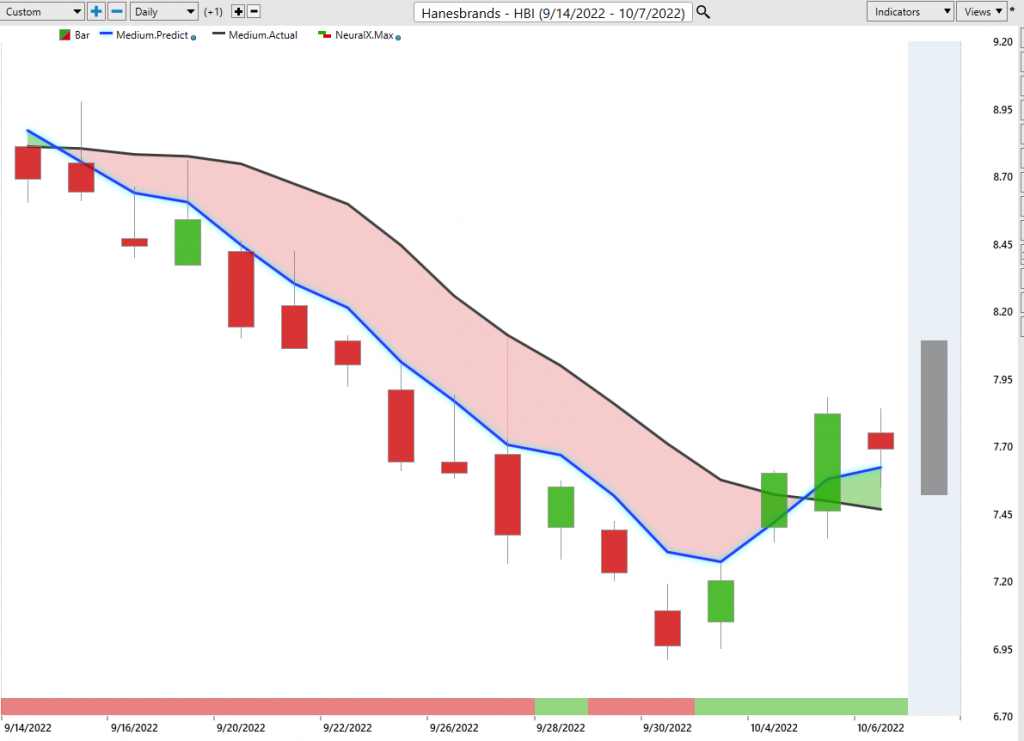
So here, shares of Hanes brand. And what I just want to highlight is we have this crossover to the downside and you see again how the forecast work extremely well to help the trader understand, okay, where do I actually want to be shorting the market? You see you get one of these days where you move higher, but you start to see, hey, there’s actually some strength coming into this. So there’s some great entries to short this. You see this a very low price stock, but it’s become very clear that certain areas of the market are actually pivoting to the bullish side. And you really need to understand this and understand where are those areas where there’s actually opportunity to the upside, and where you certainly shouldn’t remain short.
Some of those opportunities that are still bearish, well, okay, well those are still in a bearish trend, but some of these things are pivoting to the upside. And where it’s the most obvious are things like energy, metal, mining.
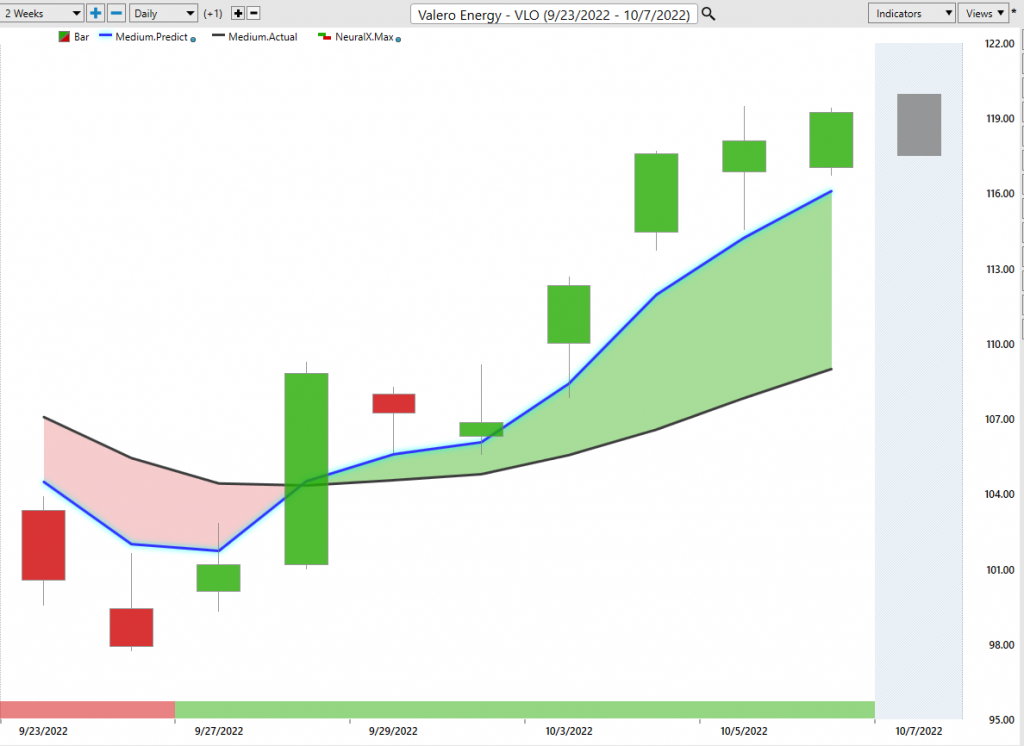
Here in Valero Energy, you see this crossover to the upside neural index bullish the entire way. For the past week we’ve had a $10 move per barrel in crude oil contracts. And so this is what is happening here is you’re able to understand that, look, all of these indicators are skewing to the bullish side in energy and you get a 14% rally just over the past seven trading days, about a $3,000 move in shares of Valero Energy. Last opportunity to take a look at here, we had a huge move in gold and silver over the weekend, especially silver moving about 8% two days in a row going into the week.
Freeport McMoran Copper and Gold ($FCX)
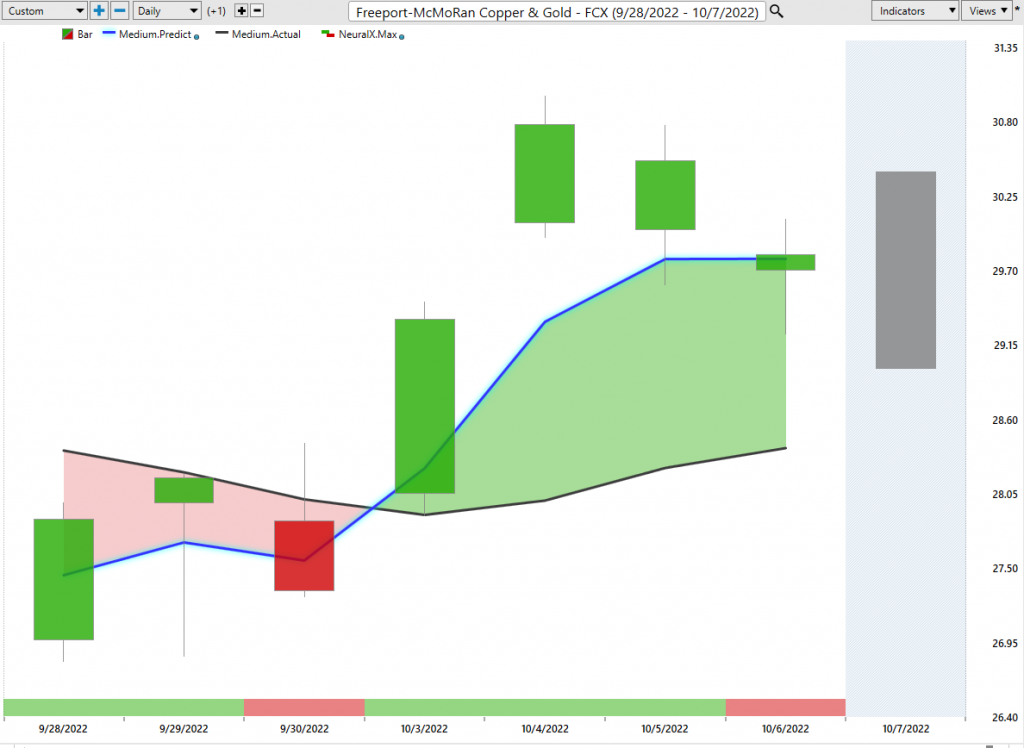
Well, here’s Freeport-McMoRan copper and gold, these metal and mining stocks, and this is where you’ve seen these crossovers to the upside. Neural index bullish is a very fast moving prediction, but this is what this is all about. You see this neural index getting bullish, this is almost exactly like Apple back in June, get this crossover to the upside and then you can use these short term forecast to help manage the opportunity. So if you want an entry on a possible trade where you see you’re getting that at exceptional levels with the opportunity to take some profit and keep managing those opportunities. So if we get that continuation of the move, great, that’ll all come down to the way dollar and some of these really big macro market start to move. But you’ve seen already some pretty aggressive moves in the marketplace, especially specifically in these areas, about a 12% move, again, that $10 move in crude oil contracts.
And this is how you can make money in the stock market despite some of the weakness that we’ve seen spread out more generally. So I’ll go ahead and leave it. There’s been a really exciting week in the markets. We’re getting big dollar shifts, big shifts in oil and these things, and it’s opening up a lot of trading opportunities. So make sure that you get that live demonstration, learn more about the specifics about how this can help you and your trading style and your approach. And I wish you good luck and all the best. So once again, this has been the Hot Stocks Outlook for October 7th, 2022. Thank you all for watching. Best of luck and bye for now.


