


Welcome to the Artificial Intelligence Outlook for Forex trading.
VIDEO TRANSCRIPT
U.S. Dollar Index
Hello, everyone, and welcome back. My name is Greg Firman, and this is the VantagePoint AI Market Outlook for the week of November the 29th, 2021. Now, to get started this week, we’re going to begin where we always do with that very important US dollar index. Now, a quick update on what indicators we’re using in this week’s outlook.
Our 52 week outlook is set to 47 weeks, so we can stay within the calendar year, we’re using bars, not candles, our long-term crossover, our long-term predicted difference, our medium-term predictive difference, the neural index, the neural index strength meter, which we’ll discuss in a moment. Our point in time set at the weekly opening price. Now, we’re also using our predicted highs and predicted lows, our triple EMA cross, again, and modified to remove the medium-term and short-term crossover.
We’re going to look and focus on the key pivot area of the T cross long. And of course, the very, very popular verified support and resistance zones. When we’re looking at the dollar, and again, I’m going to leave the point in time. It’s going to be set from last week. We can see that the dollar index immediately out of the gate started moving higher. Excuse me. Now, as we started moving higher into Wednesday, we started to get into the holiday short week.
And of course, the dollar has had a big sell off on another COVID scare that’s hit the market in thin illiquid condition. We’re going to take that with a grain salt, but this is why we have these key pivot areas in the weekly outlook so we can identify where our turning point is. Now, the turning point would be if we close below the T cross long at 95.58, that is the key level we want to look at to begin the week, if we’re holding above that, the dollar will retain these gains.
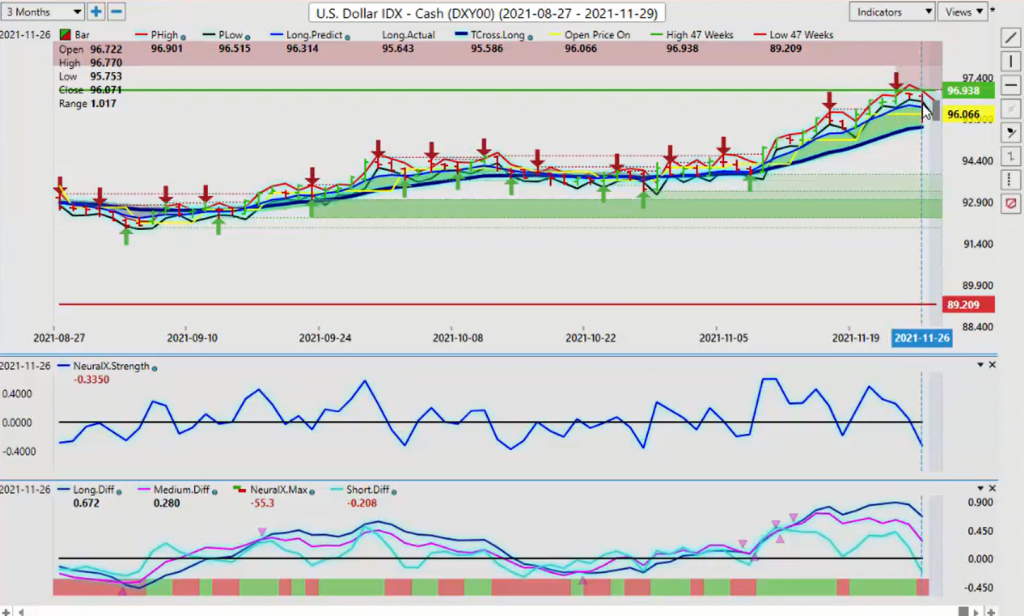
If the dollar is breaking down below that, we’re likely going see a deeper pullback. I don’t know if we’re going to hit as low as 93.60, but we could pull back. As I’ve stated many times, that the VantagePoint forecast for the dollar in December usually are not very favorable. That seasonality of dollar weakness in the month of December, we’ll see if it remains this year or not with COVID. But it certainly does look like it’s struggling. Now, we’ve put a new high in for the year.
We’ve hit a high of 96.93, but we can see that the neural indexes turn red. Now, the alternate neural index indicator is the neural index strength meter. Now, the strength gives us our zero line, but it also gives us a slope. Now, we can see that the slope is changing on the VantagePoint predicted highs and predicted lows, but this actually started in progress on Thursday night. Now, we can see that the predicted high range and the predicted low range is starting to point down.
The neural index strength meter has crossed the zero line. Our predicted short, medium, and long-term differences are losing upward momentum. This is telling us going into next week’s trading. This gives you a trade setup that you can replicate in your VantagePoint software, which is very important when you’re going into a new week of trading. That is going to absolutely be very, very volatile. We’ve got the nonfarm payroll number. I’m not sure where we’re going with this new COVID variant yet.
We’ll have to see how this one plays out. But again, we need to identify these critical levels.
Gold
Now, when we look at gold, gold had a bit of a bounce on Friday, but still not very impressive. We’ve come right up to the VantagePoint T cross long. We’ve hit that level to the number at 1,815, and then we’ve pulled back away from it, closing out the week at 1,791. Gold very bearish on the year. This is something we have to make sure we’re understanding here.
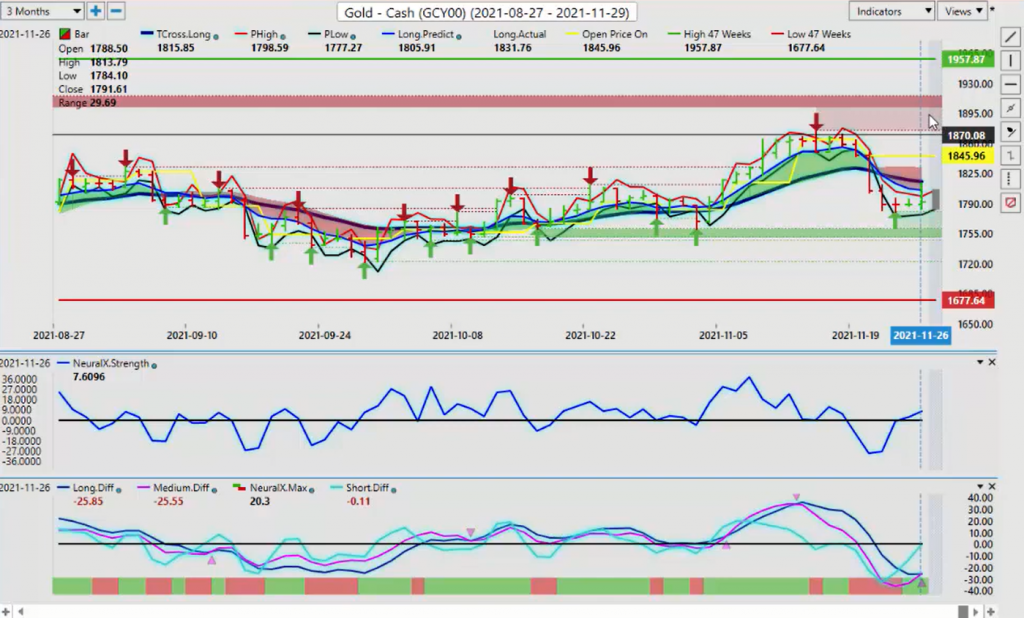
We’ve got our high for the year up at just over the 1,900 mark, but the yearly opening price, again, it doesn’t point to a lot of strength. Now, gold could recover if we get into the lockdown stuff and all this again and we get a scare and the Fed is no longer going to hike rates. The unemployment number coming on Friday, it’s an important one to see where we’re at with the US economy. But for now, in order for gold to advance, you can see we would have to break above the T cross long at 1,815.
So again, starting your trading week, because this is, again, an outlook, not a recap of something that already happened, we’re looking at these critical levels and drawing a line in the sand and saying, “Okay, 1,850, the VantagePoint T cross long, if we can get above that, we could see further longs.” Now, if you disagree with that, then you can sell into the 1,815 level. I would suggest having a buy limit order ready to go above 1,815. You cut your short. You go long right away.
Under the current market conditions, that’s not unreasonable. Because if the COVID… If we start getting more cases from this new variant, airports shutting down, economy starts shutting down again, that will favor gold, so it’s entirely possible. Right now, when we combine the additional VantagePoint indicators, we’ve got our medium-term crossing our long-term predicted difference. You can see this red arrow pointing up. The neural index, the slope of it, has broken above the zero line.
We are starting to see a mild up slope here with the predicted high measurement and the predicted low measurement. There’s turning from a pointing hard down. They’ve flattened out, and now they’re starting to turn up. This would tell me that gold could see a recovery going in as early as next week, but that nonfarm payroll number is likely to keep gold contained until at least Friday. Now, with that big sell off in the equity market, you can see here that we spent the entire week below the weekly open.
Now this is, again, a strategy that you can replicate with your VantagePoint software using the point in time indicator or just simply drawing a line on your chart on the weekly opening price. If we’re below the weekly opening price, the bias is that it’s going lower. If we remain above the weekly opening price, then it’s bullish. It’s a very simple calculation.
S&P 500 Index
Right now we can see that the S&P 500…
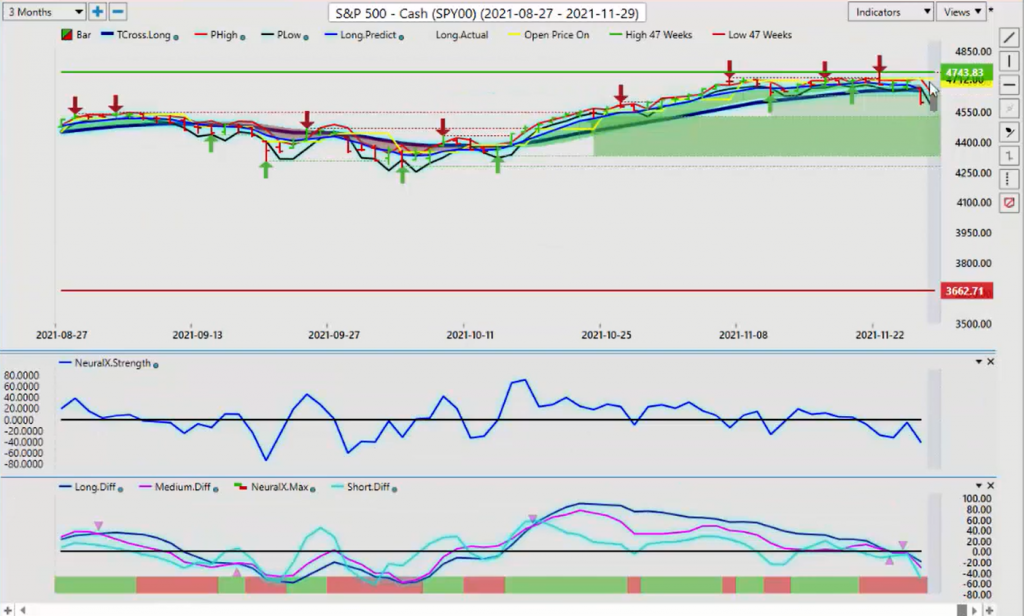
And this can be a strong benefit to using the neural X strength, because you can see that we’ve come up to the zero line on the neural index and now we’ve hit just below it and back down. The slope of that is pointing down the S&P 500. But once again, we’ve got very heavy verified support down at this low at 4,524. I think you’re going to have some buyers coming in here, guys. The stocks have been very, very strong even with the COVID virus. Going back to March-April 2020, and then again in 2021, the S&P.
Lot of buyers on dips here, guys. But for now, we are looking at, to start the week anyway, additional weakness. Now, our T cross long here is coming in. Our long predicted is at 4,661 and our T cross long is 4,652. These are the levels that we need to overtake hopefully by midweek if the S &P is going to have a good December. But it’s perfectly normal for them to just flush out the system. The broker’s running the stops on everybody who’s long up here.
Once they’ve got all those stops, then the market turns around and goes higher. I would be looking to buy in a dip once we get that neural index back on board.
Crude Oil
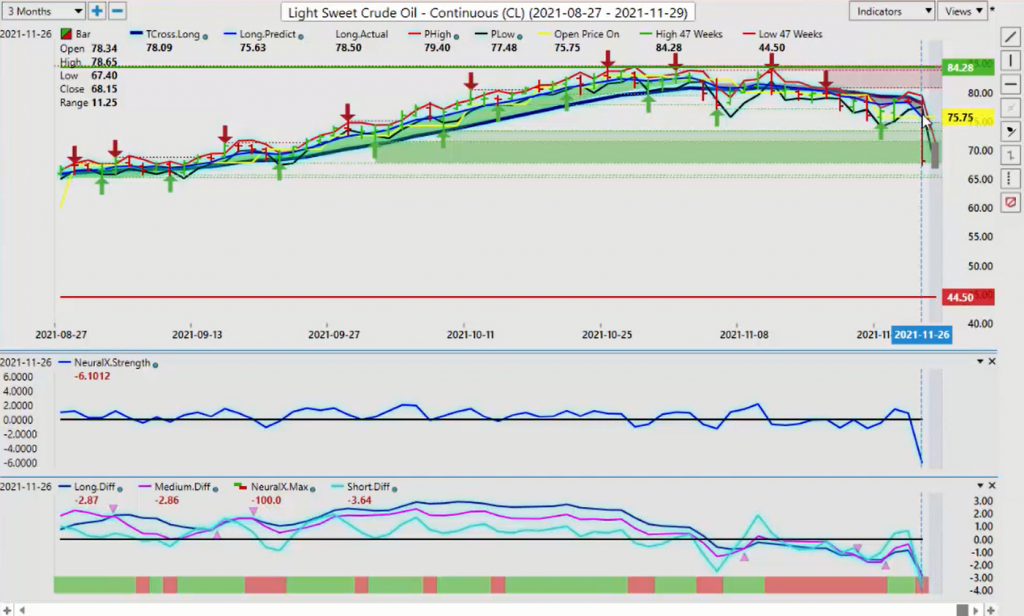
Now, when we look at light sweet crude oil, a lot of talk of that, especially here in Canada, big drop of the gas prices, 11 cents. But again, is this just a big overreaction to this news of the South African variant? That’s something we need to see.

Now, by the end of day on Monday, what I always tell my direct clients and in the VantagePoint Live Training room is we wait until midday Monday to start looking for trades and let all of this stuff settle down. Make sure all markets are back in before you start taking trades. Because, again, we want to see how the market and more specifically how the US stock market is going to react to this latest COVID news.
Now, if they brush it aside and they say, “Nope, it’s under control. The vaccine’s working,” then money is going to pour back into probably oil contracts and equity markets. But if the S&P 500 turns around, we’re looking for oil to turnaround also here.
Bitcoin
Now, with that dollar weakness we’ve seen… Or with the dollar strength, excuse me, we’ve seen Bitcoin pressuring the overall part of the range. But this is why we have these verified zones. Our low is at 54,317.
If we’re seeing that the dollar is getting ready to, if nothing else, correct lower, then this could support additional longs on Bitcoin to start the week. Bitcoin has continued to make new highs this year, almost at the 70,000 mark. Very, very bullish. And again, you’re going to have people out here looking for bargains on longs, and I believe they’ll probably target down around this low at 54,000. Keep an eye on that to begin the week.
We’ve got our predicted differences are still saying that we’ve got some underlying strength, but our neural index, the slope of the neural index, but its price has been distorted by Friday’s price action in the holiday short week, the announcement of this COVID variant. So again, make sure you’re waiting until midday Monday before we start getting into either long or short positions with this.
Euro versus U.S. Dollar
Now, as we look at some of the Forex pairs going into this week’s trading, the Euro, again, really loved it when the dollar index took a break. You can see that they’re flushing all the shorts out of here. We did discuss this in the VantagePoint Live Training Room on Wednesday and I stated very clearly that I seriously doubt the Euro is going much lower this past week. We’ve bottomed out here, but we have set a new yearly low at 1.1186.
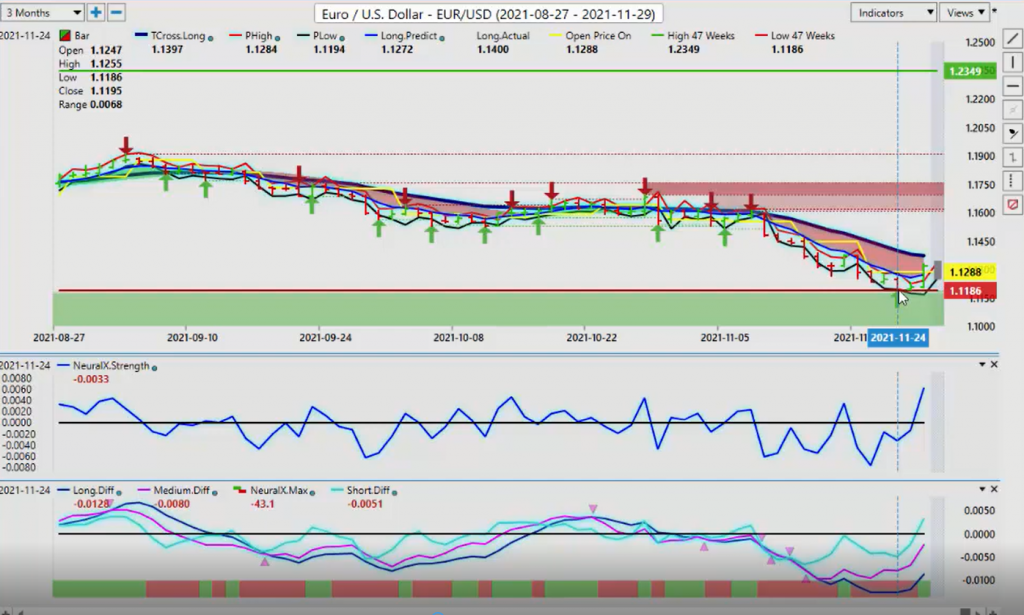
You can see the slope of the neural index with the strength is pointing up. Our predicted differences, all three of them are starting to point higher with a green neural index. But once again, we must respect these VantagePoint predicted moving averages. That T cross long, 1.1370, that’s where your battle lines are going to be drawn, right in that area where the bulls and the bears are going to be really fighting it out. So once again, you can short into…
The way we would look at this going into live trading is we would say, well, the primary trend on the Euro is clearly down, but we have seasonality in the dollar, which the dollar is usually weak in the month of December. Once we get past this payroll number on Friday, maybe enough to boost the dollar, but the Euro must clear this level of 1.1370. We can sell into 1.1370, or we can have long buy orders ready to go about 1.1410.
But again, be careful on Monday because of this market distortion from the holiday short week, the US Thanksgiving, and, of course, the COVID variant. These things matter, guys. But as long as we know our levels, we’ll watch this very closely for any kind of weakness in the VantagePoint indicators right around this 1.1370. Be careful of that Tuesday reversal. Now, when we look at the US-Swiss Franc, the US-Swiss Franc is largely a dollar index trade. It’s a very, very high correlation.
U.S. Dollar versus Swiss Franc
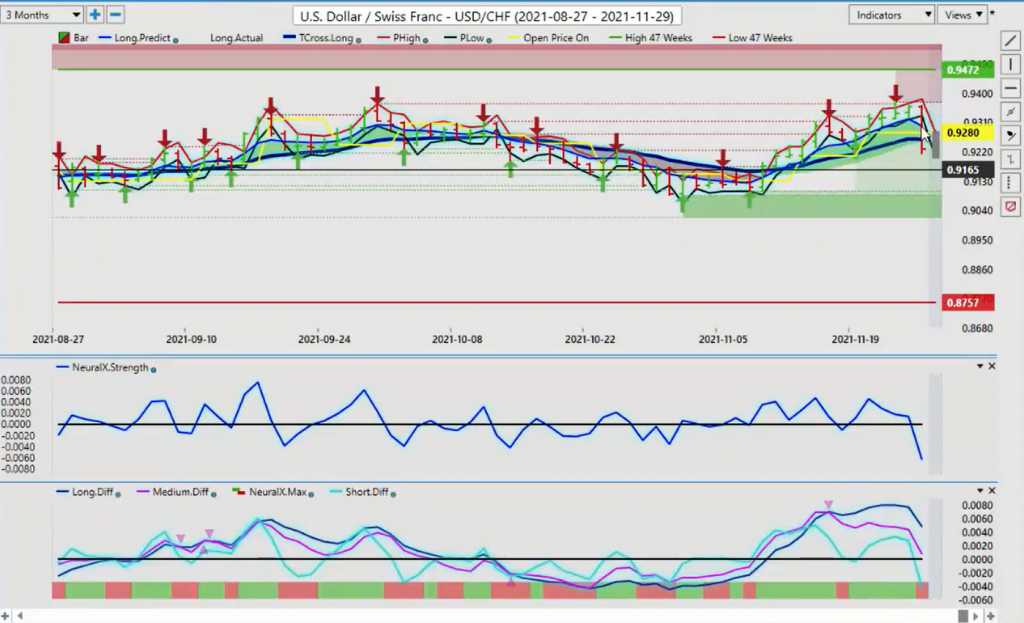
When we look at US-Swiss Franc, we’ve broken down and closed below that infamous T cross long at .9257. But this is a stock trade, guys. If the S&P 500 starts recovering by mid to late day Monday or Tuesday and Wednesday, if the S&P starts rising, then the dollar-yen will start moving back up, the US-Swiss Franc will start at moving back up, and gold will start moving back down. These are the correlations that we want to watch. Keep an eye on that level. But right now, we’ve got our neural index.
You can see that the original cell on this came all the way back here on November the 17th. We’ve corrected back down. We’ve hit the T cross lon, and then rallied right back off of that by some 240 pips. I would be looking for a similar trade set up here if the stocks can recover.
British Pound versus U.S. Dollar
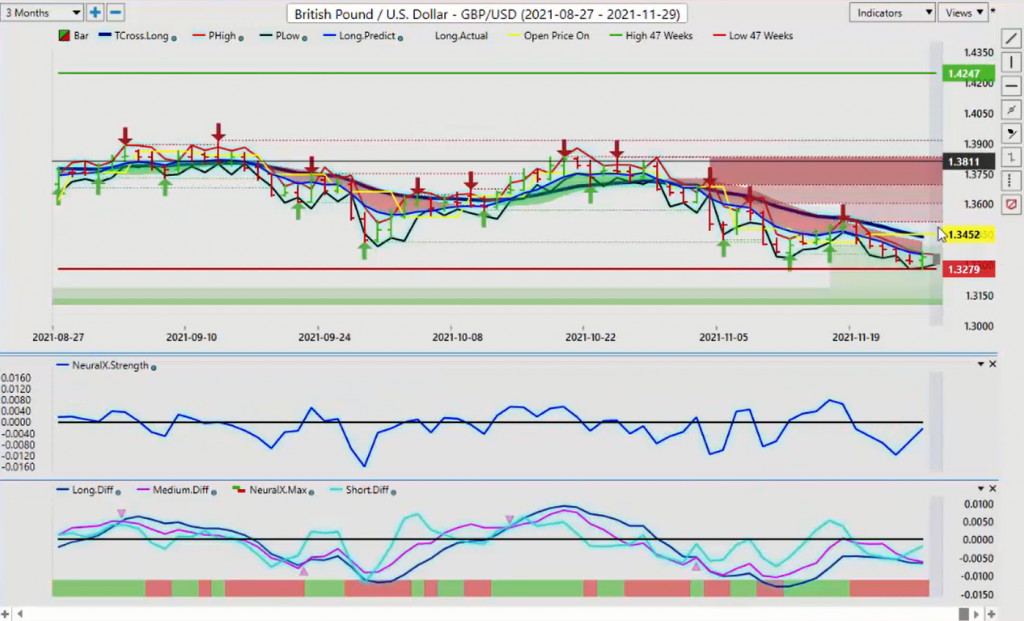
Now, with the pound-dollar going into next week, the pound slipping below its yearly opening price. Again, keep an eye on that 1.3650 level.
But you can see that using the weekly opening price at the beginning of the week, the VantagePoint forecast were spot on here. We’re holding below the T cross long and the long-predicted at 1.3441. But once again, we’re seeing signs of life, but we don’t that neural X strength meter moving above the zero line and we’re still red on the neural index. A little bit more downside is possible. But if stocks continue to crash, the pound does not like that. If oil keeps moving lower, that will also negatively affect the pound.
You want to make sure you understand the key levels to watch, the long-predicted at 1.3351 and our T cross long at 1.3439. We’re looking for any move from red to green in the neural index to warn us that the dollar is getting ready to sell off again in the month of December, and this could be a premium opportunity for longs down here. Now, once again, with a dollar-yen, very much a US-Swiss Franc trade. One thing I would always suggest is that we don’t trade bars that look like this on the short side.
U.S. Dollar versus Japanese Yen
When you’ve got a big, long distorted bar on a holiday thin market on a Friday, then there’s going to be some kind of retracement, guys. It’s got nothing to do with Fibonacci. It’s just you’re going to run out of seller is down here. The retracement point will be, again, for the T cross long at 1.1424 and we have our long predicted at 1.1453. If we want to continue with shorts, then this is the area we want to do it. Now, our VantagePoint predicted high is 1.1412.
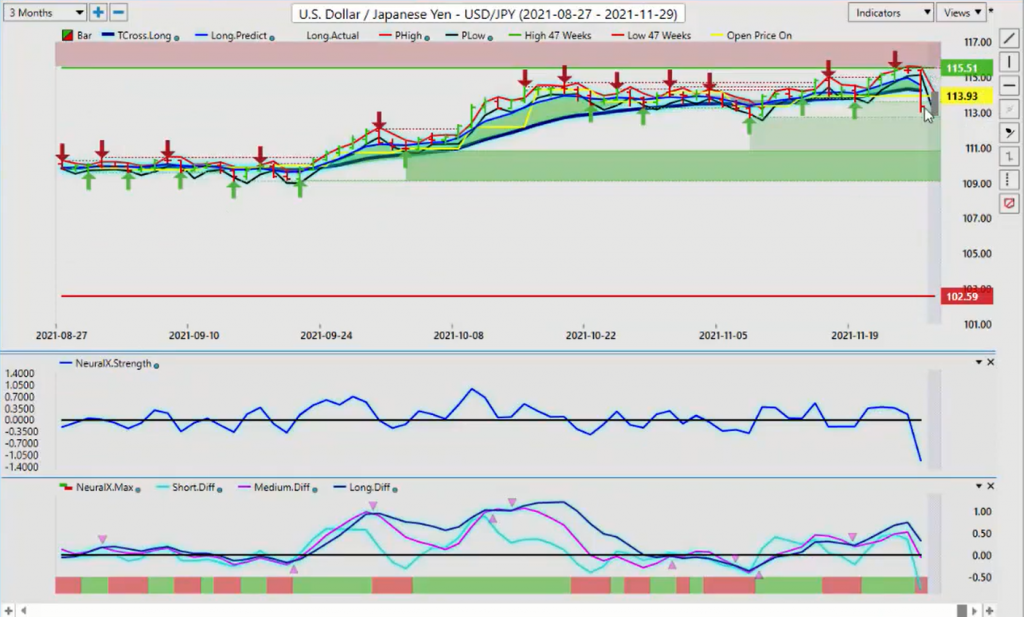
So that can be a starting point for your shorts at 1.1412, going all the way up to 1.1450. But my optimism on a lot of downside here remains heavily guarded because of that high correlation the yen has to gold and also the inverse correlation the yen has to the S&P 500. So if gold continues to move lower, like it has the better a part of the year, then the yen will weaken and this pair will go higher. I would strongly recommend you keep a very close eye on the 1.1273 mark, the verified support low.
We’ve got very heavy support down here. Only a breakdown below that would see a complete trend reversal.
U.S. Dollar versus Canadian Dollar
Now, with the US-CAD going into this week’s trading, it’s really taken a hit with the Canadian dollar with those oil prices tanking some $10 a barrel. We’ve broken above the yearly opening price, but you can see for the entire week we’ve been holding above this weekly opening price using the point in time indicator from VantagePoint.
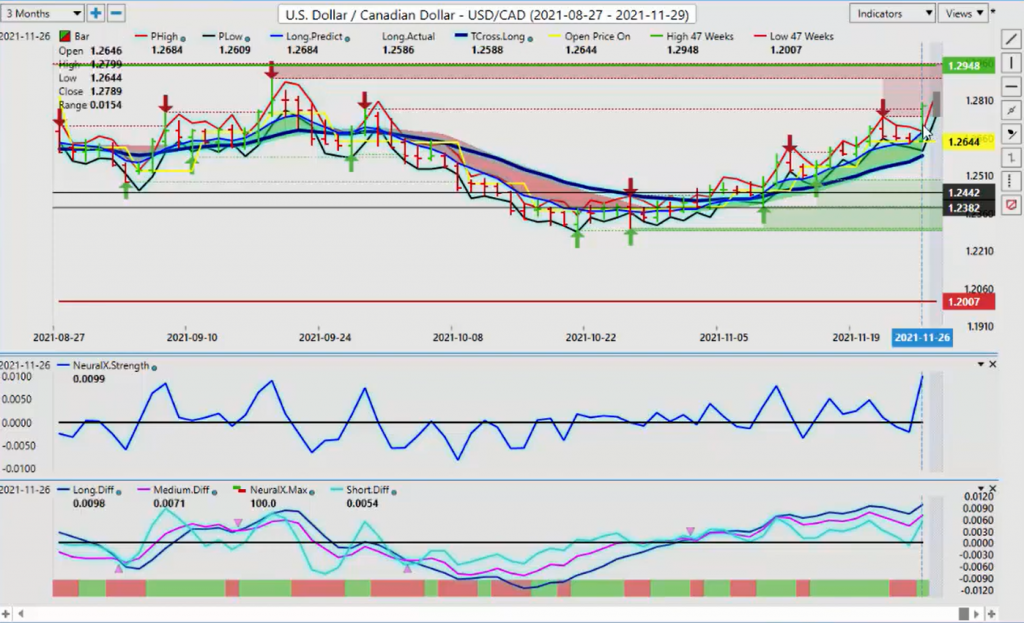
Again, you can use that or you can just draw a line on your screen and be mindful of that opening price. Right now, this is going to be a rather tall order for US-Canada to continue to advance to the upside. Because if you look at the close from Friday, that close price is 1.2789 and we have verified resistance zones sitting just above that at 1.2895. Any turnaround in oil and in the S&P 500, the US-Canada will drop hard. Be careful of a bull trap up here, long and short of what I’m saying.
But our neural index strength is looking good. The neural index itself is a little mixed back and forth here, but we’ve got good support levels. Those levels are coming in at the long predicted of 1.2684 and, of course, our T cross long at 1.2588. In my respectful opinion, only using the VantagePoint software for some 22 years now, the further the market moves away from these two predicted moving averages, the less attractive the long trade is for me, or the short, depending on which side of the market we’re on.
But the natural retracement point would be back towards one or both of these two predicted moving averages. Again, we’re getting very, very toppy up here. We’ve got our predicted low coming in at 1.2746. That is a starting point for longs. But in my respectful opinion only, it’s a little bit of a dangerous point there. I think 1.2684 at the VantagePoint long predicted is a much better area to start.
Australian Dollar versus U.S. Dollar
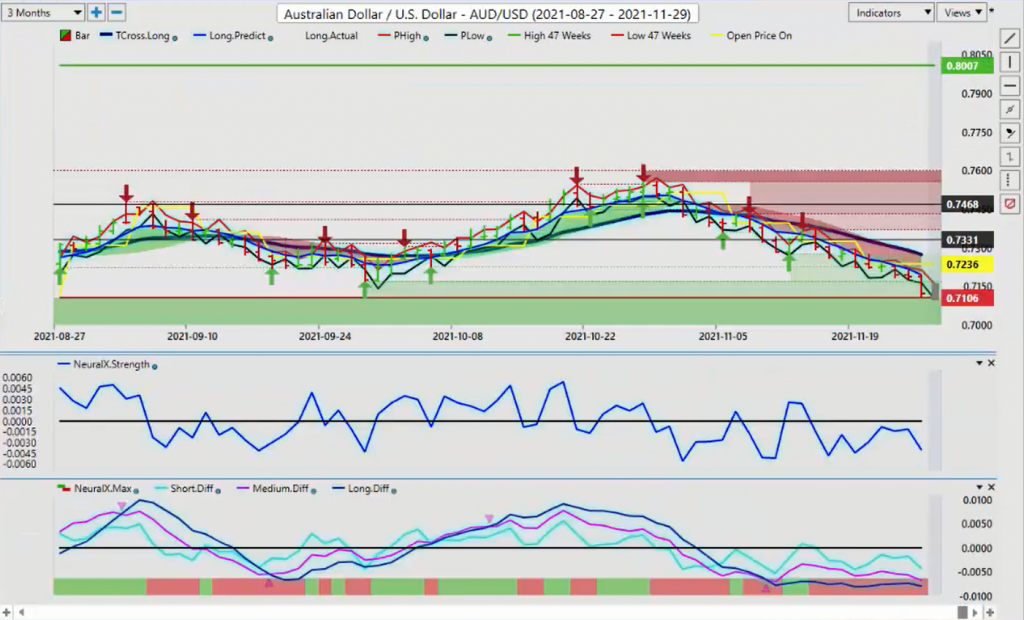
Now, Aussie-US and New Zealand-US, very similar, if not the same trade here, but risk off is not something that benefits the Aussie or the Kiwi. They both very much dislike that. We’re setting new yearly lows here. All the way down here, we can see now our 47 week look back here is coming in at the low. When we look at it up here, our a 47 week low is .7106. But this was just set on Friday. Prior to that, our yearly low has been coming in around .7170.
A big push down, but this, again, can be a classic setup for a bear trap here. Any turnaround in the equity markets, the Aussie will respond, so will the New Zealand.
New Zealand Dollar versus U.S Dollar
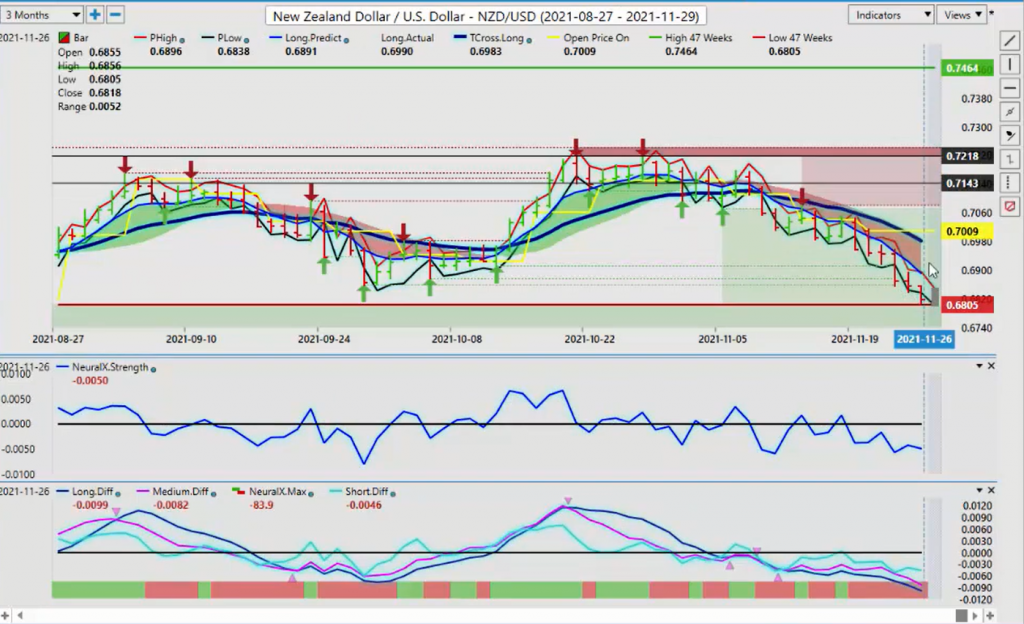
It’s a very similar, if not the same trade. Our upward pivot areas on New Zealand, they’re coming in at .6891 and our T cross long .6983. So once again, guys, the further we move away from that, the more likely it is we’re going to have some type of retracement.
It may be small, or it could be a full blown trend reversal. That will be left to be seen. We do have a very volatile choppy week next week with the nonfarm payroll, but with that comes opportunity. So with that said, this is the VantagePoint AI Market Outlook for the week of November the 29th, 2021.


