


Register for a Free Live Training
The Hot Stocks Outlook uses VantagePoint’s market forecasts that are up to 87.4% accurate, demonstrating how traders can improve their timing and direction. In this week’s video, VantagePoint Software reviews forecasts for SPDR SPY($SPY), META ($META), QUEST ($DGX), SPDR Gold Shares ($GLD), Cambell’s Soup ($CPB), IAC/Interactive ($IAC), Intel ($INTC), HASBRO ($HAS) and AMDOCS ($DOX)
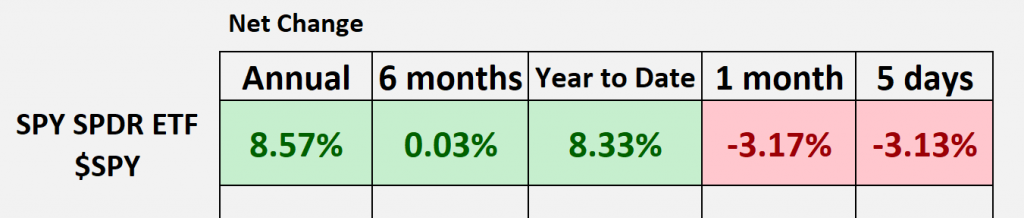
SPDR SPY ETF ($SPY)
Hello again, Traders, and welcome back to the Hot Stocks Outlook for October 27th, 2023. I hope you all are having an excellent week out there in the financial markets. As always, we’re going to cover a lot of exciting opportunities taking place in the financial markets here, so if you haven’t already, be sure to click on that link in the description below, and you can get a live demonstration to learn all of the specifics about how these tools that we’re going to highlight here really work to help the trader day in and day out in the marketplace.
So, as we typically do, let’s take a look at the broader markets here via the $SPY. As we look back over some of these time periods, well, we can see that we’re really starting to eat into that 12-month period back on the chart, about eight and a half percent. Similarly, the year-to-date number is now only up about 8%. So, this has really been the story as we roll forward every 30 days; this will get reset, but we’re down another 3% and seeing things accelerate. This is why it’s especially important to have tools like Vantage Point to help you make sense of the markets that you’re trading and make these better trading decisions.
So, what I want to do is go through a lot of these charts and highlight really the suite of these predictive indicators. It’s not just our predicted moving average; we’ve got our neural index at the bottom and a predicted high and predicted low range that helps traders in very short-term price action and price levels.
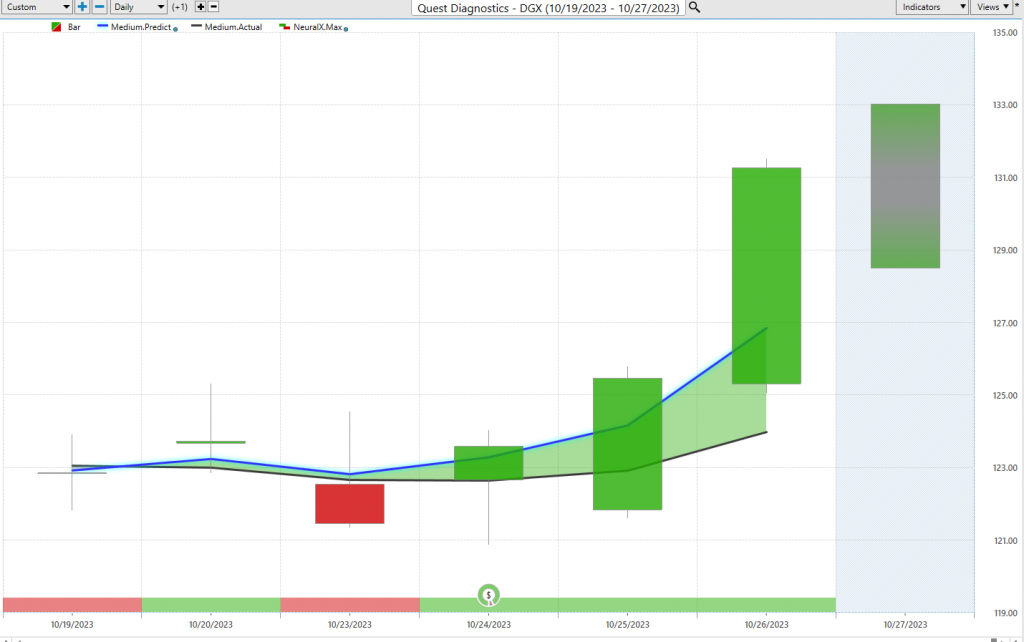
So, starting here with Quest Diagnostics, what we have here is that daily price action. So, it’s right up against those bars and candles that represent a complete trading day. We always have our black line and our Blue Line value.
Now, what that black line on the chart is, that is a simple moving average. This is a very common technical indicator, and in this case, it’s a 10-period simple moving average. So, it just looks back over the previous 10 closes, adds those together, and then divides by that number. So, what we use that for is our baseline, right? It really lets us know where market prices have already been over, you know, given this 10-day period and, you know, just makes sense to smooth out that price action. But traders need to be ahead of that next shift and move in the marketplace. So, what we want to pay attention to is the value of this blue line.
For this number, which is essentially a price prediction of average prices moving forward, for that number to get plotted and calculated on the chart, well, this is where the technology of artificial neural networks comes into play. They perform what we would call intermarket analysis. So, what that means is Quest Diagnostics here, it’s not just driven by what happened in the past, where past prices have been. It’s going to be driven by things like the US dollar, what is the SPY doing, the broader markets, what are some ETFs around the Medical Diagnostic space doing, and market relationships on individual stocks.
You can have leading-lagging relationships in shares, and it can even take place in things like commodity markets. Right now, we’re especially seeing a lot of movement in Gold and oil, and that’s affecting the stocks that share very important relationships there. But what we need specifically for Quest is what are those series of markets that are driving future prices. Well, that’s what Vantage Point figures out. So, it takes all of that information and generates future price predictions.
It’s those predictions of future prices that are actually used to construct these indicators, turning what were really lagging indicators that just reconstruct what occurred in the market into forward-looking predictive tools. So, whenever we see that blue line cross above the black line, that helps us recognize these very important shifts in the marketplace. So, last week, we looked at Meta, we looked at Microsoft, some of these stocks having their most recent shifts in the market, and that’s what helps traders get ahead of these moves in the marketplace.
So, here with Quest, it’s a great example of identifying, okay, well, there’s the shift in the market. But now let’s look at these other predictive indicators. We have this bar you see at the bottom of the chart that goes from green to Red back to green. This is also utilizing that technology of artificial neural networks, but they’re not looking at Future average prices here; they’re just solving a different problem. And this is what traders need to do, is solve all these different problems.
The problem in this case is short-term strength or weakness over the next 48 hours. Very short-term, and this has an extremely high level of accuracy associated with this tool, upwards of 86-87% accurate on a very wide number of markets. This helps us in the short term, but even within that, we need price levels to identify where those buyers and sellers are likely to line up. So, we’re also given a predicted candle, essentially a very short-term forecast of where those buyers or sellers are likely to show up, and these levels are derived via this neural network process via the artificial intelligence.
What’s so interesting about Quest here is you see we get this crossover to the upside. There haven’t been a lot of great opportunities in the market, but if you’ve watched a lot of hot stocks outlooks, you see me comment on this a lot where when those crossovers come through, you see that in this example, we moved right down to the previous day’s predicted low and never look back. One of the great things about artificial intelligence is its ability to adapt, take into account what happened here, let’s readjust those predicted high and low levels, let’s readjust that neural index and give the trader everything they need to update that information and set those expectations.
So, we see here that once that neural index gets bullish after running sideways for a couple of days and experiencing a gap down, 48 hours later, well, the next neural index signal is bullish, we move down to this predicted low, and the market is accelerating to the upside here. We’ve had a lot of earnings, a lot of opportunities come through around that, but this is what’s so interesting about this when we look at Meta, look at Microsoft, Vantage Point does an excellent job of identifying where these traders are lining up. Here you see a 6% rally in the last five trading days in Quest, so a very interesting opportunity here.
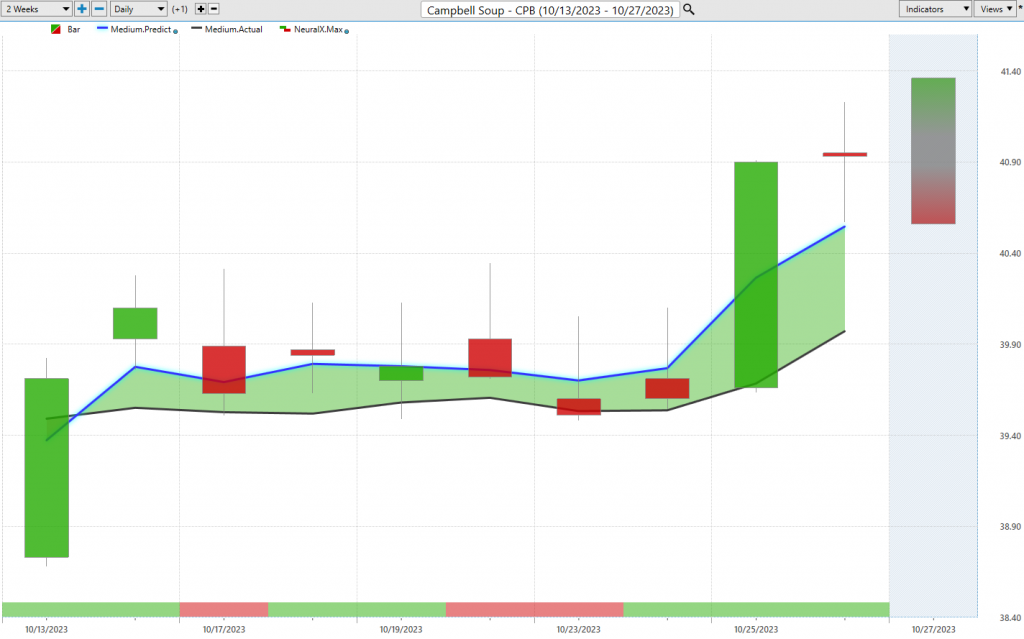
But let’s look at Campbell Soup, and I wanted to bring this through because it’s a little bit different. Here you see that Blue Line crossing above the black line, a shift happening a couple of weeks ago now in the marketplace, but the market ran sideways for a bit here, right? So, you see that neural index goes down to red, you get a couple of days sideways, goes down to red again, a couple of days sideways, but that blue line never crosses below the black line. So, what happens is we can say, okay, well, if we’re a buyer, where do we want to be looking for price levels in the market? And this is where Vantage Point‘s predicted highs and lows, you see here, do an excellent job.
So, as the market drifts sideways, you’re getting that updated information from the artificial intelligence that’s letting you know how this market is adapting and shifting based on the short and somewhat longer-term Trend-shifting indicators that Vantage Point provides.
So, a really nice opportunity here in Campbell Soup to get a really nice entry. But like I said, this market, you want to be quite careful here. So, about a 3% rally in just the past couple of weeks there.
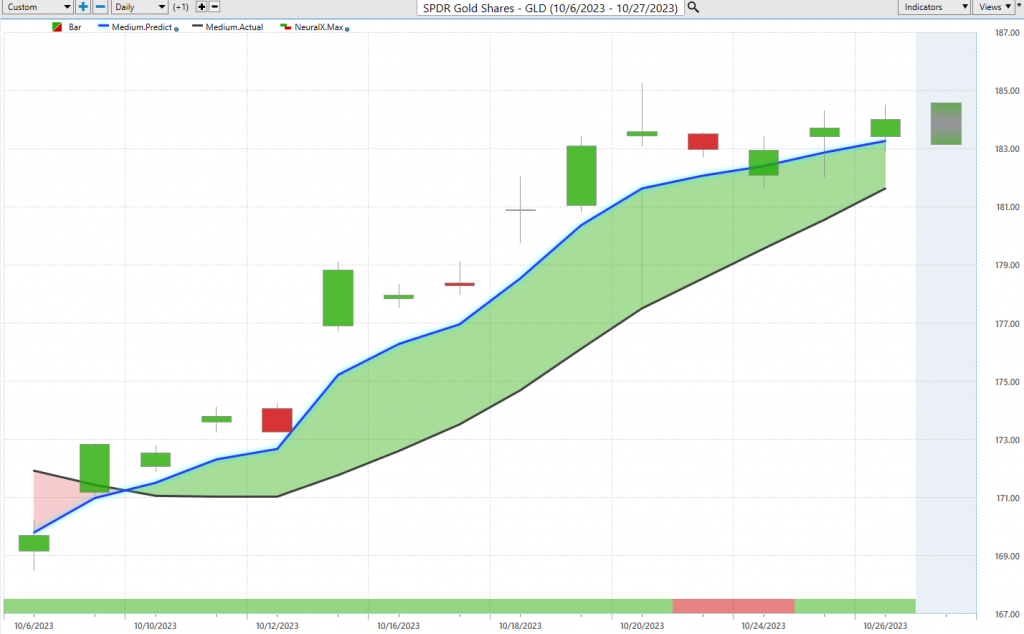
Here’s GLD, so we looked at a couple of gold mining shares just to highlight that point. Well, if Gold’s going to start moving up, it’s going to have a bullish effect, especially in the short term, on some of those stocks. And so, here’s actually GLD, right, a perfect representation of the gold market. We’ve had a lot of geopolitical risk on, and this is where tools like Vantage Point‘s predicted highs and lows do a really great job of analyzing the situation, seeing where the market prices are moving, and then making those adjustments.
So, what I wanted to highlight here is you see we get a lot of gappy movements here, but predicted low, predicted low, predicted low, predicted low, and constantly moving up towards these predicted highs if you’re setting some short-term profits or doing some short-term trading here. So, again, about a 6% rally here in the gold market just over the past couple of weeks, and a lot of that driven by geopolitical risk. But even within that, multiple opportunities to utilize the Vantage Point software and make the most of some of these opportunities.
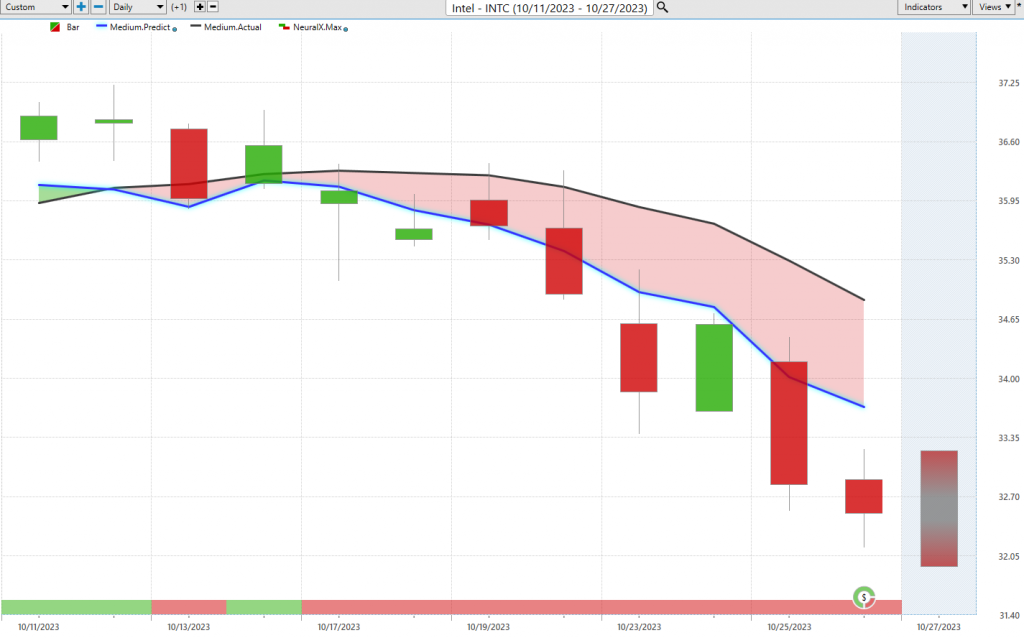
Here, shares of Intel, and now just getting to some of this weakness in the market, actually getting this crossover to the downside here. And again, what I wanted to highlight is neural index is actually bullish there, and you see, hey, we’re trading at higher prices 48 hours later. But what’s the trend doing? What’s the overall direction here in the market? Neural index again, you run a little bit sideways, but that distance between that prediction of the actual moving average and the simple moving average getting wider and wider and letting you know that there is some excessive weakness here going on in Intel.
And we’ve just seen that across the entire market, right? The S&P, the NASDAQ, kind of highlighted this last week of saying, yeah, Gold’s moving up, but a lot of this stuff’s moving down, and it opens up the opportunity to potentially get some shorts in the portfolio. You see Intel down about 10%, even just 500 shares there, about a $2,000 move. And this is why this is really important to get this stuff on the radar. Many of these things we’ve highlighted and kept in the bearish category, right? Hasbro, Amdoc, for quite a long time here, and this is sort of the point is you can use Vantage Point to identify this excessive weakness in the market. Then if you want to do some shorter-term trading, well, you’ve got the tools and the price levels to make those adjustments here.
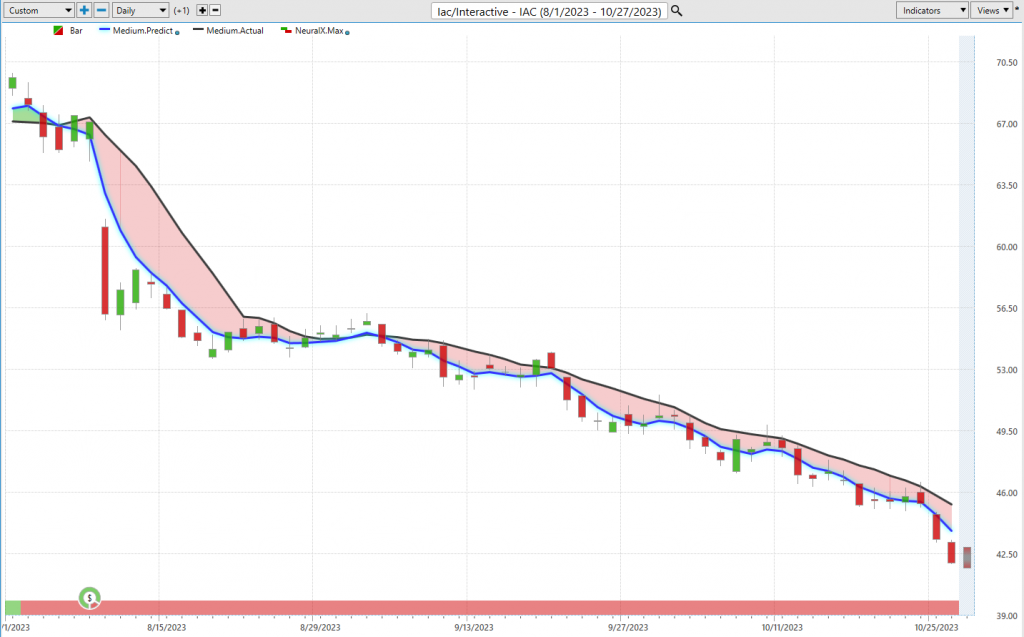
So, here in IAC Interactive, here you see that Blue Line crossing below the black line. I mean, look at this forecast; it doesn’t get more bearish. But we’ve got predicted highs and lows, right? It’s not just that predicted moving average. And so, as you understand there’s excessive weakness here, and as each day goes forward, warning you that there’s really no strength here, all you’d want to do is short, take profits on shorts, use these predicted highs to get the best price level in the very short term. And you see about 1, 2, 3, 4, 5, 6, 7, 8, 9, 10 entries, three of those coming just in the past couple of weeks. Again, finding those areas where the Market’s weak; we can use these short-term forecasts, and if we need to make those adjustments if things shift, well, that’s where Vantage Point‘s predicted levels will shift. The Blue Line is going to move above the black line; your predicted high and low ranges will start moving higher. But you’re not seeing any of that here, and you got a 23% decline in the past 37 trading days, again just 500 shares. Here’s about a $6,000 decline in value there.
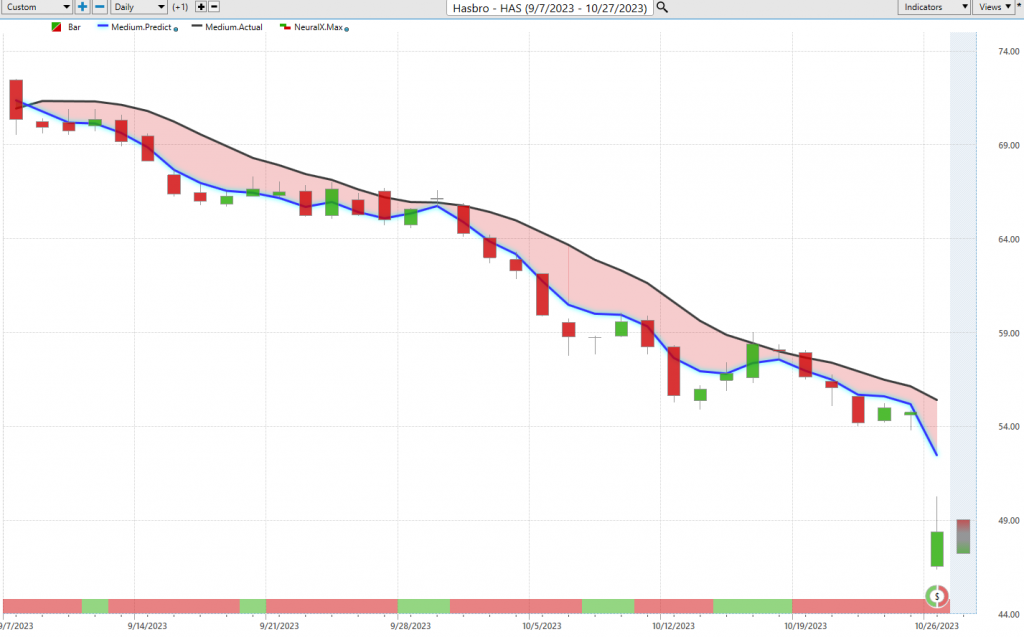
Here, shares of Hasbro, we keep bringing this through, and things just getting worse and worse here, right? So, most recent forecast from the neural index, quite bearish. Trend bearish. And of course, let’s bring in the very short-term tools, right? Those predicted highs and lows, and you’ve just seen here how to identify areas where there’s some excessive weakness, and then you’re getting an updated level every single day. But if you don’t have Vantage Point, you don’t have the predicted levels to come in and make some of these trading decisions on. And again, just a very, very weak market, and many of these things really getting accelerated by earnings, right? Some of those fundamentals coming in and driving things even further in the direction of the trend here. So, about a 33% decline, again, 500 shares. That’s a $12,000 decline in value there.
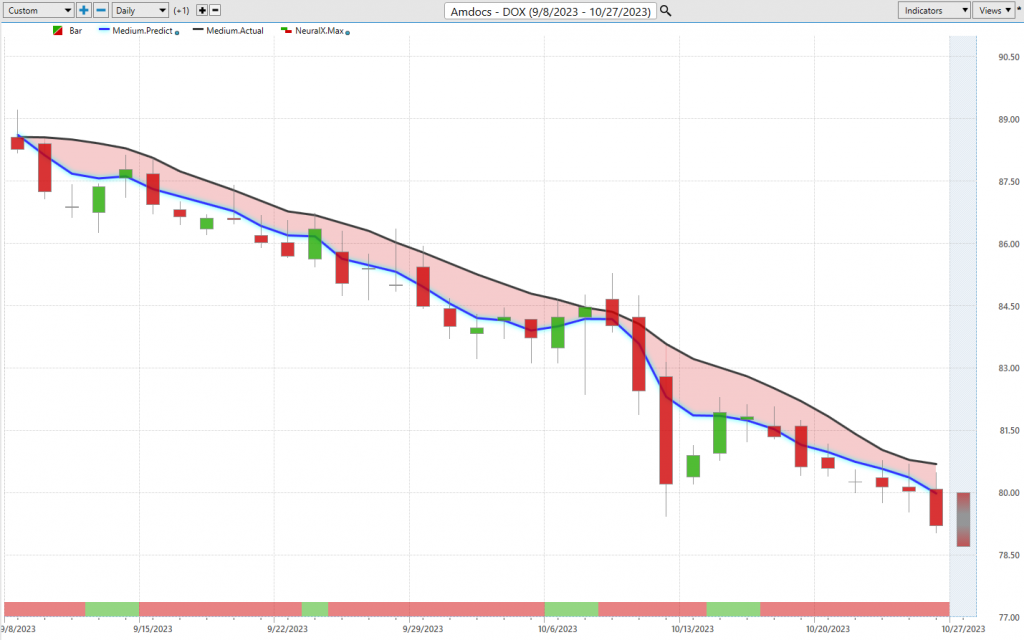
Amdocs, this thing is just, you know, this for months and months bringing this through, but very similar picture, right? Blue Line crossing below the black line, you get some blips here where that neural index gets bullish, and this is where again you get that subsequent price action, you see those higher high and the swing highs come in. But what’s going on in the bigger picture here, right? Very clearly, you’d only want to short, take profits on shorts, even use that strength to look towards Vantage Point‘s predicted highs and maybe set some of those bearish positions, maybe hedge the portfolio or just outright short the market here. So, again, a lot of tech stocks doing quite poorly here, and you really want to make sure that you’re situated in the right things in the strongest markets if on the bullish side at all here, right? So, about a 10% decline, 500 shares off about $4,500 there, in pretty short order, right? This is just about a month and a half on the calendar. Some of these things are getting pretty brutal.
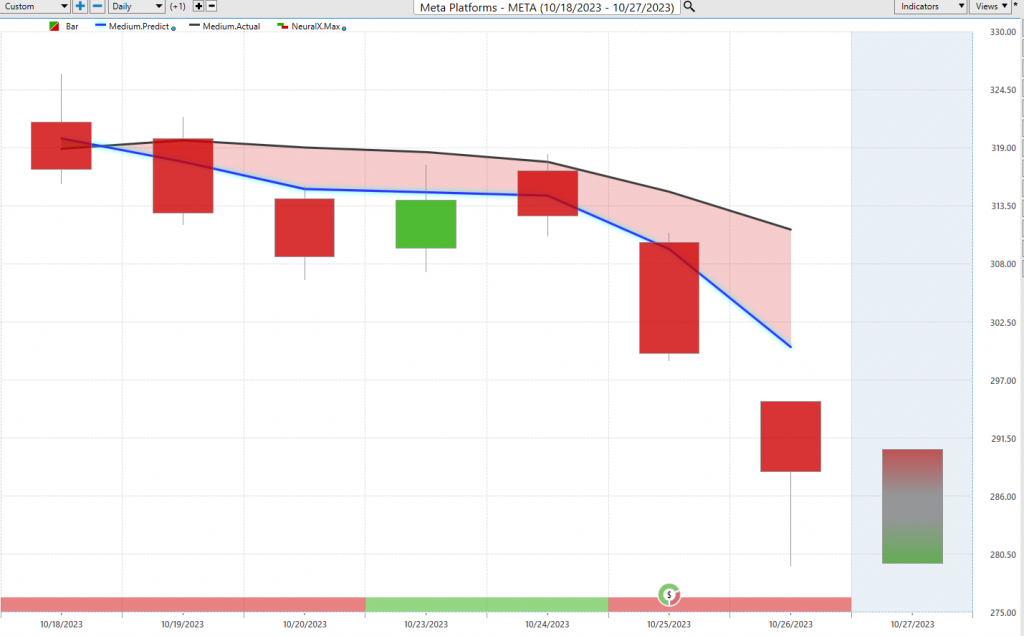
We looked at Meta just last week. We looked at Meta, uh, just last week again. Earnings coming through here, but highlighting, you know, this fresh crossover coming through. That, you know, this is a warning sign we’re seeing.
Tesla shares lower, uh, pretty much everything, but Microsoft, and you see that actually had an advance there after earnings, um, but again, these warning signs are saying, look, the trend is down. You know, we may get some short-term strength, and we actually get a gap up on that next trading day. But, you know, these predicted highs are really screaming at you as levels to not be long the market and are very susceptible to really exactly what we’ve seen, a continuation of the weakness, uh, throughout the marketplace. So again, really exciting things going on, uh, and, and new opportunities opening up where we see these market shifts. But, you know, of course, you really need these updated tools, right? So if you’re going to be doing day trading or short-term trading, or you know, benefiting off of predicted high and low forecast over a period of time, um, you know, this is something where you need that adaptive tool to really make sense of that, right, and understand that, okay, well, these shifts are coming, we need to go ahead and get out of the way potentially of many of these long opportunities and just wait for things to line up at lower prices, uh, if you want to go ahead and get longer or bullish exposure in the portfolio. So once again, this has been our Hot Stocks Outlook for October 27th, 2023. Thank you all for watching, best of luck, and bye for now.


