


Register for a Free Live Training
The Hot Stocks Outlook uses VantagePoint’s market forecasts that are up to 87.4% accurate, demonstrating how traders can improve their timing and direction. In this week’s video, VantagePoint Software reviews forecasts for Global X Cybersecurity ($BUG), Campbell’s Soup Company ($CPB), Enerpac Tool Company ($EPAC), Pfizer Pharmaceutical Group ($PFE), Tenet Healthcare ($THC).
Hello, again, traders and welcome back to the Hot Stocks Outlook for November 12th, 2021. Hope you all are having a great week out there in the financial markets. And as always, a lot to cover here in our outlook. Now, we’ll start out we got shares of BUG. This is an ETF, Global X Cybersecurity. Really good example of what’s been going on in the broader markets and how we’ve really been able to detect this shift that happened here in October.
But what we’re also going to cover here is we’ve got Campbell Soup, more recent sort of situation there, Enerpac Tool Group, Pfizer, and we’ll end on Tenet Healthcare. A lot going on just throughout the markets volatility wise, earnings, and really opening up a lot of tremendous opportunities.
But starting out here with Global X Cybersecurity, very important to understand how all this works. What we have is daily price action. Each one of these candles represents a complete trading day.
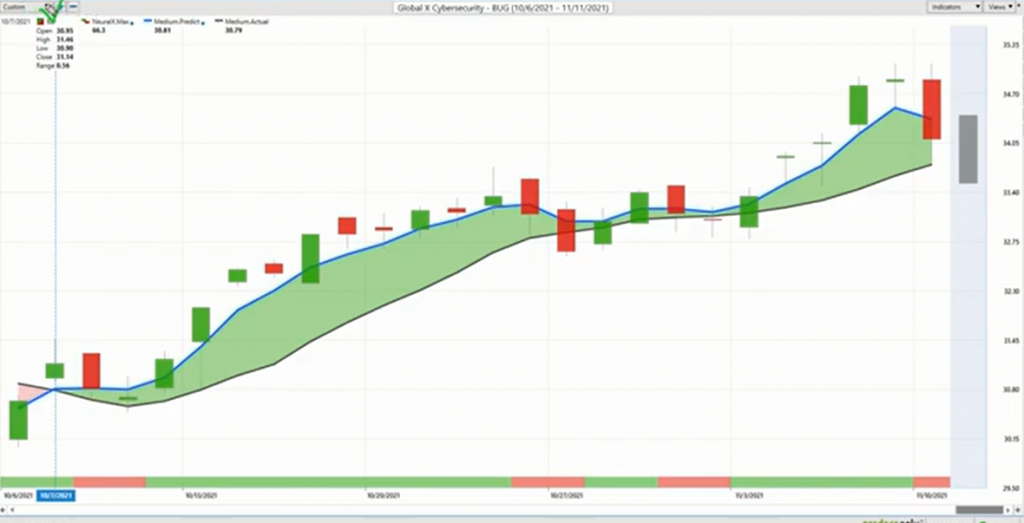
And right up against that price data, you’ll see that there is a black line and a blue line right up against the chart. Now, the black line that you’re seeing there, that is a simple moving average. It’s a very common technical indicator. We refer to it as the actual simple moving average. And what it’s doing is it just looks back over the previous price data. In this case, it’s going to add all the close prices together over the past 10 days divided by 10.
What it does is it acts as a really good tool to smooth out the existing price action and effectively tell us where the market price has been over a given period of time. But a trader needs to understand where is the market price going to go next. To make that determination, what we’re able to do is actually look at this blue value that gets generated via the technology found within VantagePoint. Now, it’s very important to just get a kind of grip on what’s going on here.
Now, for that line to get plotted against the chart, essentially a prediction of average prices moving forward, VantagePoint is performing what’s called intermarket analysis, so that’s analyzing relationships between markets, and it’s utilizing the technology of artificial neural networks and deep learning algorithms to do this. This is a technology that can learn as it takes in more iterations and more market data, but what it’s learning from are these intermarket relationships. That can be things like the S&P 500.
That can be other ETF markets. That can certainly be individual stocks. That can be the global currencies, interest rates. We’ve just seen huge rallies in oil. Even metal markets are starting to perk up, platinum and silver. Those all have a huge effect on the basic material stocks. And that’s an obvious way to think about it and everyone knows that that’s what’s going on.
But what’s happening with artificial intelligence is we’re able to find relationships that humans would not be able to detect, leading and lagging relationships, inverse relationships, positive correlations. It’s able to take all of that information, synthesize it, and actually generate a true price prediction of where prices are headed into the future. It takes that true price prediction and we’re using that information to construct predictive indicators.
Rather than having tools that just look at the past and sort of re-amalgamate price in one way or another, this is a forward looking predictive tool. When we look at these other indicators that are also utilizing this technology, like the VantagePoint predicted high and predicted low and the neural index at the bottom here, which is a 48 hour indicator, it’s that same technology, but tuned to these different problems. We got to get the overall trend direction.
We want to know short-term strength or weakness over a shorter term period, and also even down to intraday predicted high or predicted low levels where we may want to set limit orders or profit targets from. What we can do is if we go to the neural index and just sort of highlight what this is, this is a highly accurate across all markets. It’s accurate up to 86% accuracy. I mean, traditionally it’s over 80% on just about any market you’d want to look at, but what it’s doing is forecasting short-term strength or weakness in the market, but just over a 48 hour period.
When you know the overall trend direction and you know what your game is, you can understand that, hey, well, there might be some short-term weakness over these subsequent 48 hour periods. A way I like to think of it is probably expect the market to trade below that predicted moving average, right? We can trade above or below an average. Well, if the neural index is seeing weakness over the next 48 hours, expect it to probably move below. But you also have this predicted and lows for every single trading day.
Here’s the current prediction for today’s trading day, but we can see how accurate all of those predictions were against the actual market data. If you look at this market and say, okay, well, we’ve seen a shift here. I don’t want to take a long position. We can start managing this situation from here. Well, so far we’ve got about 11% rally in the shares here of BUG. We’ve seen the indices and stocks do some pretty phenomenal moves over that time period.
But when we really look more closely, we can say, okay, well, how would the guidance of these predicted highs and lows help us? You see that if you get in early here, you get a move higher there, but look how effective these levels are at really pointing out where on that short-term level you may want to accumulate a position or take some off with the idea that you’ll buy some back at lower prices, but knowing that you want to be long here and you’d only want to be long and taking profits and trailing stops potentially.
We get that move lower yesterday here. You see your predicted range trading lower. You can make those trade adjustments on how you want to deal with that or try to get lower prices. But very clearly the blue line is still above the black line. There’s still quite a bit of strength in many of these markets. But when things shift, the forecast will shift as well. We’ll take a look at Pfizer here. Going back to several months ago, we were talking about Pfizer on the way down and I think the way up before it went down and now the way up.
The software is just doing a really good job here.
Campbell’s Soup Company ($CPB)
Now, here’s Campbell Soup, and this is more recent, right? You see this blue line crossing above the black line, and this really gets to… You can run scans every single night. What was really a big help here in October where we see the BUG ETF shift, as well as the indices was running the Intelliscan that actually detects when these crossovers are coming through.
When you can run that on literally hundreds of markets and you see that, whoa, there’s actually a lot coming through over this October 7th, 8th, 9th period, something’s going on here, it really makes it quite obvious that you really want to get some exposure to this. This isn’t just a one-off situation. We see in this situation blue line crossing above the black line. And again, we can just look at that straightforward approach of, okay, well, neural index bullish, that’s pretty much all strength from here.
Here you get the neural index saying you’re going to get some weakness over the subsequent 48 hours, but clearly you could only go long here with that blue line above the black line. We can look and say, okay, well, you’re predicted highs and lows, what are they doing here? I mean, I see this stuff all the time. It’s a little hard to explain, but you got to understand you’re working with the technology and sometimes it’s going to pick out levels like this. And what happens is, well, it was just the sellers here today.
And then almost immediately the next day, it’s all the buyers and they go straight to that level. And that’s where the market decides to die and pull off a little bit. It pulls back a little bit. You see we get this day again saying, all right, look out for these lower lows potentially coming through, but you want to be long here. Taking profits on longs is clearly the way to go. But you see this type of stuff all the time, where it’s like even when the levels look like, oh, well, it didn’t even fill the ranger.
It’s like, no, look at what’s going on is you get your fill. Some of the volume takes in. But then sure enough, it’s the next day where all that volume comes in, takes you right to the level you’d expect, and then we’re off to the races again. You can even see here, the next trading day, all this volatility coming in. Really great job of picking out where’s the high likely to be at least in the very short-term. You get up there and you come off it.
These are the things that make a big difference when as a trader, yeah, you’re taking some profit at that predicted high, or you’re buying down at the predicted low and getting an exceptional entry on a possibly trending move. When you got a two or 3% cushion, you’ve been able to take some profit. And if this thing continues, well, maybe it turns into something like BUG or some of these markets that have really begun the trend.
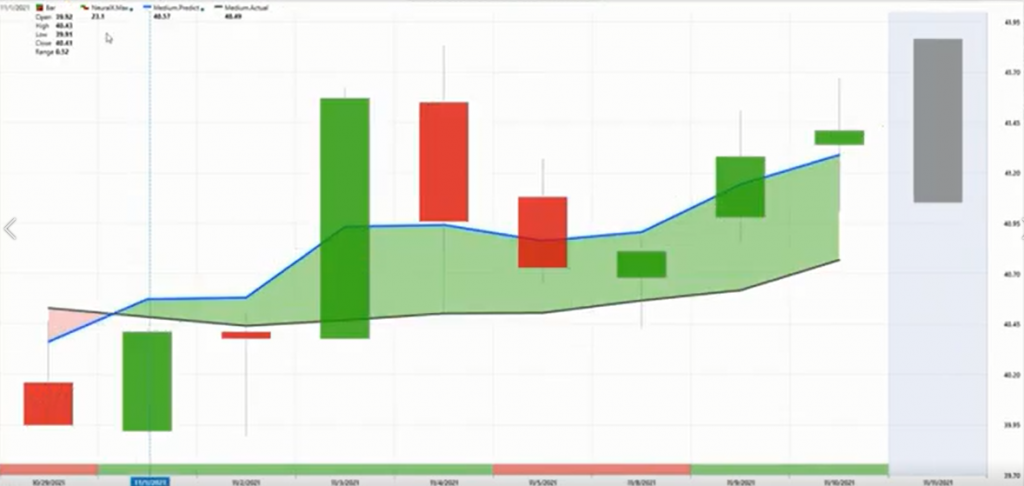
Now, here’s Enerpac.
This has kind of come through in the middle of all this bullishness coming through, but very clearly, blue line crossing above the black line here on October 21st. Setting up that, okay, you only want to go long, take profits on long positions. We get a little bit of a blip here. But again, as an end of day trader looking at these levels, all that really ends up happening is you buy here and the very next trading day, within 48 hours, the market isn’t pushing against you at all and pretty solidly moving in your favor here.
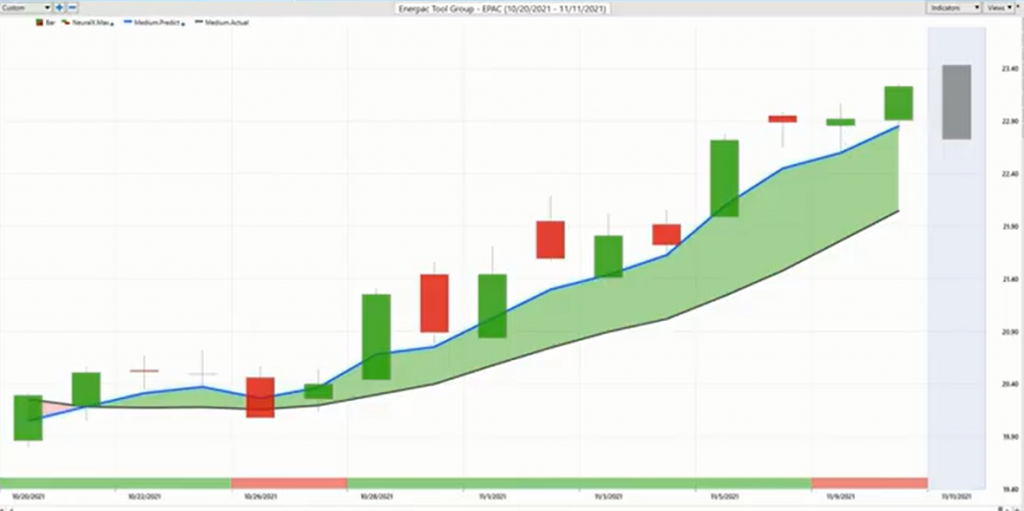
But this gets to actually a point about the technology here. I hope people can sort of understand this and how effective this is even in this day where this is somewhat of an illiquid stock. It has that ability to sort of gap around, but this is where artificial neural networks are exceptional is in taking in that information and adapting and understanding not only what happened here, but what happened in these inter markets and how that’s likely to affect things moving forward.
You see that as the trade progresses, well, look, the blue line is still above the black. You know you only want to be long. Neural index gets bullish very quickly once again, and it’s back off to the races. Or if you’re using these tools, you’re going to get filled at the open and blast off as this thing continues higher. But again, it gets to the broader themes that you can recognize with the help of tools like the Intelliscan, and then going on individual basis and really know where you want to pick your spots, right?
Find those stocks that are strong and look on an intraday level to use those predicted lows, right, where you got those strong market movements happening.
Pfizer Pharmaceutical Group ($PFE)
Here’s shares of Pfizer. In September, we got that move lower in stocks. And again, I encourage you, go back and watch the last couple months of these Hot Stocks Outlooks, because it’s every week to the next week, to the next week and just walking this forward. We had this situation where Pfizer shares sold off, the market sold off.
We actually had a blog post from VantagePoint highlighting that, hey, next time this blue line crosses above the black line in shares of Pfizer, it’s likely going to be an opportunity to come in and manage that trade. And sure enough, well, we see that crossover and let’s bring in those predicted highs and lows, and this is what I really love about even volatility around earnings, which you see is happening here, and the lead up to earnings. But look at this, your crossover comes in here.
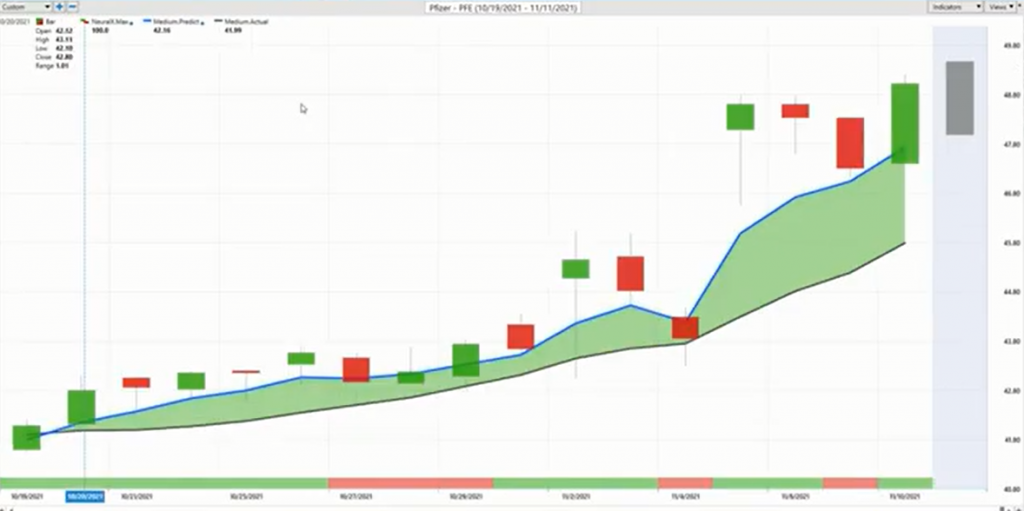
These predicted highs and lows, I mean, just doing a excellent job of letting you know, hey, where do you want to add some? Where do you want to take some off? How do you want to deal with this? Look at this day where you gap out of the area and wow, just conveniently you go all the way down to the predicted low of the day, and then go all the way back up. You get, again, this gappiness around here, but the move is up. The crossover, the trend, everything’s saying, look, the move is to the upside here. Use the predicted lows to get long.
Potentially the predicted highs to take some profit. But then that catalyst of earnings comes in and just drives the market higher. But it’s a heck of a lot easier to deal with volatility when you’re getting into the market with a healthy cushion before that earnings catalyst comes on. If the earnings breaks down or something goes wrong, you can get out of it and maybe take a small loss, breakeven trade, not a big deal. But you don’t want to be just jumping into that the day of earnings, right?
If you can get that cushion and get ahead of it, it can also be extremely beneficial. So about a 16% rally there in just 16 trading days. And again, back to this point of strength, where is that strength? Where are these areas where you’re seeing that narrative play out? And that’s been clearly the place for the past month as far as making money here.
Now, here’s Tenet Healthcare, and another one of these examples where I just want to highlight these really clever little levels that come through.
All the charts look the same because that’s the big narrative happening in the market, that strength that came in in the beginning of October. But let’s take a look at these predicted highs and lows. I’d say this is pretty interesting and pretty compelling. You get a giant gap up there in Tenet Healthcare. Intra day, you come all the way down to the predicted low. I don’t know if you hit it, but you can see you’re getting awfully close there, and then conveniently trading all the way back up. If you had the low here of 64.76, the actual predicted low was 64.77.
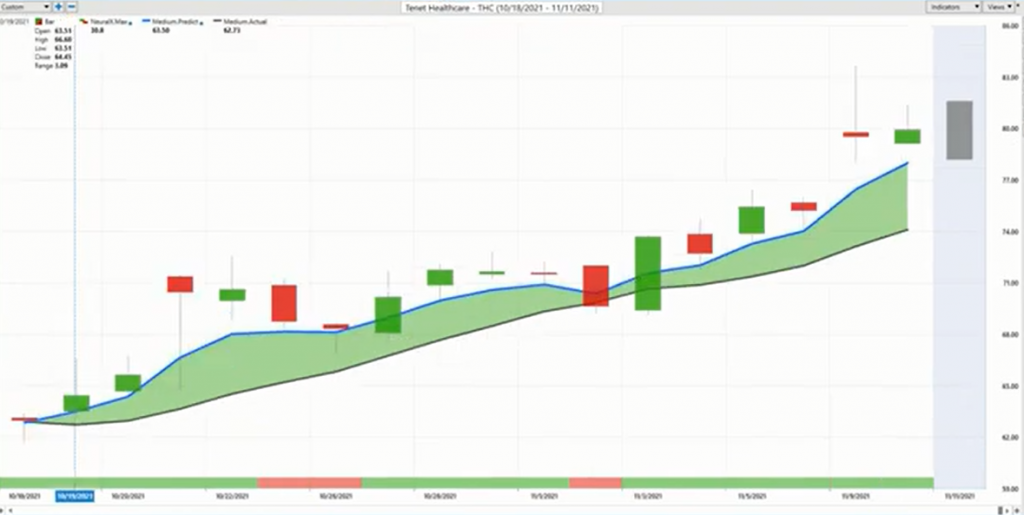
You would be filled. The market would move against you at one penny. There’s probably almost no volume there, and then immediately moving up and continue this trend. And then you see is even with all that volatility, that’s what’s going on behind the scenes here, is it’s looking at these intermarket relationships, it’s looking at what happened in the target market, and then using that information to forecast where these markets are likely to move, both in the day timeframe, 48 hour timeframe, but also the overall trend and the overall market movement as far as the bigger picture here.
About a 24% rally there in shares of Tenet. 500 shares, that would have you at about $7,800. A really nice move. But again, very clear that there’s a lot of strength here. Getting these entries at the pivot, buying call options, or however you want to express that trade, but recognizing these at the pivots become extremely beneficial and effective for a period like this where there’s a lot of things moving up. You can trail your stops, and you’re almost guaranteed to make money even if this thing starts to reverse here.
We’ll leave it there. Once again, this has been our Hot Stocks Outlook for November 12th, 2021. Thank you all for watching. Best of luck. Thanks again and bye for now.


