


Register for a Free Live Training
The Hot Stocks Outlook uses VantagePoint’s market forecasts that are up to 87.4% accurate, demonstrating how traders can improve their timing and direction. In this week’s video, VantagePoint Software reviews forecasts for General Dynamics ($GD), Nasdaq Index ($NQ) , Netflix ($NFLX), American Tower ($AMT), Quest Diagnostics ($DGX), and PBF Energy ($PBF)
Hello again, traders and welcome back to the Hot Stocks Outlook for October 15th, 2021. I hope y’all are having an excellent week out there in the financial markets. And as always, a lot to cover here in today’s outlook. So really a lot of interesting things going on that I really want to cover here, but we’re going to start out here with General Dynamics. It’s a really good example of how all of these predictive tools work really regardless of the markets that you’re trading. And so what we’re going to do is revisit the NASDAQ, which we looked at over the past few weeks.
Netflix and PBF Energy here, we actually looked at last week. So let’s go update those forecasts, but also a couple of different markets that I want to bring in and really explain a lot of what’s going on and how traders can use a lot of these tools to get ahead of these moves.
So starting out here with General Dynamics, what we have is daily price action. And it’s very important to understand that all of these forecasts and predictive indicators that are generated work off of end of day data.
And so you have all of this information before the next trading day actually at 6:00 PM Eastern, the trading day before the markets opened the next morning. And so right up against that daily price action, you’ll see on this chart, we have a black line and also a blue line. Now the black line that you’re seeing there, that is a simple moving average and it’s very common technical indicator. We refer to it as the actual simple moving average, but all that it does and all that really most technical indicators do is look back at previous price action and sort of rework that data. So a 10-day simple moving average, which is what this black line is. It’s going to look back over the previous 10 closes, it adds in together and then divide by 10.
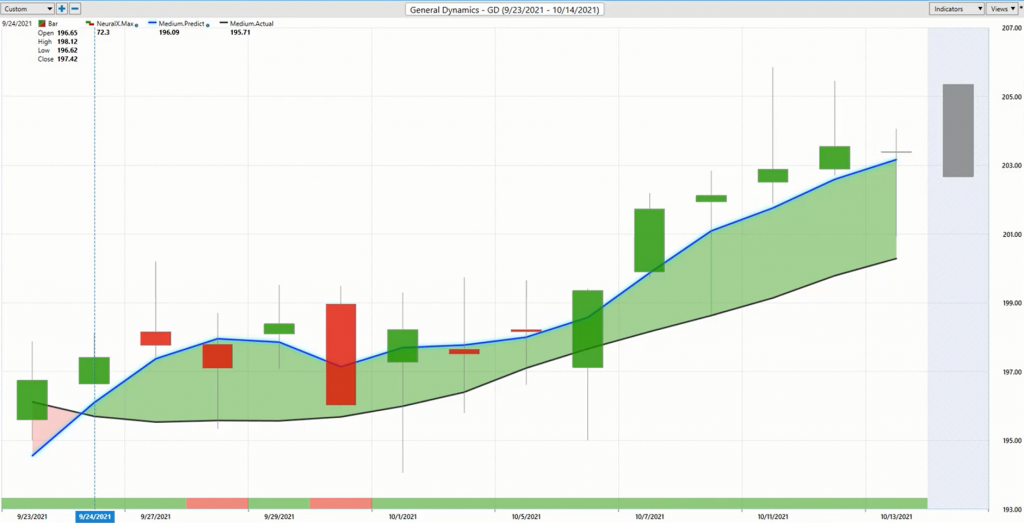
And so it does a good job of smoothing out the existing price action and letting you know where a market has been, but obviously a trader needs to know where is the market likely to move next. And so what we’re able to do is compare that black moving average or that simple moving average of where the market currently is, and we want to compare that to this blue predicted moving average. And for that number, that value to get calculated and plotted against the chart each and every trading day, this is where Vantagepoint’s technology is coming into play.
And so rather than just looking at past price closes of General Dynamics and just plotting along and sort of getting dragged around by the most recent close prices, what Vantagepoint is able to do is look at market relationships that are known to drive and influence the future price of General Dynamics. Now, in most stocks, this’ll be things like the mini S&P, the NASDAQ, these broad indices share some very important market relationships, and we can extract some valuable insights into what’s likely to occur.
But there’s also very subtle relationships happening in the ETFs and that makes sense. Those are broad groups of markets, but also very subtle relationships with individual stocks that an individual trader simply isn’t going to be able to identify. You have to understand it’s not only are there inverse or positively correlated markets, but there’s also leads and lags in relationships within markets that can, again, extract some very significant insight into where things are likely to head in the short-term. But when you continue this on, you think about, “Okay, well, what global currencies, interest rates?”
If you’re trying to trade energy stocks like we’ve highlighted over the past few weeks, well, those are highly driven by crude oil, commodities, natural gas prices. And so what this is able to do is understand those unique market relationships to the target market that you’re trading at that time, and actually generate future price predictions of where price is expected to go. And it’s that predictive data of price that’s actually used and built-in to calculate these indicators. So rather than having a tool that just looks back at the past, you have a forward-looking predictive tool.
Now in the case of the predicted moving average, it’s very simple. As long as that blue line moves above the black line, you expect average prices or this really being this expectation of average prices to keep moving higher. But if we continue on with that technology and say, “Okay, well, we can use it to really improve the overall trend direction with our predicted moving averages. Well, how might we use it for very short-term price action?” And this is where tools like the Vantagepoint Predicted Neural Index come into play.
So this changes every single trading day. Well, it doesn’t change. It can remain green or remain red, but every single day you get a new calculation. And what those neural networks are doing are forecasting short-term strength, but tuned to just look ahead 48 hours into the future. And this is sort of a big key to all this is these indicators in artificial intelligence, you need to instruct it. What are you trying to get at? What is the end goal? Well for the neural index, that’s a 48-hour predictive outlook. And it gets that right essentially on average of all markets about 80-plus percent of the time. About four to five times, it’s going to get that right, but you’re also provided intraday predicted high and predicted low levels.
So again, you can think of, Well, what’s the problem here?” Well, we’re trying to figure out intraday, what’s the low that this market’s likely to hit or what’s the high. And that’s where all of this technology is working on all these different problems as a trader of needing to figure out, “Well, where should I be buying? What markets are reversing trend?” But more importantly, how to manage positions as time goes forward. And this is really what I want to get at because Vantagepoint is such a good, predictive and adaptive technology. And you see that every day, you have these predicted levels before the trading day occurs.
So you can see that we have a predicted range here, yesterday we hit that and you close inside the range here. The previous days you were hitting these predicted highs and moving lower, but you see how effective this is as a forecasting tool to let you know that, “Okay, long-term trend is up. I may want to be buying down at these predicted lows and holding for the longer term. If I’m shorter-term, I’m taking profit up at these predicted highs. Maybe managing the position.” Buying at these predicted lows, taking profit and using those profits to hold out for the longer-term as long as that blue line remains above the black line.
Now there’s a lot of different ways that a trader may want to manage this, but the real key is having this tool that’s really going to allow you to say, “Okay, well, I see how things are shifting.” Here General Dynamics just over the past 12 days, the market’s only moved up about 3% or so, but you’ve been buying all way at the very bottom of these ranges and potentially taking these big chunks of market out as this market starts to move higher. Now, this is what I want to get across though is that we can recognize how things are shifting broadly throughout the marketplace and therefore how we might want to set up our portfolio.
So here’s the NASDAQ. And now we talked about this crossover moving to the downside and Facebook and things starting to look fairly weak, but we can see that we actually have a crossover to the bullish side here recently, but there’s a lot of volatility here. So you see the neural index getting bearish. We have these lower lows coming through, but what are we seeing currently at least in this most recent price action is strength coming through the NASDAQ and certain stocks recovering. And so this has been extremely helpful when you’re trying to set up that portfolio. A.
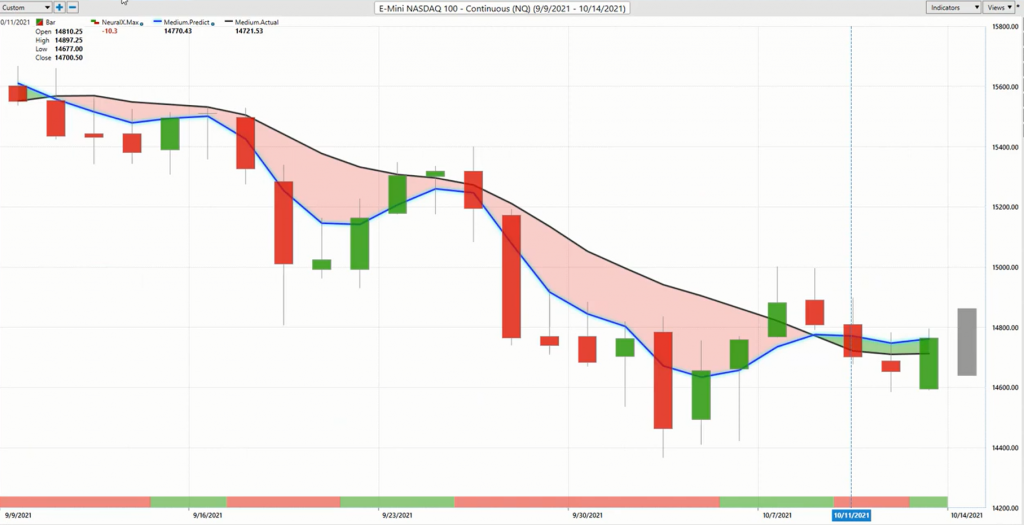
And what its really highlighted is that there’s really been some recent opportunities, in my opinion, in individual names to go ahead and get long. You can see that if you’re trading the index here, you still have that good guidance to help you, but clearly things have shifted here and not just today. This is several days ago. We’ve started to see a lot more fresh crossovers come through the use of the IntelliScan feature. So we actually have these tools that can really highlight on the night of these fresh crossovers and shifts and get these important things right on your radar right when they happen so you can recognize how things are shifting and changing in the market.
Now, last week, we talked about how, yes, things still looked weak on the index level going into that.
That was made an entire week ago, but there were some areas where certainly the software is indicating that you can go ahead and get long, but I just want to highlight here the accuracy of the forecast over the past week here in Netflix. And so you can see here that after this trading day, the neural index goes bearish. And again, what that’s highlighting is just short-term weakness over the next 48 hours.
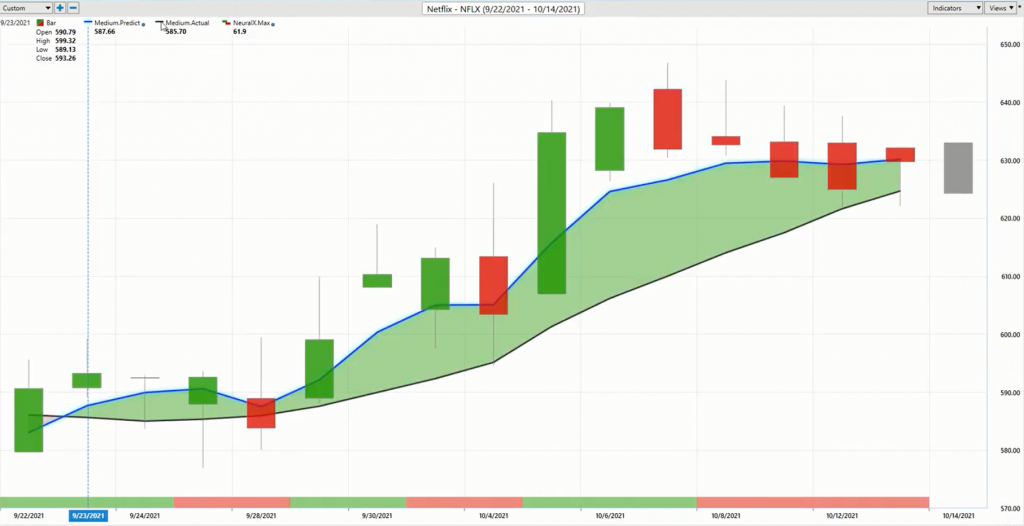
But as long as that blue line remains above the black line, the overall trend is up. And every single trading day, you’ve got a new predicted high and a predicted low range. So from last week, you get the market closes here and look at this guidance every single day saying expect this to be the high, this to be the low, this to be the high, this to be the low, this the high, this the low, this the high. But you’re only being long in this market. So all you’re doing is potentially taking profit and proving your position by buying down at these levels. And we’ve seen the NASDAQ in some of these broader markets improve and stocks do fairly well.
I know we’re at least hitting, again, the predicted high. So that trade management even if you run the sideways, you’re still able to pull some money out of the market, recognize as things are shifting like the NASDAQ or some of these other markets, this comes to the downside, well, you’ll know what to do. And so when you see some of this information going on in the indexes, it can inform some of your other trading.
So in American Rower and Quest Diagnostics, here are some clear markets that are in downtrends.
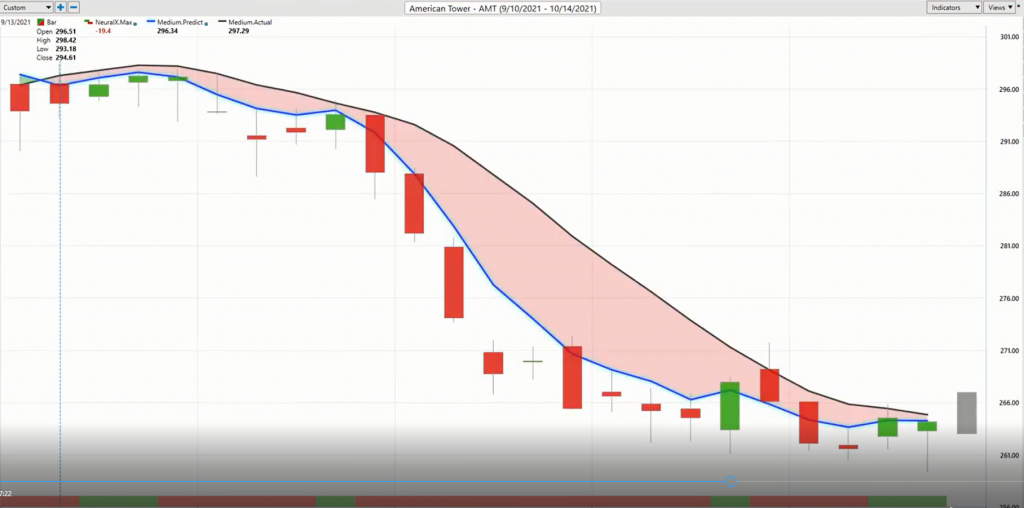
But the things that I just like to highlight is you see that the software here is telling you look for some short-term strength. We haven’t gotten that crossover yet, but you do see a lot of these warning signs coming through that says, “Okay, well, there’s been some areas where we can short and take profits on those shorts.” And certainly that’s been the right thing to do, but we get this information from other markets that’s letting us know that, “Hey, things are shifting.” And if they’re shifting at the index level, well, we certainly might want to be a little bit more cautious and expect some higher prices at the very least, even if we want to remain short until that crossover comes to the bullish side there.
But again, you see just the accuracy of the short-term forecasts and broadly here. Again, to let you know that, look, it’s not all weak out there. There’s certainly some strength coming in here and opening up some tremendous opportunities to go ahead and get long. And that’s where things like the IntelliScan can really guide you and recognize these shifts that are coming to the upside and where he might want to stake out those positions, put in limit orders and buy on these predicted lows and these levels coming through.
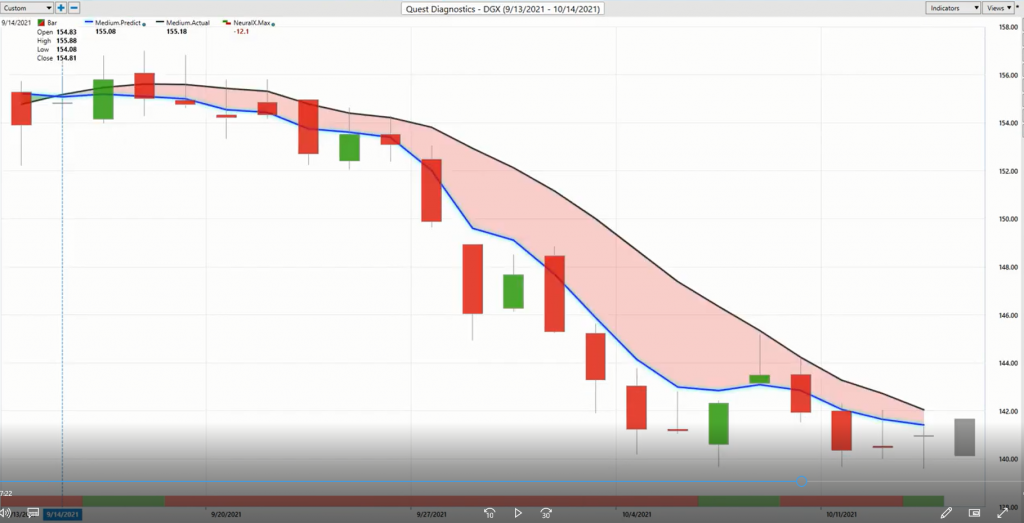
Quest Diagnostics, very similar sort of situation. And again, just highlighting that there’s these ways that you can use this sort of information from the index is even understand that at the very least expect some higher prices here. There’s strength coming in, but clearly a really nice place to manage some weakness over this past couple of weeks. And then you see how many markets are going to match the NASDAQ and the S&P and things going lower. What’s really easy to figure out which markets are really following that correlation pretty closely because they all turn down at about the same period and at midpoint in September there. So you see about a 10% decline in shares of Quest here.
And lastly here, here’s PBF Energy. We looked at this last week and it’s the same point I’m covering here with Netflix where Netflix hasn’t broken out, it just runs sideways. But you have those tools to help you even pull money out of those periods even if nothing’s happening in that particular market that you’re trading. Well, here we come to PBF Energy. And again, you’ve got this last week where we’ve seen a lot of strength om energies, a little bit of volatility in crude oil contracts.
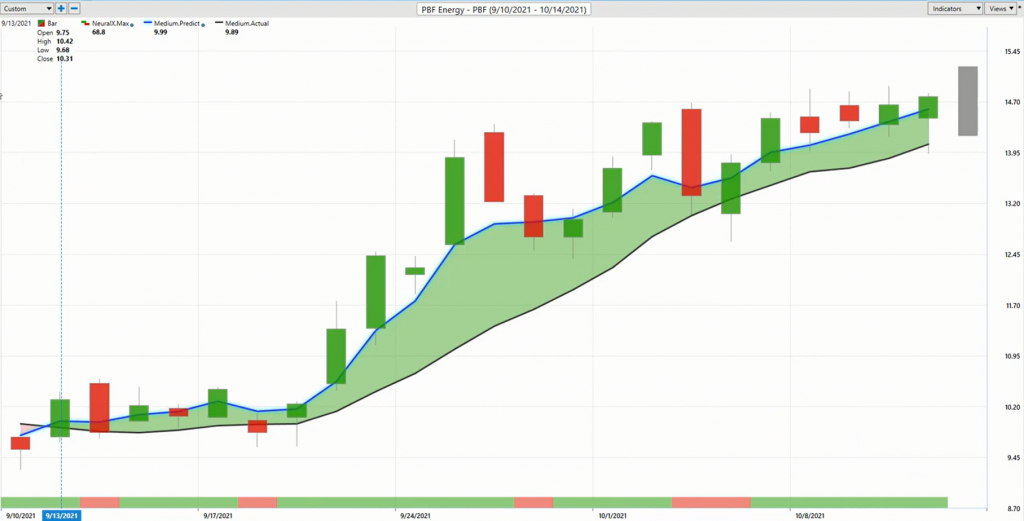
But in this market specifically, it’s telling you, “Look, over the past week, you want to be a buyer down at these levels.” And seeing things again bounce and move to the upside as that overall trend remains very bullish here. And so again, it makes it clear to figure these things out like, “Okay, there’s weakness coming into the NASDAQ. There’s strength coming in energies. Oh, this has shifted over here in the NASDAQ.” And that can direct you to certain stocks and even whether it be big shifts and trend changes in the market, or just this short-term understanding that, “Look, the environment shifted. You can now exploit those bullish opportunities and take those profits as we see this bout of strength come in.”
So we’ll just go ahead and leave it there. Just trying to highlight a lot of these different opportunities and how we’ve walked forward through this, but how it’s really the combination of these tools. If you’re trading stocks, certainly the forecast from the indexes can give you that valuable insight into how things are shifting and which broad areas like energies we’ve seen here. A lot of these stocks doubling in a very short period of time, just about a month on the calendar there.
So some really great things opening up. And again, seeing more recently it looks like some new opportunities again opening up to the upside, but you want to be able to manage those over the next month, two months of trading that we might see here. So once again, this has been our Hot Stocks Outlook for October 15th, 2021. Thank you all for watching, best of luck and bye for now.


