Register for a Free Live Training
The Hot Stocks Outlook uses VantagePoint’s market forecasts that are up to 87.4% accurate, demonstrating how traders can improve their timing and direction. In this week’s video, VantagePoint Software reviews forecasts for Ford ($F), Hasbro ($HAS), NVIDIA ($NVDA), Disney ($DIS) and Lululemon Athletica ($LULU)
Hello again, traders, and welcome back to the Hot Stocks Outlook for November 11th, 2022. Hope you all are having an excellent week out there in the financial markets. We’ve certainly had an exciting week and a lot to go over. So we’ll go ahead. We’ll start here with NVIDIA, Lululemon, Hasbro. We’ve actually looked at these several times over the past few weeks. Good to go ahead and update those forecasts and understand how these tools can really help you get ahead a lot of these exciting moves. So we’ll go ahead and move on to Ford. And lastly, we’ll end on Walt Disney. But if you haven’t already, make sure you go ahead and click on the link below in the description and get a live demonstration to learn more of the specifics about how this technology is going to help you make better trading decisions day in and day out when participating in the marketplace.
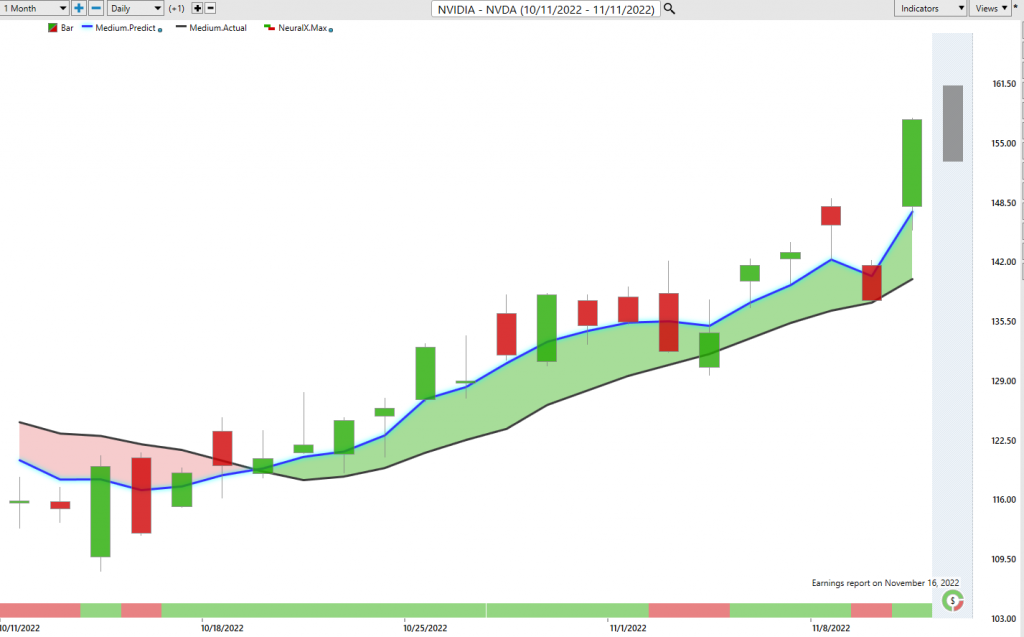
So we’ll start out here with shares of NVIDIA, and as always, what we have here is daily price actions. Each one of these candles represents a full and complete trading day, but right up against all that price data, what you’ll notice is there is a blue line and also a black line. Now what you’re seeing there with actually that black line on the chart is that is a simple moving average. It’s a very common technical indicator, and what it does in this case is it really acts as a baseline. So it looks back at the previous 10 closes, it’ll add those all together and divide by 10, and that acts to smooth out the price action, let us know where market prices have already been over a given period of time. But of course traders need to be in front of that next move, right? Getting those positions on before all that volatility hits the market.
And so what we’re able to do is actually compare that blue line and black line. And so whenever that blue line crosses above the black line, what that is to get that number and that calculation and then therefore plotted against the chart for the trader each and every evening, this is where VantagePoint’s technology is performing what’s called intermarket analysis, and it’s using that technology of artificial neural networks to do that. So what that means to produce what we call this predicted moving average, is it’s looking at markets that are known to drive an influence, the future share price of NVIDIA. So we can think of NVIDIA as the target market and there’s all of these relationships, whether they be things like the broader indices like the Nasdaq, whether they be things like the value of the dollar index, which has been huge this week, huge moves in the dollar and you’re seeing stocks go much, much higher.
We’ve got things like the commodity markets, like oil and ETF groups and all the way down to maybe even individual markets that share positive or inverse or leading or lagging relationships, and it understands what are those important relationships and then it takes all that information, does what neural networks do well and create accurate predictions of where price is headed next. So that’s what this technology does well, taking huge amounts of data that a human wouldn’t be able to process, understand how those relationships are subtly affecting things, and then produce a roadmap, a highly accurate forecast through the use of these separate predictive indicators that we cover here. So whenever that blue line crosses above the black line, you can think of it as a trend forecast, right? It’s letting you know that the overall average prices are starting to move higher, and this is where tools like the IntelliScan feature will actually alert you to when all of this happens.
So it’s not just seeing this in NVIDIA, it’s seeing it in many areas of the marketplace and understanding the significance of that and why you might want to get ahead of it. So if we go ahead and continue on here, if you look at the very bottom of the chart, you’ll see you have this bar that goes from green to red, back to green. And so if those neural networks are working to produce this highly accurate predicted moving average to let you know when there’s trend shifts in the market, this indicator at the bottom, the predicted neural index is tuned to solve a different problem, short term, strength or weakness just over the next 48 hours. So that’s really important for a trader who may have a, let’s say, long position on to understand, “Hey, is there going to be weakness over the next couple of trading days? Well, maybe I should be a little bit prepared for that.”
It doesn’t mean you have to get out of the market completely, but certainly you don’t want tight stops and all these things that are just going to be a problem. So you see here how the neural index in certain conditions, we go bearish here and we actually get a gap down. So how I like to think of this is it’s just saying that there’s essentially some lower lows over the next 48 hours, but as long as the blue lines above the black line, the overall trend is still up. And so we’ve come back to NVIDIA over and over again, but now we get this big pop. And what you want to be able to do is understand that back here is where you really want to start that position, and once that position is on, then we can use other VantagePoint indicators, things like the even predicted high and low, which now we’re moving to the last set of indicators here have a predicted range that’s provided for the trader before each and every trading day.
So imagine having the overall trend direction, a very accurate prediction of short term strength or weakness in the market, and then even having intraday levels with which to strategize from. And so we can see here with shares of NVIDIA, we got a lot of volatility picking up around here around CPI and that’s where again, you’ll see things shake around. But notice how this works early on in the trade extremely effectively as far as where should you be looking to scoop up shares of NVIDIA? And even if you’re a shorter term trader, where might you be looking to take some short term profits on shares of NVIDIA? But clearly here the overall trend is up and that’s what we’re seeing, right? And a lot of it has to do with dollar, but that’s what’s understood is as dollars weaken, it skews these forecasts to help you identify where’s the strength in the marketplace.
So really tremendous move here in NVIDIA, but a lot of these charts look the same. And that gets to this point I’m making here of it’s those big global intermarket that are really driving the bulk of the market and you really want to understand as far as that portfolio where the safest places to take those long positions, and maybe there might be some areas to even take some short positions to balance that out. So we can move forward here.
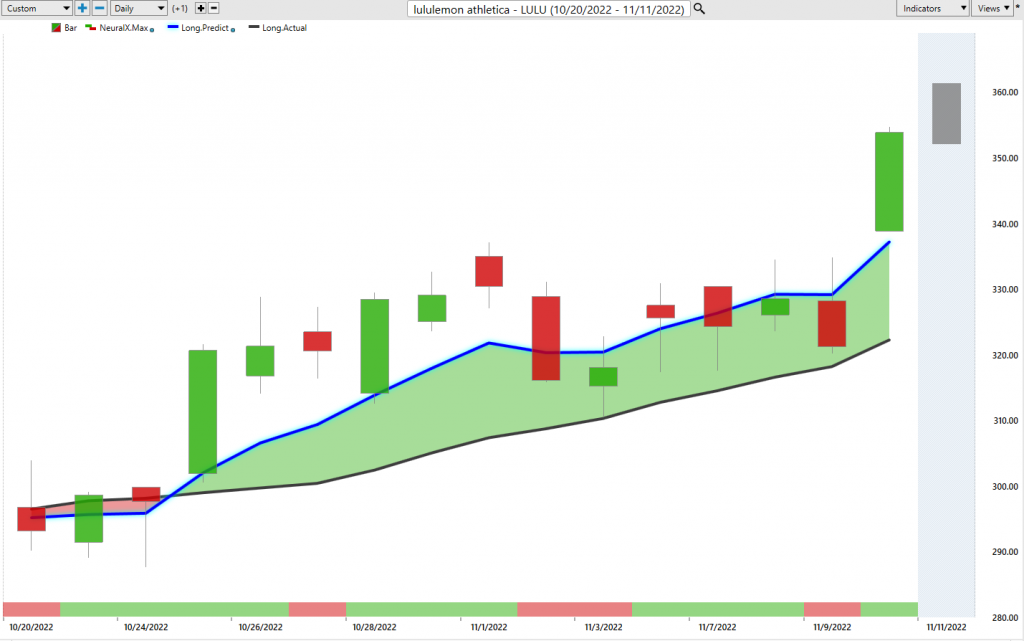
We’ve got Lululemon. Now if you go back and watch the previous hot stocks outlooks especially go back two or three months, we’re very bearish. I’m joking that it’s the not stocks outlook because there’s nothing to buy. And then things shift and we start bringing in bullish opportunities and stepping away from bearish things and seeing how mixed the market is. Finding sectors that are doing well like oil, but now we’re seeing more of the traditional marketplace turn up. So here’s Lululemon, we see have this crossover to the upside and just over the past week of forecast from where we took left off from last week, where we can see how this gets updated for traders.
And so you have this roadmap that says, “Okay, we know Lulu is strong. Okay, going into the week.” Where should we be looking to scoop up value here? And we talk about some of these ranges where you hit that previous day and volatility shakes around, but this is around all this volatility going into CPI, but clearly you want to get these positions on back here, right? Start this campaign of taking some profits on this market so you can deal with that volatility and hold onto the trend as things get really exciting here. So here again shares of Lulu up 19% in the past 16 trading days, obviously a lot of that coming in after this huge move we’ve had this week.
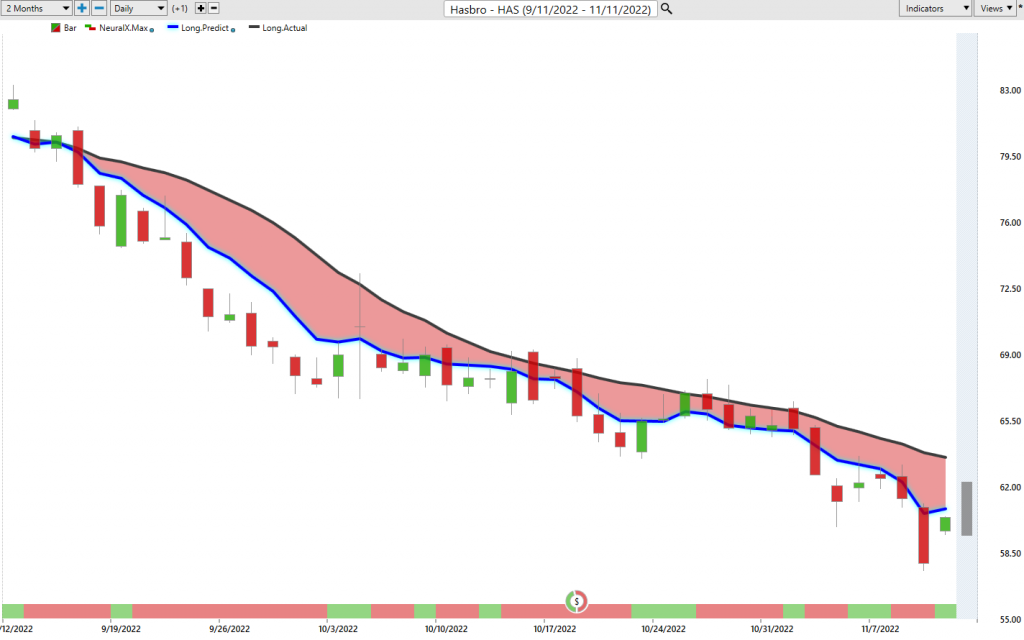
Now here we’ve got shares of Hasbro, and we keep bringing this in actually highlighting a stock that is persistently weak, and how do we know it’s persistently weak? Well, it’s a very different picture as far as those short-term forecasts, right? So we get this crossover to the downside, a lot of great opportunities to establish that short position, and maybe it compliments some of these other things that you’re bringing into the portfolio. That’s what you have as a trader really need to decide, but when it comes to the tools that you’re making to make those decisions, again, we got another week here of Hasbro up at these predicted highs are clearly going to stand out as better levels to short, and you see that throughout the week here. It’s one of the few stocks that’s down for the week and still considerably down for the week, right? So not doing good over there at Hasbro.
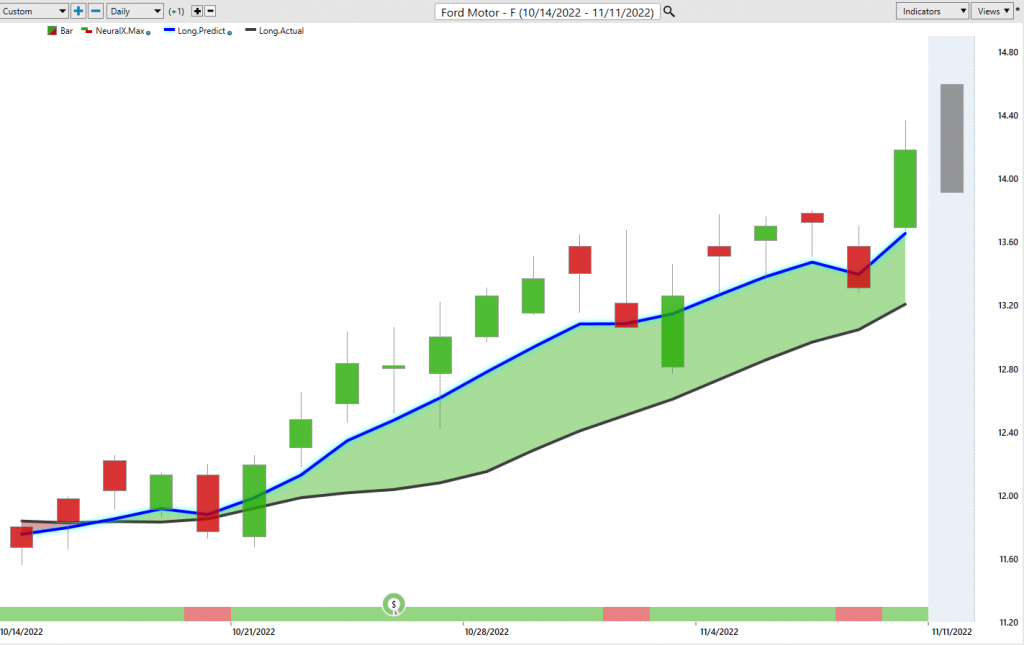
Now here’s, we’ve got shares of Ford and this looking a lot more like the traditional market, but a good example where we can look at these short term predictive forecasts. So you see that if you’re running your IntelliScan and you’ve got a process set up, you’re going to see these things shift to the upside, not everything shift to the upside, right? But certain places where you’re going to understand that there’s more opportunity as far as bullishness here. So you see we get Ford Motor this cross over the upside, and now we can look at those predictive forecasts. And this is what I want to highlight is this is very short term, and so what it will pick up on is like I meant these lower lows over the next 48 hours.
And so that’s how I want to really think about things. You see again here at neural index bearish, you get this gap down, but the overall trend is up and that’s what you really need to understand. We get a lot of volatility here around this trading day, but again, you go into the next day, you’re gaping up and accelerating to the bullish side here. Trend is up in these markets, right? So there’s no way you can really look to short them, but they may go ahead and maybe compliment some of these other shorts that have been in the portfolio. But what we’re doing here with trading is you’re walking forward through time, identifying new opportunities and understanding where are the best places to go ahead and stake out some of these positions where it’s more likely to make money. So here’s Ford over the past week, again, we can look at these short term forecasts here to help you see. You want to be a buyer, only belong, take profits on long days like this. That gap downs were beautiful there.
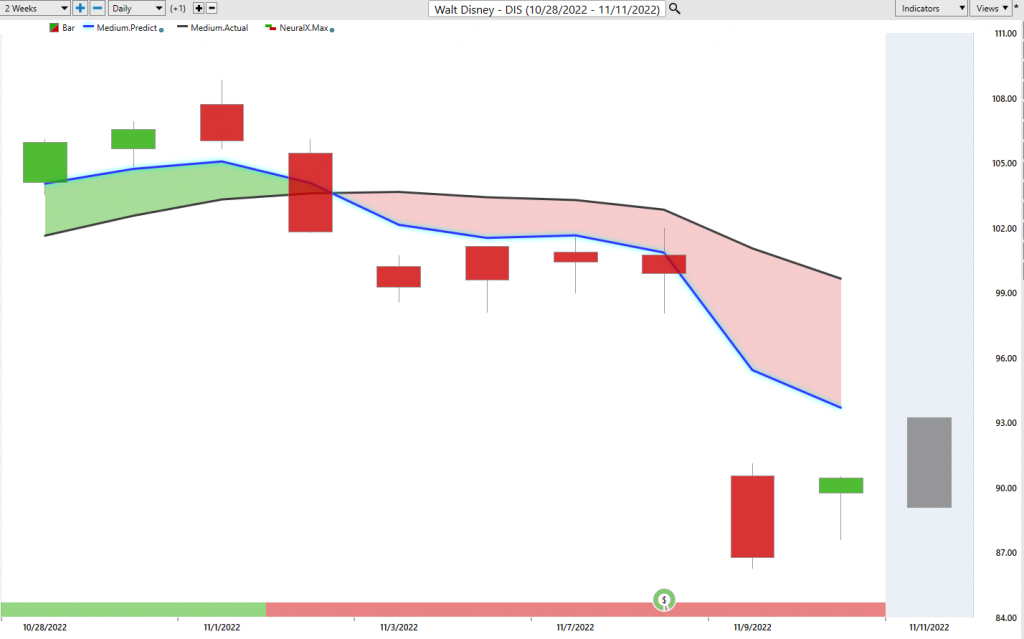
But here’s Walt Disney, right? So some stocks you don’t want be messing around with this week. So here’s Walt Disney. Again, the past week of trading here. Well, what’s been the idea? Well short take profits on shorts, where might you want to do that up towards predicted highs? It’s a gap moving around a little bit, but obviously not looking very bullish. Neural index still bullish, and so the markets may bounce whatnot. But like I said, there are clear places where you do not want to be pushing your luck on long positions, but that’s great about this when you make money on the short side because this period that we’ve had, it makes it easier to go ahead and start balancing things out where you see those forecasts lining up.
So we’ll go ahead and leave it there. Again, just a movement lower here over the past week here in shares of Disney, 11% drop there over the past five trading days. So we’ll go ahead and wrap it up here. Once again, no, this has been the Hot Stocks Outlook for November 11th, 2022. Thank you all for watching. Best of luck. Make sure you sign up for that live demonstration, and have a great week.