Register for a Free Live Training
The Hot Stocks Outlook uses VantagePoint’s market forecasts that are up to 87.4% accurate, demonstrating how traders can improve their timing and direction. In this week’s video, VantagePoint Software reviews forecasts for SPDR SPY($SPY), Google ($GOOGL), Pulte Homes ($PHM), COPART ($CPRT), NVIDIA($NVDA), Eli Lilly ($LLY), Equity Residential ($EQR), PFIZER ($PFE), West Pharmaceutical Services ($WST)
SPDR SPY ETF ($SPY
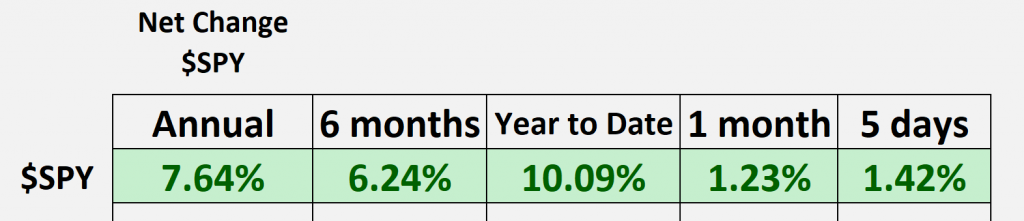
Hello again traders, and welcome back to the Hot Stocks Outlook for May 19th, 2023. Hope y’all are having a excellent week out there in the financial markets, and we have plenty to cover in this week’s Hot Stocks Outlook. So if you haven’t already, make sure you go ahead and click on the link in the description below. You can get a live demonstration and learn more of the specifics about how this technology can help you make better trading decisions day in and day out in the marketplace. So as we typically do, before we jump into the most recent AI forecast, let’s take a look at the broader markets over the past year via the SPY ETFs, the S&P 500. Now we’ve highlighted over the past 12 month rolling period, we’re starting to see things perk up. We’re actually up about 8%, but really the story’s been at the beginning of the year.
That’s where we really started to see shares do extremely well. And so we had this sideways period for a while here, and most recently, over the past couple days, Wednesday and Thursday this week, we had a really nice rally in shares. And what we want to do here is, highlight, “Well, how can we get ahead and be positioned in those markets that are ready to benefit as we see the SPY and the broader markets do fairly well here.” So we’re going to go ahead and review some markets that we’ve looked at over the past few weeks, but get into some of these new opportunities, as we see markets starting to turn and highlight how traders can recognize those markets starting to turn, using features like VantagePoint and Telescan here.
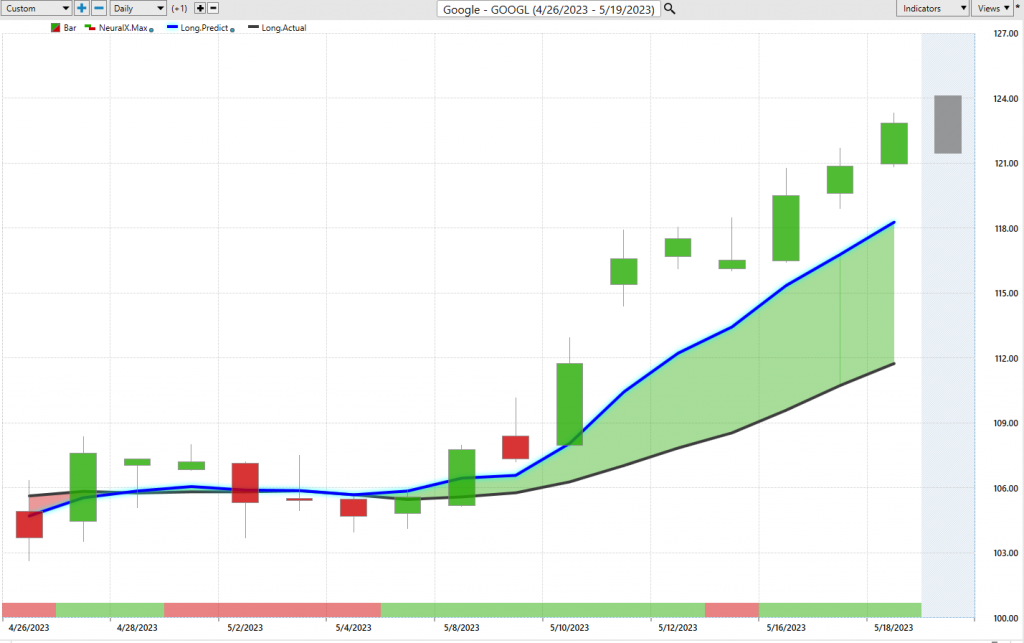
So what we’re going to do is, start out here with shares of Google, obviously a very popular company here and what we have here is daily price action. So each one of these candles represents a full and complete trading day, and it’s right up against that price data that what you’re going to see is, there’s a black line value created and also a blue line value. Now, the black line value that you’re seeing there, that’s a simple moving average. So this is a very common technical indicator, in this case, it’ll just look back at the previous closes, add those all together and divide by that number. And so what that does for us as traders is, smooth out the existing price action, kind of let us know where market prices have been over a given period of time. But traders need to be ahead of that next move in the marketplace. And so what we want to do is compare what we might call, that lagging moving average, to this proprietary predicted moving average.
Essentially, a forward-looking price prediction of where average prices are expected to move. But for that value to get plotted and calculated for the trader every evening, this is where the technology of artificial neural networks come into play and they’re doing what you would call, intermarket analysis. Now, what that means is, specifically for shares of Google, there are known markets that are known to drive and influence the future share price of Google stock. And so this is going to be obvious things like, well, the value of the NASDAQ or the S&P 500, right? So we can get some really important price clues out of those indices as to the future value of Google shares. But it’s able to look at very subtle relationships, where they be in individual stocks or broader ETF groups that again, offer these extremely important price clues. Sometimes they’re leading relationships, sometimes they may be lagging, sometimes they may be positive or inverse correlations.
And that’s what neural networks are able to do, is look at those intertwining relationships and then generate highly accurate predictions based off of that information. And so this goes all the way down to things like, the value of the dollar index, value of crude oil prices or gold or interest rates. And so it’s taking this global approach, looking at all of these competing relationships and then generating extremely accurate price predictions. And it’s these technology driven price predictions that are then used to construct these series of predictive indicators that we look at each and every day. So whenever that blue line in this case, that predictive indicator cost crosses above the black line or that lagging moving average, you’d expect average prices to start moving higher. So we can see that, since that blue line moved above the black line, shares of google.com have moved up about 16% over the past 15 trading days.
But that’s not the entirety of these tools, right? We can look at different timeframes and really tune these indicators to solve different problems for us, utilizing that artificial intelligence technology, to offer these very accurate price predictions. So when we come to the very bottom of the chart, you see this bar that goes from green to red, this is another one of these neural network driven indicators, but it’s tuned to solve a different problem. And in this case, it’s just looking ahead 48 hours. So short-term strength or weakness over that next 48 hour window and it gets this right with a very high level of accuracy, upwards of 86%, 87%. So you can think of that as on average, getting it right, essentially about four out of five times, as far as short-term strength or weakness, just over that 48 hour period.
And lastly, really to fine tune all of this, you’re given a predicted high and a predicted low. So literally, an intraday prediction of where the market range is expected to trade. And so once we recognize that, look, we’ve got some bullishness in the market here. We see Google is in an uptrend, but you’ll notice that when that neural index goes red, you actually get some subsequent sideways price action. But notice how that predictive indicator, that predicted blue line moves above the actual black line, you’re getting that separation and that’s where we see momentum really kick into the marketplace. And then again, where are you going to benefit from that strength we’ve seen in the SPY? Well Google, you see a lot of separation between that blue and the black line, a lot of strength from that neural index and seeing that benefit as shares improve.
So here we see again, that 15% rally over a very short period of time, but let’s take this same approach and understand, “Okay, well, we’ve had about a month of the market and the SPY running sideways, well, where are those areas of strength and conversely, maybe some weakness to hedge the portfolio?”
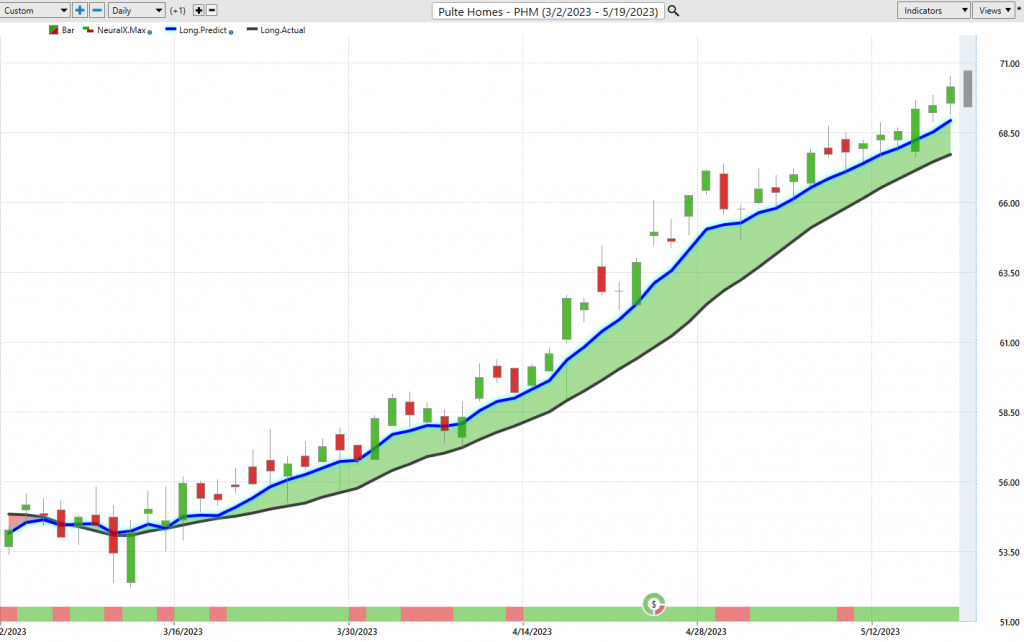
Well, here’s Pulte Homes, and again, since that blue line crosses above the black line, we can see these home builder socks have been in a really nice rally. Here, shares are up about 28% over the past 47 trading days, 500 shares has you up about $7,700.
But over the past couple of weeks, maybe you want to do some short-term trading, maybe you’re trying to identify, “Hey, where are the stronger areas in the marketplace to participate?” And so I can actually zoom in pretty quickly here so we can take a look at some of these shorter term tools. Let’s look at these predicted highs and lows.
And so you got to remember, you’re provided these levels before each and every trading day occurs. So what we’ll get is, the trading range of today, we’ll fill in, the predictions will stay where they are, but we’ll get an actual candle to fill in the data. And so you see how when you recognize, “Hey, Google’s in an uptrend. Hey, Pulte’s and Copart’s in an uptrend.” Well, then you can fine tune this and say, “Okay, well, I know I want to be bullish over the next couple of trading days, where should I be looking to stake out a position?”
And you see here that, over the past five trading days, utilizing tools like VantagePoint’s predicted lows, well, that’s literally, the bottom as far as Pulte Homes this week. And you’ve had about a 3.5% rally from that gap down to the predicted low and then going, and now we’re about 3.5% over three trading days. Again, $1,100 move just on those 500 shares, just over the past week here. So this is why this is critical to think about, “Okay, well, what is my trading strategy? What am I looking for? If I’m short-term, where is that strength in the marketplace?” And this is what we do each week is, we come in and say, “Okay, where’s the strength in the marketplace and where are these areas where you want to watch out for problems?”
And so things like Eli Lilly, really nice uptrend, we can look at those predictive indicators, things like Pfizer, not so great, right?
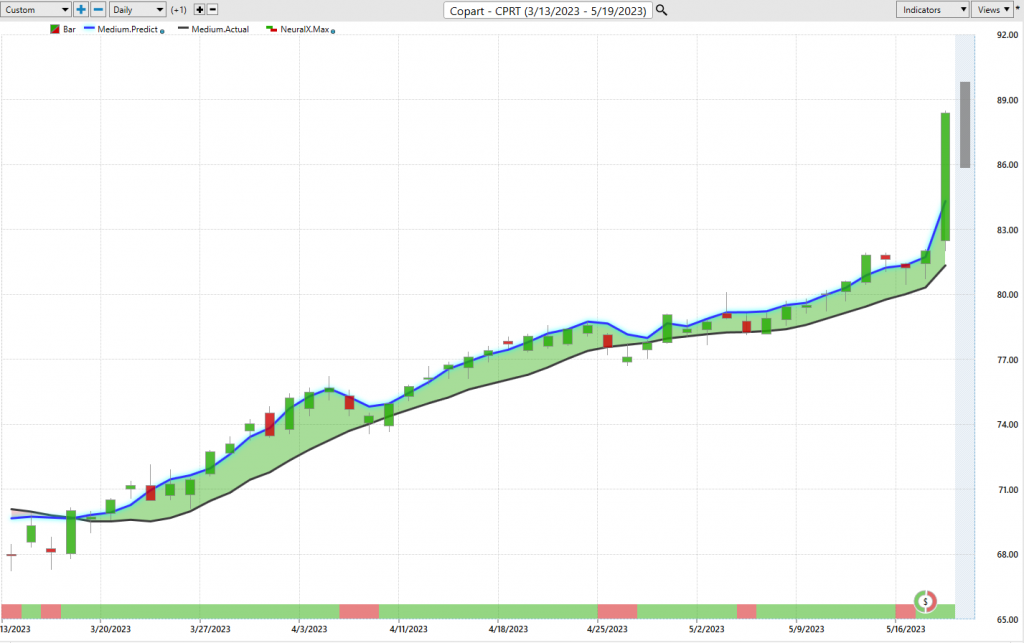
Here’s shares of Copart, exact same approach, where we’ve had a lot of strength in many of these markets. So we looked at Copart even last week and so we want to bring this through with the same approach that says, “Okay, well when it comes to that fine tuning of, where do I want to buy, where do I want to sell?” And we look at overall the week here in shares of Copart. Well, clearly we’re in an uptrend, that’s not disputed. Neural index, very bullish here. But look, as far as these predicted lows, you’re pretty much getting that level hit on Tuesday afternoon or Tuesday morning and since that point, you actually have had earnings come through, but we’ve been talking about this for several weeks now.
And so you see now, 10% just over the past few trading days. But what about earlier in the rally? Well buy down at these predicted lows, buy down at these predicted lows, and that gives you plenty of cushion to take on that earnings risk and potentially make a lot of money as markets improve and certain areas do well. If earnings don’t do well, well, you can get stopped out at breakeven if you want to take on all that volatility potentially, but you’re still getting excellent entries to participate.
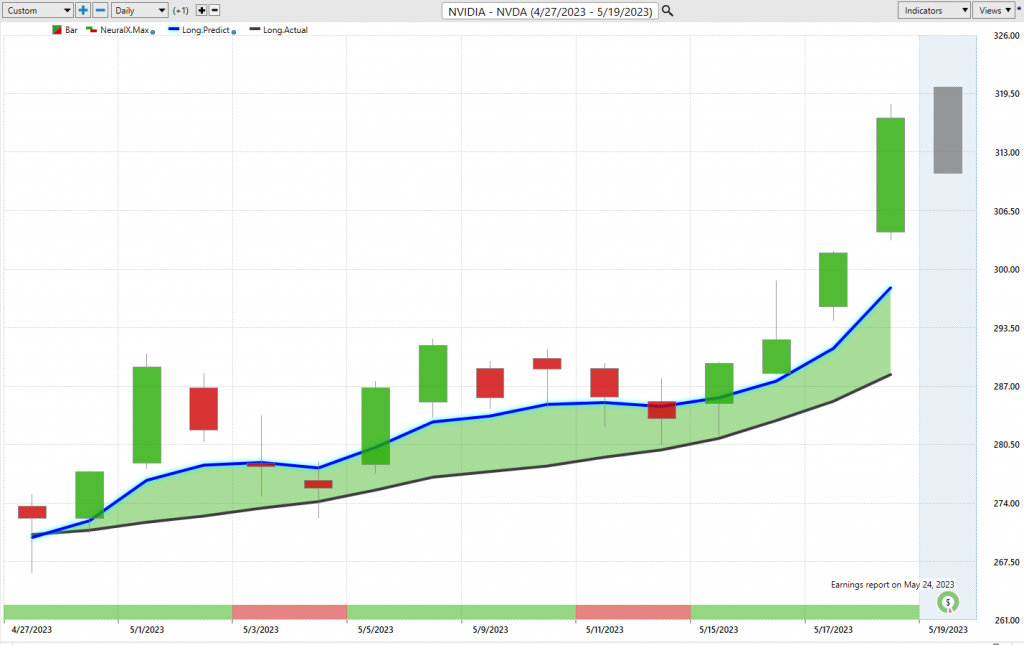
So here’s shares of Nvidia, just like Google, one of these more bullish markets, where you see this blue line well above the black line, you’ll see you get these little spats where the neural index goes bearish, and you get sideways price action over a very short period of time. But once that neural index gets bullish again, then you see that advancement take place and all that volatility kick into the marketplace.
So here in shares of Nvidia, again, really nice place to be as we see the SPY and the broader markets do well this week, midweek here, about a 15% rally over 15 trading days.
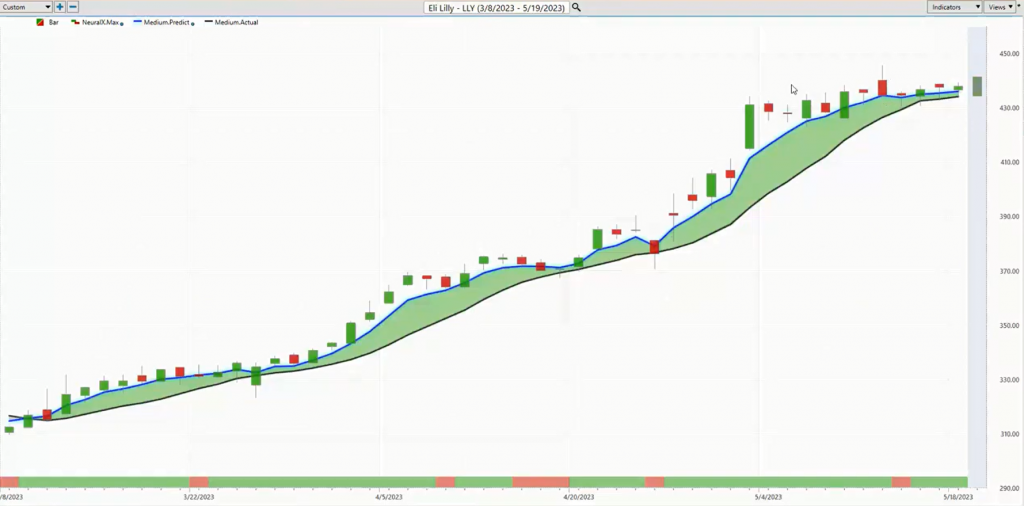
Now, here’s shares of Eli Lilly, we looked at last week. I really just want to quickly go through this and say, “Okay, well, as far as the last five trading days from where the forecast last broke off, predicted low, predicted low, movement towards predicted highs.” Now, the market isn’t screeching up this week, but you’ve already had some ample opportunity to buy at the predicted lows, target predicted highs, and do some trading and get the better part of these shorter term moves. But a 1% move as market dips lower, runs sideways, hit the predicted low, comes back lower, and again, you see some of that persisted strength there in shares of Eli Lilly.
So now, I want to transition to where are some of the weakness is in the market.
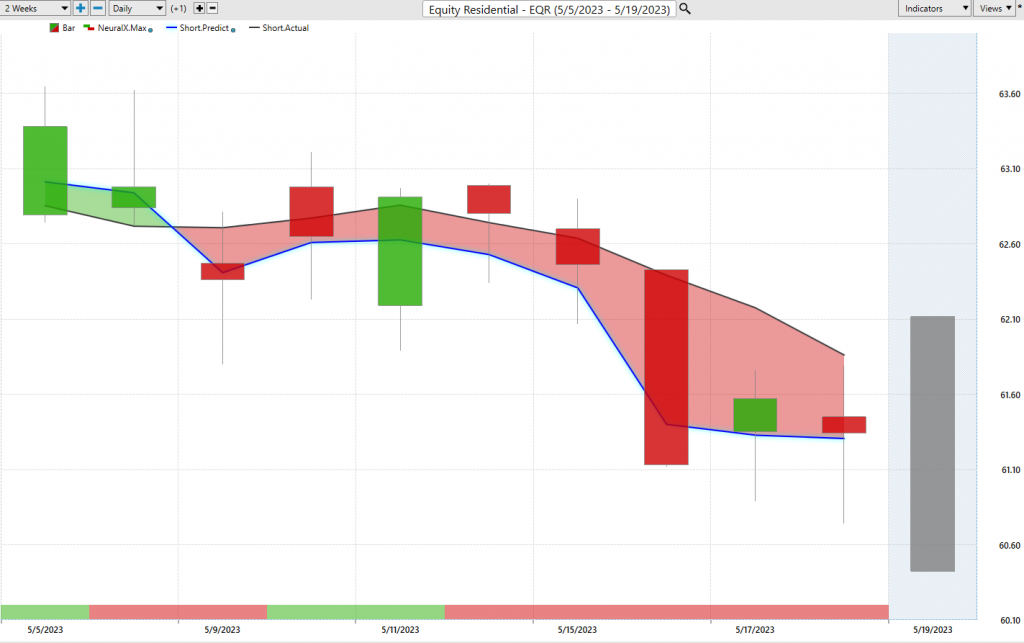
And Equity Residential here, is just such a great example of how all of these indicators really compliment each other. So you’ll notice here, that you actually get the blue line crossing below the black line here, right? This predicted moving average actually moves below the actual moving average, indicating that the overall trend is now down, those average prices, you should expect to be lower than that black line there. And so what you’ll notice here is, that the neural index is bullish and what do you get? Well, you get higher highs over the subsequent 48 hours. You see that prices are effectively flat here, but as the market was shifting and as things were evolving over time, notice that that neural index says, “Okay, now over the next 48 hours, expect some weakness along with that predicted moving average being in a downtrend.”
And then you see 48 hours later, the momentum has picked up and clearly not an area where you want to be expecting strength over the past week. So as markets have done really well on Thursday and Friday, what do you see out of Equity Residential? Well, a market that is fairly depressed and you wouldn’t want to look at it all, for opportunities to go ahead and get long. And you can see that as you move up towards these intraday predicted highs, you even sell off from those points and see weakness out of the neural index, out of the predicted moving averages, just about everything there. So again, we’ve done a good job here each week saying, “Okay, well where’s the broad based strength in the market? Where are things going to benefit when we see the SPY and the broader markets move up? And where are things going to languish here?”
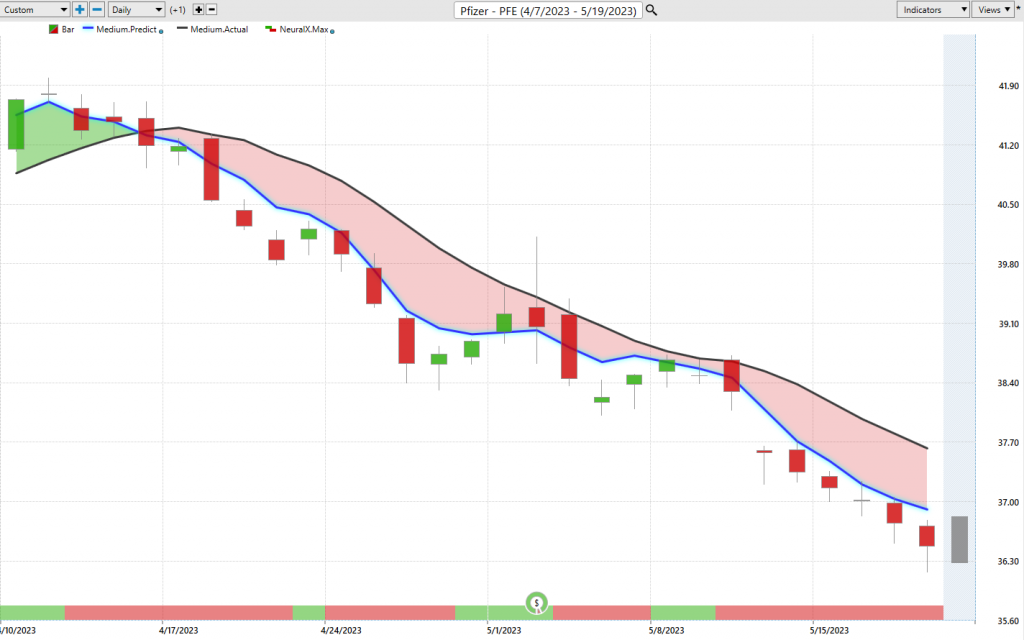
So here’s shares Pfizer. We just keep bringing this in as, this is a very weak market. Well, how has it performed this last week as shares have popped and done really well in the SPY? Well, not very well. And we see that, again, this is not an area where you want to be expecting any reversals or strength in the marketplace, and over the past week, you’re down another 2% as you move down towards those predicted lows.
West Pharmaceutical Services ($WST)
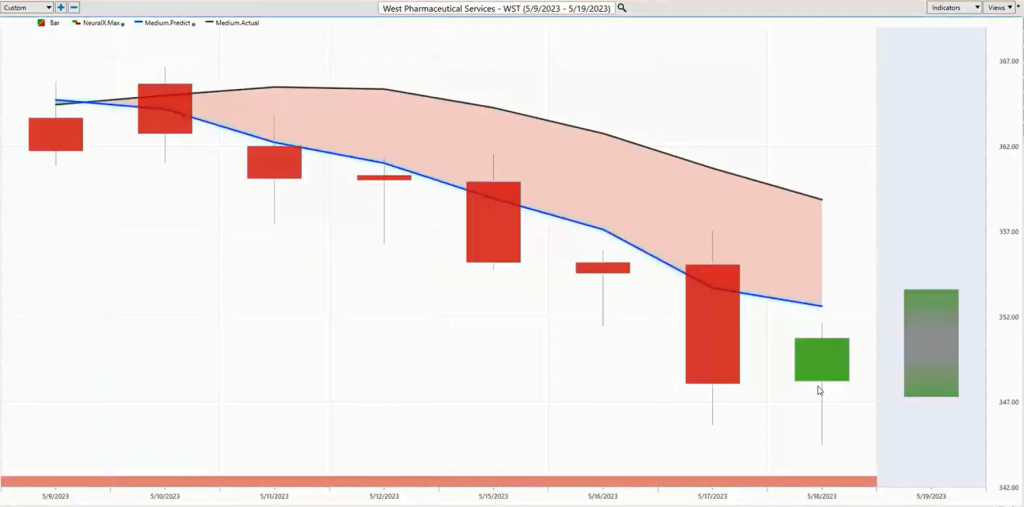
Lastly here, West Pharmaceutical Services. So again, just highlighting that it’s not very difficult to understand, “Okay, well, where’s the strength?” Well, we can see just the huge amount of distance between those predicted moving averages and the actual moving averages in numerous places throughout the marketplace and then with that knowledge, we can go in and say, “Okay, what is our neural index doing? What are our predicted highs and lows forecasting for us?”
But conversely, if we want to go ahead and potentially belong in the markets and maybe even hedge those opportunities with bearish exposure in the marketplace, even things out a little bit, and even make money on those markets as they move lower. But there’s just such an important period in time right now, where you really want to identify where the real strength is in the market, focus in on those opportunities, exploit those shorter term moves, and just completely either hedge or completely avoid some of these markets, as they’re really going to do some damage to your portfolio, if you have the wrong thing sort of filling up the basket here. So we’ll go ahead and leave it there for today. Once again, this has been our Hot Stocks Outlook for May 19th, 2023. Thank you all for watching. Best of luck out there and bye for now.