


VantagePoint AI Market Outlook for the Week of February 8, 2021
VIDEO TRANSCRIPT
Hello everyone, welcome back. My name is Greg Firman, and this is the VantagePoint AI Market Outlook for the week of February 8th, 2021.
U.S. Dollar Index
Now, to get started this week, we’re going to be going again in the forex market, which is very important with the dollar index. Now the dollar recoupling to the S&P 500. But let’s have a closer look at this. One of the questions I received via email was, how do we know for sure that the dollar was going to go higher here when so many people are long the Euro, they’re short the dollar, they believe the dollar is only good when it’s risk-off? Let’s see if we can dispel some of these myths as to where this dollar strength is actually coming from. Now, I believe the person had mentioned that they read an article on FX Street through the Rockefeller Treasury Report or something, and they had stated that they had no clue why the dollar is going up. And usually when you have a risk on environment and the S&P 500 is going up, obviously the dollar would not be going up, and there dumbfounded by why this has happened.
So let me see if I can help you guys and explain to you why this actually happened. So what we’ve talked about first and foremost is dollar cycles. We’ve gone back all the way to January 2020. And we can see that the dollar at the beginning of the year is quite strong. But there’s another cycle there that forms. Where the dollar is usually strong at the beginning of the month, kind of calms down in the middle of the month, then it’s strong again towards the end of the end of the month and into the first week. So if we look at 2020, we can see that the dollar is the strongest basically in the first quarter. Now you do have a lot of off shore money that’s being moved to avoid tax. And then in January, the rule of thumb is that it comes back into the U.S. So you have real money, institutional flows coming back into the U.S.
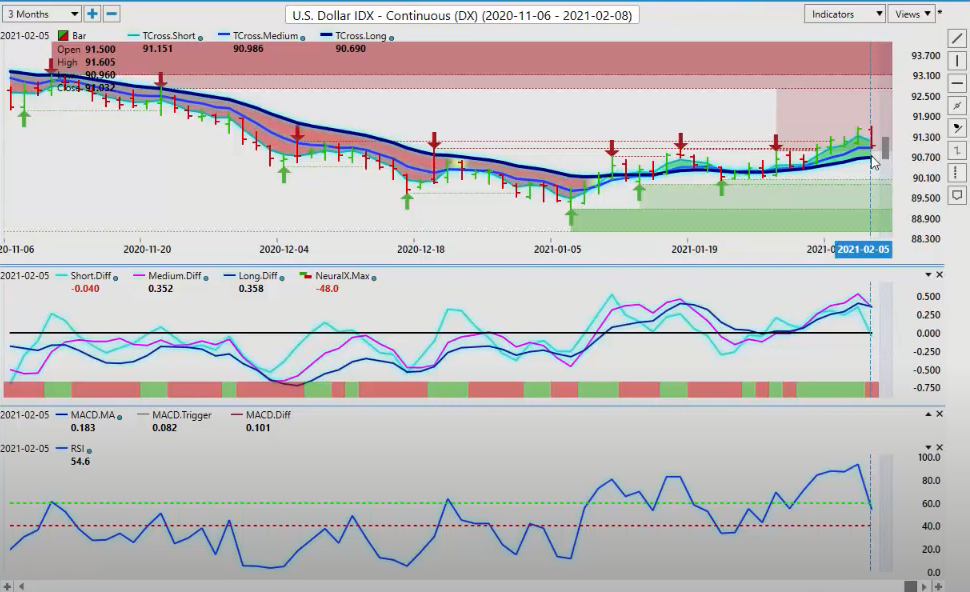
So if we fast forward to 2021, we see a very similar pattern here. Now, there’s two patterns here. One is the seasonality of that money coming back. But the other part of that, all of these vertical white lines represent when the dollar is strengthened around the beginning of the month, anywhere from the 30th right up until about the 10th. That’s the period where the dollar is likely going to be at strongest. Then you can see it cools off a little bit right here around the 18th or so. It goes down a bit, and then it fires right back up. So you can see that this dollar cycle in January and in February is fully intact. From there we fast forward over here to the VantagePoint Software, and we can see that the signal warning us that this dollar strength is starting to turn around here now with the triple EMA cross. The key level we would be looking at right now in for this coming trading week is, can the dollar hold this strength? They’re already saying, no, it cannot. In my respectful opinion, maybe yes, maybe no.
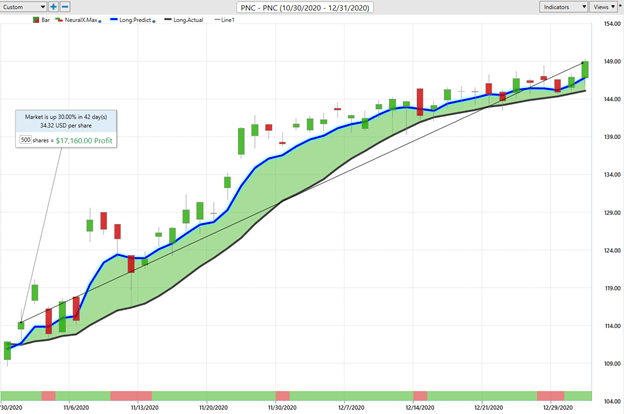
Nothing goes straight up and nothing goes straight down. When we look at this, we are still holding above the T cross long, 90, 69. The dollar index is also firmly above its yearly opening price. There is nothing bearish about this. However, when we look to utilize the VantagePoint contrarian indicators to warn us that we are likely going into a corrective move at this time, not necessarily a trend reversal. We’ve got our medium-term trying to cross our long-term predicted difference and our neural index is down. We have a falling on our side. So this doesn’t tell us the trend is reversing to be clear because we’re above that T cross long. Now, again, above that, it’s still predominantly bullish. So when we click on our F8, we can see that this predicted moving average is the one we really want to keep our eye on. This is probably one of the most powerful day trading setups that I’ve ever seen. So using that predicted moving average, you can see that every single day, the VantagePoint Software tells me, buy dollars, buy dollars, buy dollars, buy dollars, buy dollars, be careful.
Right there. So if we close below this, and I don’t mean go below it for the day, I mean close below it for two days in a row, Monday and Tuesday, and then break down below that again, T cross long, then maybe we have a trade. But the question still remains, how did we know the dollar was going to be strong? The Commitment of Traders Report has reported that the market is grossly, grossly long the Euro and short the dollar. That’s an excellent lagging indicator that the COT report to tell us that, okay, this is what retail traders are doing, but they’re lagging behind. They’re already in trouble. So we look to inner market correlations to confirm that analysis, much like what you’ve seen on some of these websites, and I know guys, there is so much stuff out there on these websites, and the Rockefeller Treasury Report, that’s just one that basically they had stated there is absolutely no reason to buy U.S. Dollars in January.
Gold
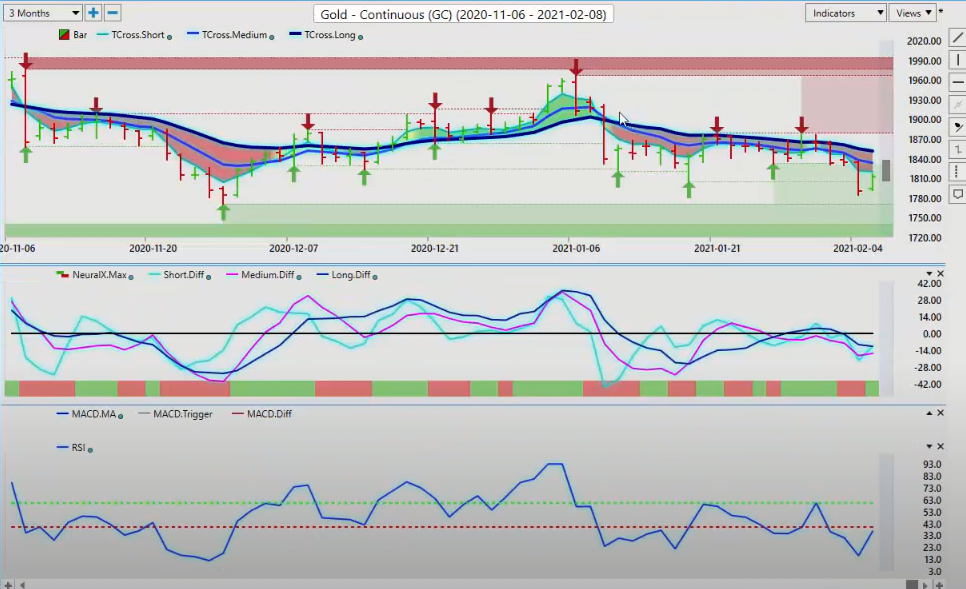
But again, let’s dispel that myth. Okay. So when we look at this, we immediately go to one of the top correlated markets, which is gold. Gold has been a firm sell in the VantagePoint Software basically since we started the calendar year. We’ve come up and had multiple retracements that do not include Fibonacci or anything else, just the VantagePoint key T cross long. The market’s come back, retrace that and failed. This is a confirming indicator for us that the dollar is not as weak as what they’re trying to sell us, and the people that are saying don’t buy dollars maybe don’t fully understand the structure of the money flows coming into the market, the monthly dollar cycle where countries to settle their trade balance are required to buy dollars. None of that is taken into consideration. Only simple, technical, lagging indicators. When we look at inner market analysis, we’re able to forecast outward. Now, right now, when we look at this, gold may recover next week because we’ve got a corrective move on the dollar.
The other thing they’re going to try and sell you on is that the unemployment numbers on Friday were horrible. Well, guys, no they were not. The U-3 number is not a trustworthy number. That’s a household survey number. The U-6 number that came out on the unemployment number was quite good, actually. It went from 11.7 down to 11.1. That’s probably one of the biggest downward moves yet. That’s a very good indicator that the labor market’s looking pretty good. The unemployment rate, very good. Again, if you compare that to the Canadian unemployment report that was released at the exact same time on Friday, there’s no comparison between these reports. The Canadian report jobs report was awful. Now we’re in lockdown, so that’s understandable. But the U.S. is still in partial lockdown also, and that U-6 number is moving in the right direction.
S&P 500 Index
The other thing we look at is, again, some of this analysis is banking on the fact that the U.S. Dollar is automatically going to be inversely correlated to the S&P 500. They failed to realize that prior to all of this COVID stuff, the dollar and the S&P 500 were actually already positively correlated. Gold was inversely correlated to the S&P 500. Now we’re seeing that short-term, about the last 9, 10 months, that correlation is decoupling. So what I mean by decoupling, it’s the dollar is recoupling back to the S&P 500. We anticipate that the very powerful economic engine of the U.S. is about to fire up here, potentially on all cylinders. So when we look at that, it would be perfectly normal. Myself, as a Canadian, to buy the S&P 500, the first transaction I have to do is not to buy the S&P, there has to be a currency transaction. I have to convert my Canadian Dollars to U.S. Dollars. So you can see how that correlation makes a lot of sense.
But again, some of the analysis out there is ignoring the inner market components of this. They’re assuming that COVID will continue. Well no, we have a vaccine now. So the vaccine seems to be doing pretty good. There’s hope, there’s optimism. So that’s hope for the U.S. Economy, all of these things come into play. So again, we see just because the S&P 500 is going up, it actually does make sense that the dollar is going up and gold is going down. That was the correlation prior to everybody on this planet being hit with the COVID pandemic. So once again, we have to put the pieces of the puzzles together. But while they’re continuing to sell dollars, we are buying them. So right now, again, when we look at the dollar index more closely, we see that we have a corrective move is likely in the works right now. So that means we could theoretically have a corrective move on the S&P 500 lower also. Gold could get a little bit of a boost.
Bitcoin
I think Bitcoin, personally it could be the new gold here, because Bitcoin is again, last week was a very odd week, I must say, for inner market analysis traders, because everything was up except for gold and the Euro. Bitcoin, the dollar and the S&P 500 were all up together. This potentially could be a new correlation that we’re looking for here, that money is going into Bitcoin, not into gold. What did they tell us? Don’t buy Bitcoin. ECB says you’re going to lose all your money. Well, Elon Musk has fully endorsed Bitcoin. This man is a visionary. If he’s saying to buy a Bitcoin, like I’ve said to buy Bitcoin since middle of 2008, I feel somewhat vindicated that I have a visionary genius, like Elon Musk, also seeing the value in this digital currency. Very, very interesting times here, guys. But I saw through Wall Street what they were trying to sell us on. They’re trying to sell us that Bitcoin’s a scam.
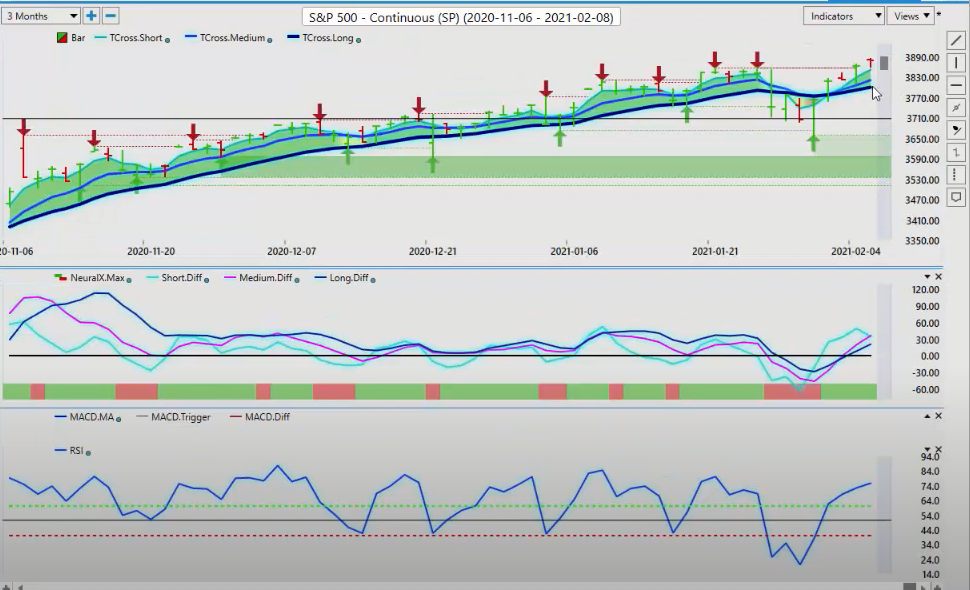
And then if the ECB says you’re going to lose all your money, then that means you’re going to make a ton of money if you go buy it, because I certainly would not trust the Central Bank to give me financial advice, that’s for sure given their history. So when we look at this, we see a very similar signal on the S&P 500. The medium term crossing the longterm predicted difference. It’s a very, almost identical signal to when we cross-reference it to the dollar index. This is a very, very powerful contrarian tool that warns us at this time we are likely to correct lower. Nothing’s 100%, but at least it gives us a warning that we can forecast these things to happen. Again, this is an outlook, not a recap of something that already happened. We’re looking forward. So again, the S&P 500 remains bullish while above that T cross long. 3801. Once again, a very, very powerful day trading tool in the VantagePoint Software, because we use this blue line to confirm this long predicted to tell us that the market is still bullish.
And you can see how the market comes down almost daily and kisses the blue line, and then accelerates off that with the neural index. And again, when we look at the predicted RSI, the break of the 60 level tells us that this has momentum, and sure enough, we go flying higher to all time highs. I personally did not think we would ever see 3,900, or maybe even 4,000 now on the S&P 500, but we are. And again, they say it can’t go any higher. So they say, okay, it’s over bought, it has to go lower. It takes a little minor corrective move lower, and then goes even higher. We just need to identify these things. So, right now, the S&P 500 is also pulling oil up with it. And I must say, I’m a little bit surprised by this, given the fact that a lot of countries are still in lockdown and there isn’t a lot of demand. But this is a rather steep incline.
Crude Oil
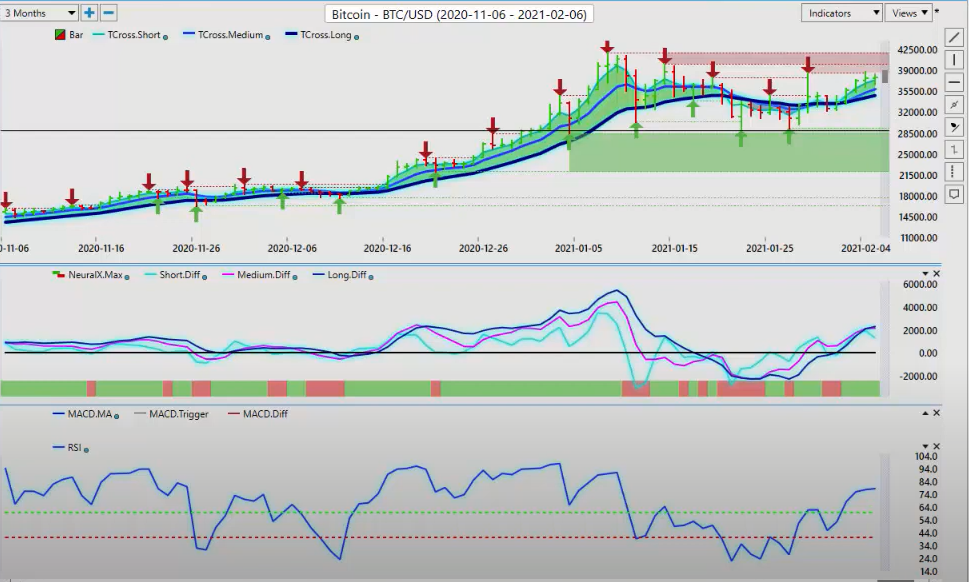
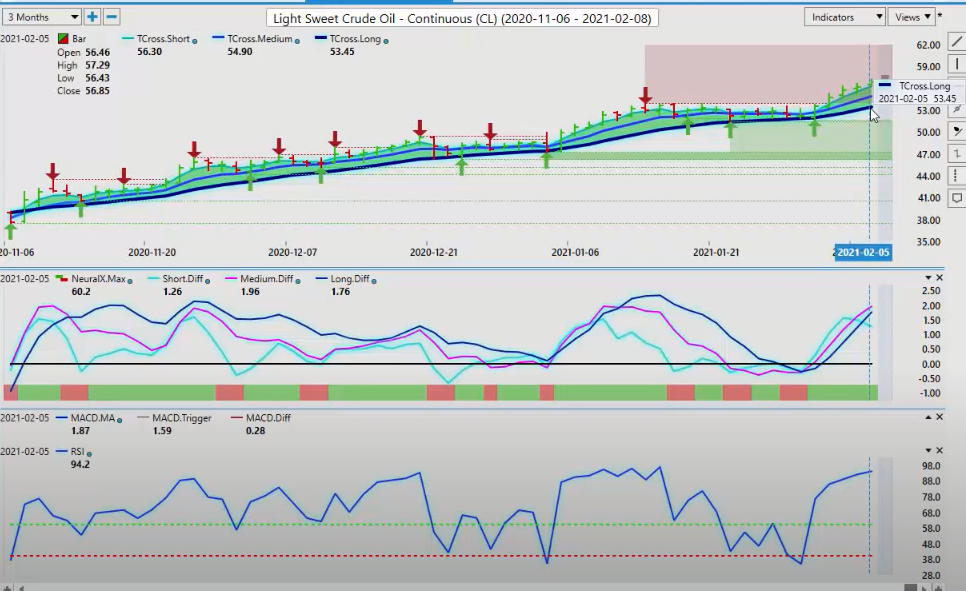
So any move lower on the S&P 500 and oil will go lower. But the fact is, this past week or longer, the dollar and oil have also been going up together. So the correlation there that we’re looking at is pre-COVID. That tells me maybe we’re going to get lucky and COVID is coming to an end. So as long as we hold above 5345, then oil is likely to remain firm. The same thing applies to Bitcoin. We have our top up here in place. Once we put in a very significant top, we often go into range trading. The market is only trending 20% of the time. But you can also see, much like the dollar and the S&P 500, there’s a very early warning sign that we could be getting ready to move lower in Bitcoin also. But again, Bitcoin, S&P 500, oil and the dollar all going up together last week. The odd man out is, again, the Euro and gold.
So it explains where this dollar strength is coming from when you break it down like this. Not just throw up your hands and say, well, I don’t know why the dollar is going higher, which is what the Rockefeller Report had stated. And somebody had passed it onto my desk and said, can you speak to this a little bit and say, how did you know it was going to do something? But a lot of other people are on the wrong side of this. Well, retail trade is often very much what the CFTC data shows us, is that 80%, 75% of retail traders lose money and 20% make money. So we want to get into the 20% mark, and intermarket analysis is what will move you in that direction. So when we break this down and we start looking at our currencies, with everything I’ve just said, it helps to explain, and hopefully helps you understand, what the real driving factor of the Euro.
Euro versus U.S. Dollar
If you go back and look at all of the Commitment of Trader’s reports since December, that basically with my own direct clients, I had them moving into the Euro shorts about the third week of December, and we’ve been short ever since. Because I could see these turning points coming in the VantagePoint Software using the neural index, the predicted differences, but most importantly, identifying those inner market correlations, because we as traders have a lot to deal with with this COVID. It is sent all the markets into a tailspin where gold went up with the S&P 500, the Euro went up with the S&P, the dollar in a risk-off environment continued to lose ground. These are bizarre times, and for somebody that doesn’t have the experience, they would be very confused by this, and rightfully so. But when we look at this right now, you can see that the Euro is suggesting we’re going to have another corrective move higher.
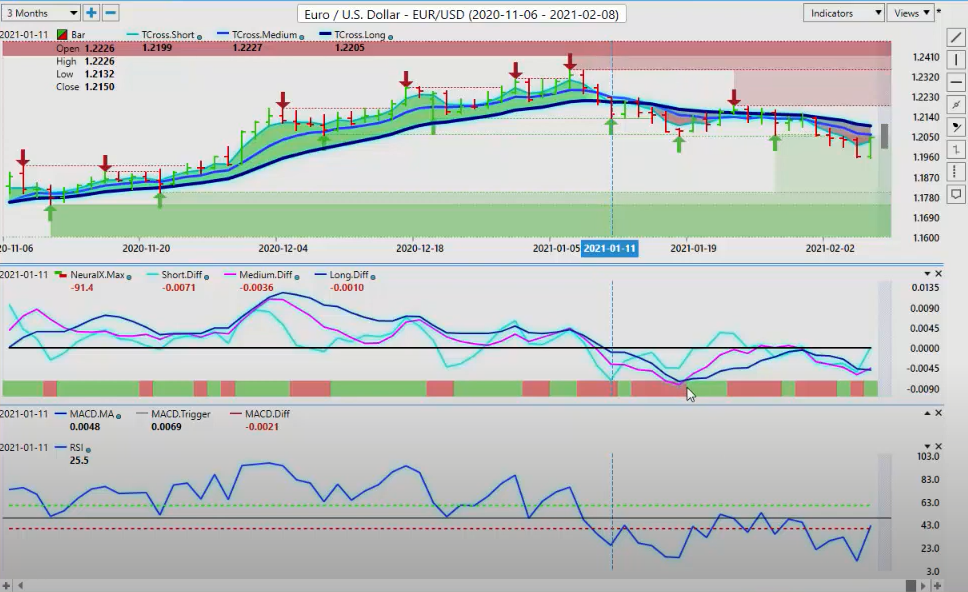
We’ve got the medium-term crossing the long-term predicted difference with the neural index. So in this particular case, at this particular time, VantagePoint is forecasting the Euro is going to move up on a corrective basis. In my respectful opinion, only, they are misinterpreting that labor report out of the U.S. They are not focusing on the unemployment rate and the U-6 number, they’re strong. So in that case, this would be a corrective move. So to start the week, if we’re lucky enough to move towards 121, that would represent a selling opportunity, a corrective move. If we close above 121 for two days in a row, then we can start looking at Euro longs again. But for now, this move, as called by VantagePoint, is saying that the Euro is likely to move higher at the start of the week, but it is not confirming a trend reversal in any way, shape or form.
We will see that all through the actual markets here.
U.S. Dollar versus Swiss Franc
If we look at the U.S./Swiss Franc, we can see a very similar signal forming here. We’re starting to put a bit of a top in. On your software, you can just draw a line like this, and then look to your indicators. Well, we’ve had a nice bull move up, so now what we do is have a corrective move lower, and that’s likely going to be down to around the 8922. But first we must cross over this key predicted moving average. As you can see, this trade, this is, again, one of the most powerful day trading software that you will ever see, because it’s simplistic. The strategy is simplistic. Above the blue line, long, below the blue line, short, and then taking the T cross long into consideration. So when I look at this, I can see that I crossed over the blue line here, and then all of a sudden I couldn’t get back under it.
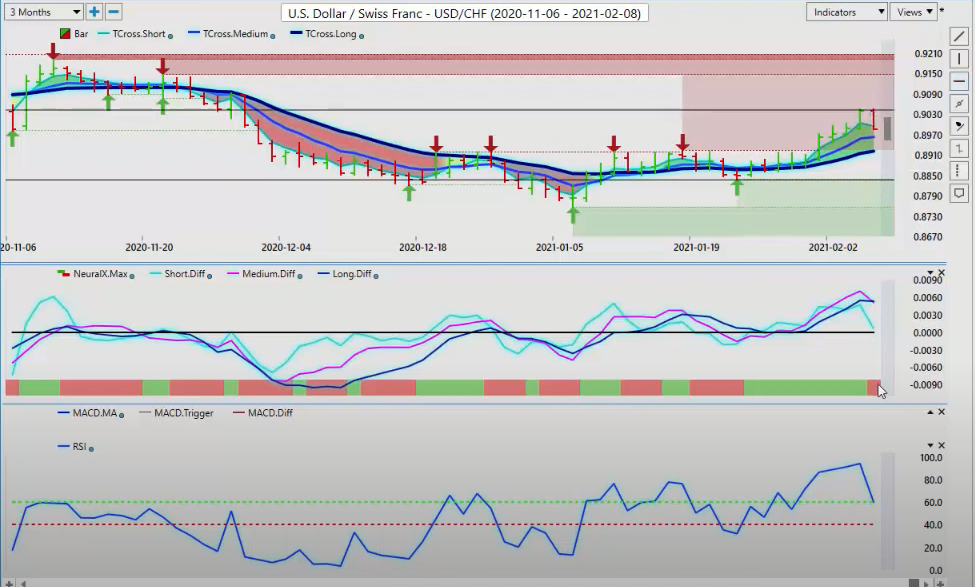
So every day this is a long, long, long, all the way up. But if I cross below this level, the main thing is to identify it, 8969. We can see that on the Euro/U.S. trade last week, the exact same thing. And this is why I’m saying the software is so powerful when used for day trading, or long-term trading, you can use it for both. But I prefer to get in, make my money, go to cash, and wash, rinse and repeat. So we cross over the blue line, we come back up to it, hit it, and we keep hitting it. Now, once again, much like as having a dual purpose, you can see that the market came right up to this blue line and it’s like it hit a brick wall. It can’t pass it. So we have to see if we can get over that, but then the next hurdle would again be the 122 level. These are the things we want to watch.
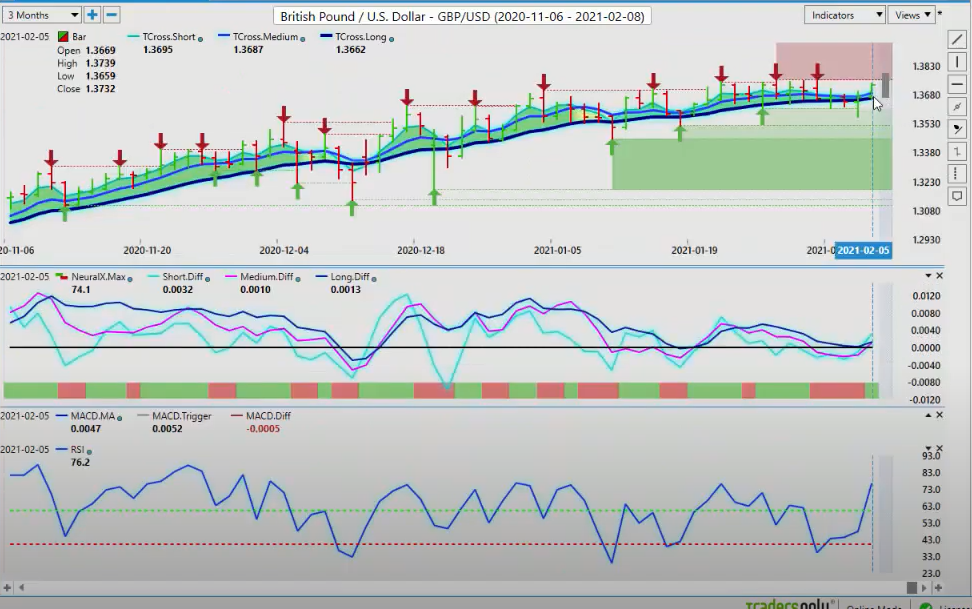
British Pound versus U.S. Dollar
Now, with the Pound/Dollar, this one’s a little bit different, because the Bank of England is basically saying we are not entertaining zero interest rates, or sub zero interest rates, excuse me. So that gave the Pound a boost. Now we still have verified resistance up here, but once again, you can see that the pending theme here for next week, or at least the start of the week, is dollar weakness. If it’s truly dollar weakness, then the dollar will be weak into Tuesday. Monday is basically a fake trading day. Be very careful with Monday, because a lot of times you get a big push on Monday, and then on Tuesday it does the exact opposite.
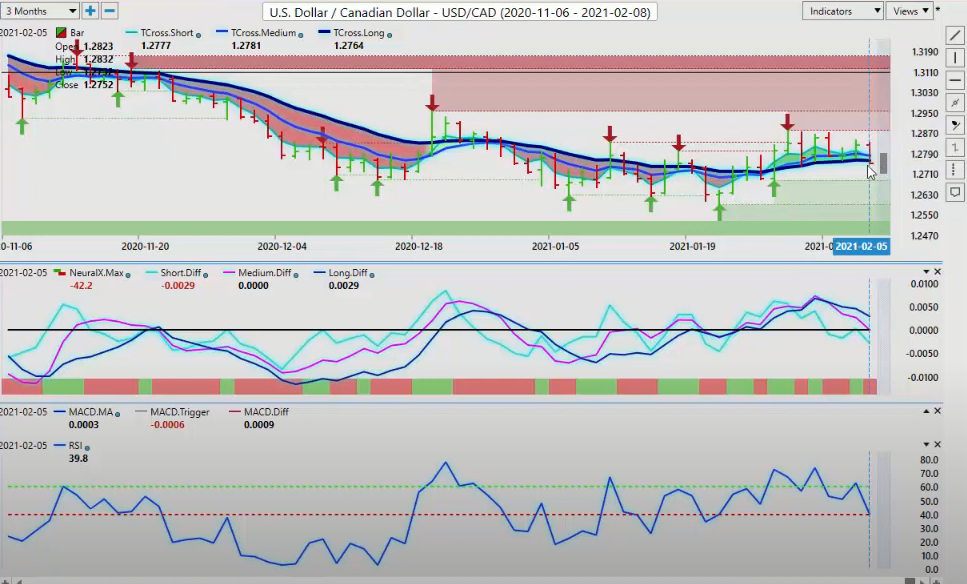
U.S. Dollar versus Canadian Dollar
The U.S./Canada is notorious for doing this. So when I look at this, I’m saying, okay, we’re holding above 3662 and it is bullish, I’ve got a buy signal forming here. The Bank of England’s definitely on board with this one. But I need to hold above this blue line. So the longterm crossover, we remove the black line. I’ll show you guys how to do that.
You just go to properties, then you’ll see you have your long-term crossover. I click on that. Then you have your long AMA and your long PMA. That’s your predicted moving average. So the long AMA, you simply just uncheck the box, hit apply and you’re good to go. Then you’ve got the blue line by itself. Very easy to read where this is. So you can see that the Pound is hitting resistance all the way along here, and then we closed above it, which could be a trigger for this thing to move higher. When we look and continue to see this throughout the software, we see a similar signal forming on the Dollar/Yen. So it’s pointing me towards dollar weakness. The dollar cycle, for the most part, is probably close to completing for the month. So the dollar would kind of trade sideways until we go get back in towards the end of the month or the first part of March.
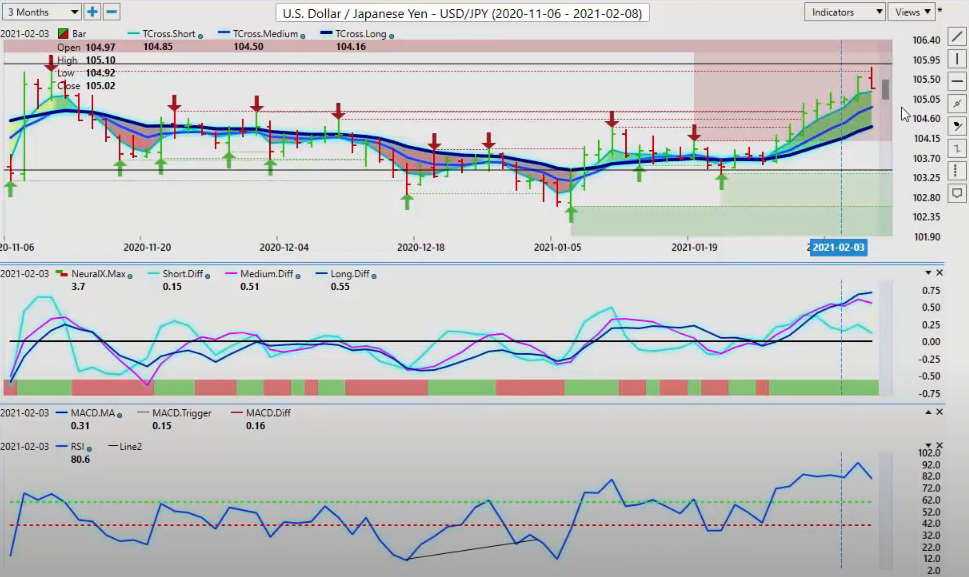
U.S. Dollar versus Japanese Yen
So again, when we look at the Dollar/Yen, we’ve pushed a fair difference. This is a fantastic signal right off of here on the 26th. But again, we know that we have dollar strength pending.
So looking at this, again, we get a big move up. But if we go to our predicted moving average by ourself, we can get very close to the flame, so to speak. 105.01. If the Dollar/Yen is going to make a bigger move lower, than we must break down below 105. So to start the week, you want to see if you can hold above 105. If not, we’re probably going to 104.40, where we would prefer to pick this up for a long at that time anyway. Now, the U.S./Canadian pair, again, these unemployment reports, you’ve got to take them with a grain of salt here. The Canadian report was absolutely horrific on Friday. We knew we were going to lose about 41,000 jobs. We lost 215,000. But that’s not fair to say that that’s because we’ve got a bad economy, yada, yada, yada. No, no, no, no, no, no, no. We’re on lockdown for the last 30 days, guys. So once again, remember one thing, that if the U.S. Economy and the dollar strengthens, it’s very likely the Canadian Dollar will also. The U.S. And Canada, two biggest trading partners, much the Eurozone and the UK.
So if the U.S. Dollar does rally this year, then it’s entirely possible the Canadian Dollar could rally too. The Canadian Dollar is highly correlated to of course oil, but more specifically the S&P 500. So if the S&P is still doing good, then this is probably the first week where I’ve seen the S&P 500 go up, and the U.S./Canada didn’t really go down that much. And it went down on a Friday where the U.S. had a pretty decent report. Canada’s labor report was not good at all, and the unemployment rate went up in Canada also. But again, we have to remember the facts here. Now, there’s the medium term crossing the longterm predicted difference. When you combine that with the verified resistance zone in VantagePoint Software, basically, it’s telling me I’ve got a wall of resistance up here. So right now, shorts are clearly favored on this with the position of oil and stocks.
Now again, when I click on the F8, you can see that we’re really struggling with this predicted moving average. We’ve got one day under our belt here that we’ve closed below one 127.81. In my respectful opinion, this very much could be a short while below 128.80, but we’ve got to get below and stay below 127.81. And we have very significant support on this bar right here. This bar here, the low of this bar is 126.85, but just above that is the yearly opening price. That’s where you’ve got to be careful. If we break down below 127.15, the yearly opening price, then you’re going to see this payer drop potentially very quickly. But again, a lot of talk about the Keystone Pipeline. Yes, it’s not good that it was shut down. But there are still some other jobs on the go here. Green energy stuff’s moving along. So there’s going to be a transition period for Canada, where we move away from the oil sector, excuse me, and start looking towards green energy jobs.
Australian Dollar versus U.S. Dollar
I believe that there’s a good chance that that will happen. And in fact, I’m going to bet on it. So we’ll see at this time. The Ozzie and the New Zealand, once again, up against some stiff resistance here. We’ve closed above the T cross long at 7666. Medium term crossing the longterm predicted difference. But again, we’ve got to clear this particular level. That’s a good sign. But in my opinion, again, they’re misinterpreting that labor report and they’re jumping on the bandwagon with the media telling them that was a horrible U.S. labor report. And it actually wasn’t, guys. That’s all I’m telling you, is the U-6 has been moving in the right direction from basically back in the summer, and now it’s starting to accelerate the U-6 to the downside. That’s a positive for the labor market, not a negative. So again, it almost is like the media is looking for things to say bad things about the U.S. Economy, when in my opinion, that’s not really true here at all. Not at all. So we’ll continue to monitor this.
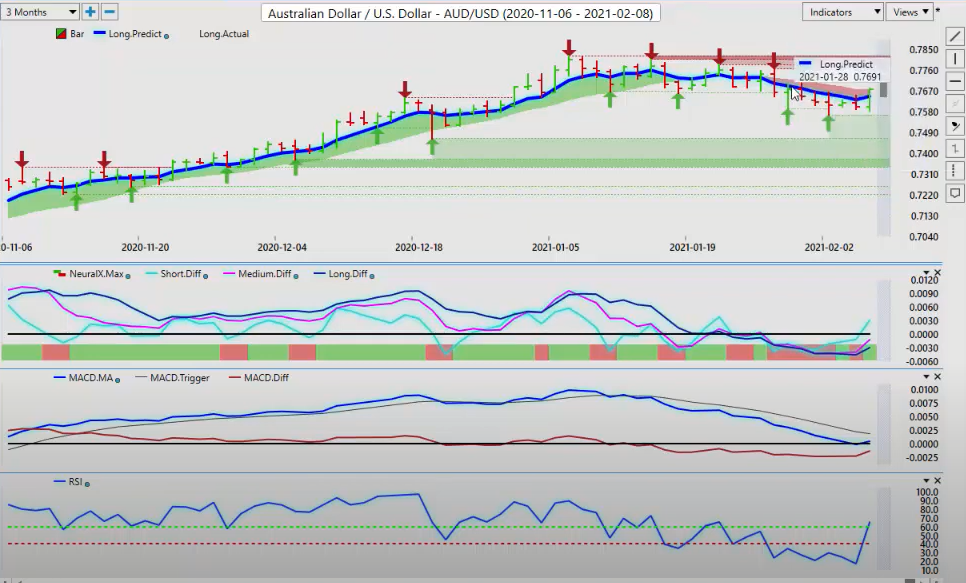
But once again, when we click on our F8, you can see that, again, one of the very, very powerful day trading tool. And I don’t mean scalping here, guys. I mean, normal day-to-day trading. In the currency markets, they only move 1% of their value per day. You want to take these trades, make your money, and then go back in. But if you think that there’s going to be a longer term trade or trend, then you can certainly stay in. Very often, a lot of times what I’ll advise my clients is put two positions in at or about the same place, and then take one out. Take half the money off the table, and if you believe it still looks good, leave the other half of the position in there. Easy peasy, nothing wrong with doing that. You’re banking money and you’re trying to stay in there for a longer term trade. But there are so many ways, affective ways that we can use the VantagePoint Software to do these trades. It’s just strategy based.
New Zealand Dollar versus U.S. Dollar
So right now the neural index is up. We’ve got a rising RSI above 50 and 60. It’s pointing towards further gains. And I wouldn’t rule that out with the Ozzie. But again, do not count the dollar out just yet. The same exact same was going to apply to New Zealand here, but you can see New Zealand has been in this channel. Basically we’ve got the lower end down here at about the 70 cent mark. The upper part of that area is coming in at or about the 7315. But these arrows are all bunching up, and you can see, they’re basically, it looks to me like resistance is building here. But again, if stocks continue to move higher, just remember that doesn’t necessarily mean that the dollar is going to go lower anymore. I am definitely seeing dollar demand, a decoupling between the inner market correlation of stocks up and dollar down, and that the dollar is only good in a risk aversion situation. I would disagree with that completely, that at this particular time, they can actually move up and down together.
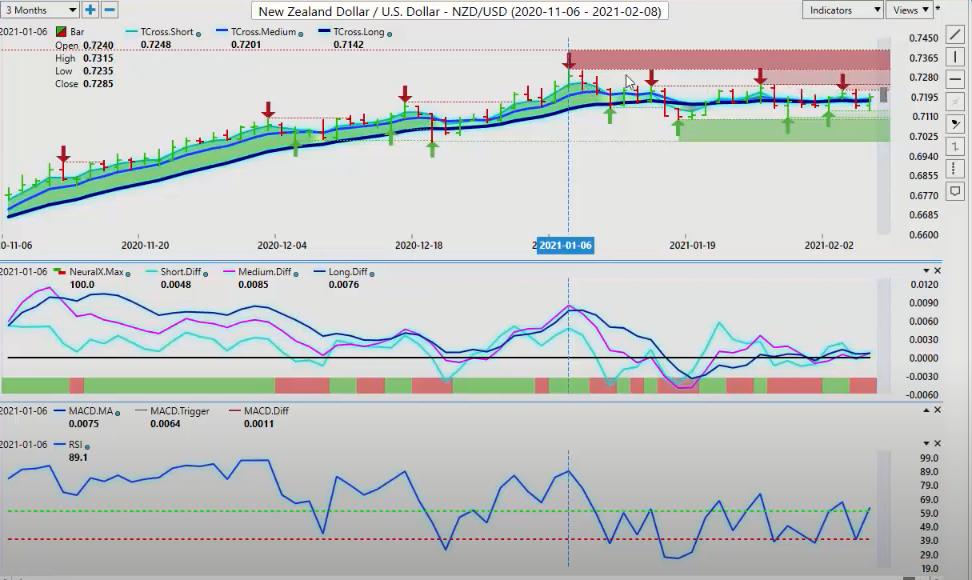
So that may not save the New Zealand Dollar. But again, we know where these levels are. Again, if we look at the F8, we bring our blue line in here, it’s basically moving back and forth in a sideways chop. So I would prefer to let this thing either break down below 7096, or break above at the very least here, guys, I need it to break above 7247 before I get too excited about long-term buy positions on this particular pair. So what that said, this is the VantagePoint AI Market Outlook for the week of February 8th-
Are you using A.I. yet?