


Register for a Free Live Training
The Hot Stocks Outlook uses VantagePoint’s market forecasts that are up to 87.4% accurate, demonstrating how traders can improve their timing and direction. In this week’s video, VantagePoint Software reviews forecasts for Caterpillar ($CAT), Waste Connections ($WCN), Compass Minerals ($CMP), Bed Bath and Beyond ($BBBY), Johnson and Johnson($JNJ), Icahn Enterprises ($IEP) and Wingstop ($WING)
Hello again, traders, and welcome back to the Hot Stocks Outlook for March 25th, 2022. Hope you all are having an excellent week out there in the financial markets, and like always, plenty to cover here in today’s outlook. We’re going to, like we typically do, revisit many of the markets that we’ve looked at so we can update those forecasts and see how those short-term predictive indicators can really help you out. And we’ll look at some volatility here in Bed Bath & Beyond. We got Johnson & Johnson and actually some bearish opportunities here in the market where we really highlighted how you can make money on the bullish, but also the bearish side of the market. This is a really great time to really be particular about where you want to pick those stocks. This is why we come back and revisit some of these things and really show these updates here.
Starting out here with shares of Caterpillar, what we have is daily price action. Each one of these days represents, those candles there, represents a full and complete trading day. And right up against your daily price action, you’ll see that there is a black line and also a blue line. It’s important to understand that what that black value there is it’s a simple moving average. It’s a very common technical indicator. In this case, it’s a 10-day simple moving average, so it takes the previous 10 close prices, adds them all together, and divides by 10. We’re using that value, really, as a measure of where market prices have been. There’s really no inherent edge in a 10-day predicted moving average. It’s just going to be a victim of whatever the most recent close prices and get dragged around.
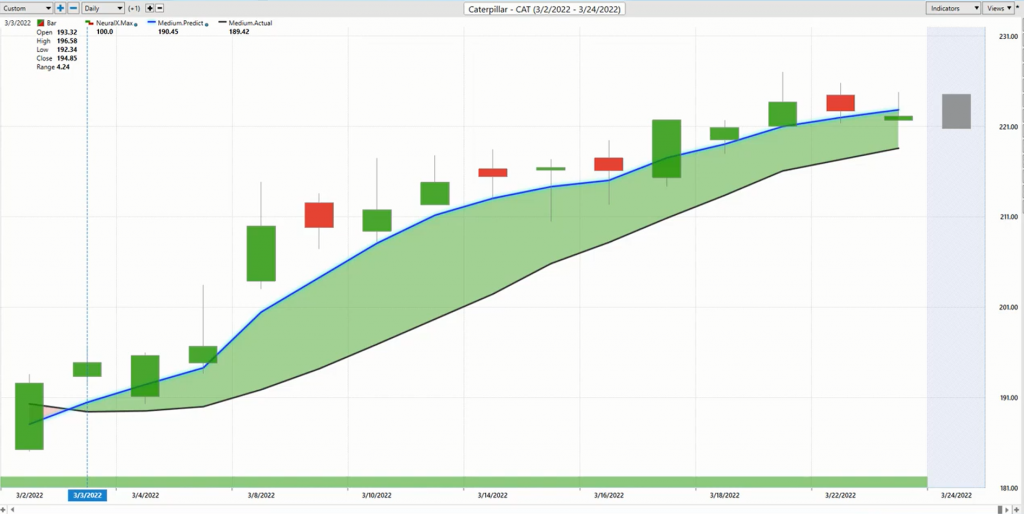
And so we can use that to let us know, okay, where has the market been? But what we want to do is compare that black value to this blue value. For that number to get calculated and plotted against the chart each and every trading day, this is where the technology of artificial neural networks come in. And specifically for Caterpillar, this technology is identifying very important market relationships and looking at a huge amount of historical data.
You got to understand that things like individual stocks, the S&P 500, things like the dollar index, the value of oil prices, gold prices, commodity prices. These are all going to affect the future share price of Caterpillar and have very important influences on short-term price. That’s what the technology is digging into understanding and actually creating a predictive forecast, so they’re actually predicting future prices and where they’re going to be. And then it’s those predicted values that are then worked into these indicators, turning what was a lagging tool that just gets dragged around by the past into a forward-looking predictive tool.
This is where artificial neural networks, the underlying technology behind the software, have a huge edge in analyzing huge amounts of data and making highly accurate predictive forecasts and learning from those relationships. Very simply, whenever that blue line crosses above the black line, it’s suggesting average prices are going to start moving higher. But a helpful way to think about that is just, it’s a highly accurate prediction of where average prices are going to be.
So if it’s slanted up and moving higher, well, that’s a good indication that average prices are predicted to keep moving higher. At the very bottom of the chart, though, you also have these other indicators that are tuned a little bit differently. Whereas this is setting our prediction for average prices, this bottom bar can get updated each and every trading day, so it can be green or it can be red. It’s looking for short-term forecasting, really, just short-term strength over the next 48-hour window. Depending on your trading approach, you may want to use these tools differently and understand that, yeah, you may want to be long, but expect some weakness here. Look for those lower prices to come in.
And lastly, to round out the forecast, we have a predicted high and a predicted low. Before every trading day occurs, you have an intra-day level provided for you as far as an expectation of where prices are expected to trade. These levels can be used to set limit orders, profit targets, again, depending on your timeframe and your trading style, a lot of different trades can manifest themselves over this, what is now a few weeks, where Caterpillar has moved higher, but very clearly over that 15% rally, the indication’s saying this is a very bullish place to be and you’re only getting consistently updated that this continues to be a bullish place in the market.
Now, like we do every week, let’s look at those predicted highs and lows and see how accurate each one of these predictions was. Just over the past five trading days, we can see, well, about as bullish of a forecast you can get. You nailed that predicted low. You’re obviously hitting some predicted highs here. And I believe you’ve taken another chunk out of the market hitting today’s predicted highs as well from previous predicted lows. So just over the past couple weeks, there’s been a couple trades in there where you can use the forecast in a very simplistic way and move forward here.
I just want to… We do the same thing every week, updating these examples, and you really have to think, okay, well, what’s my timeframe? What sort of trader am I? And just pair these indicators with the appropriate strategy that you’re executing here based on the timeframe and tools that you’re using here. But they all work collectively to really round out this forecast.
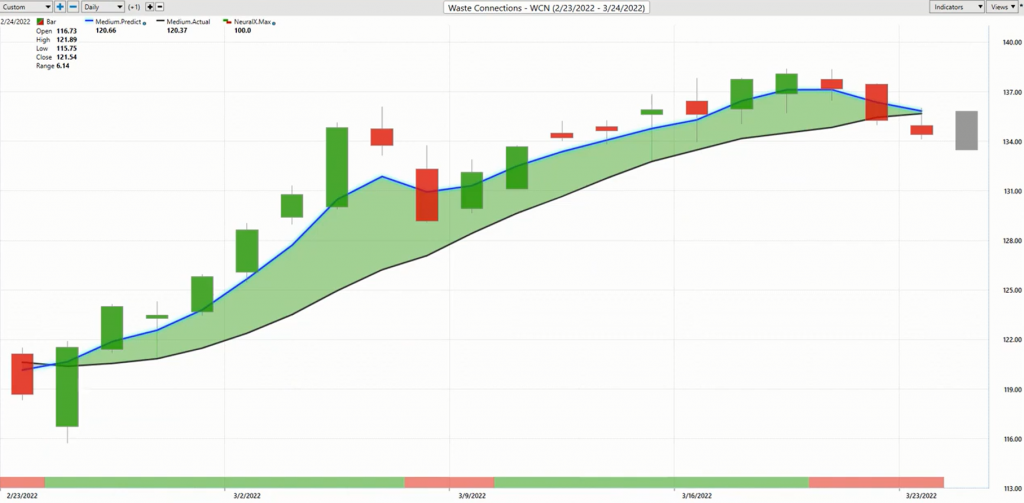
Let’s go over to Waste Connection here. I keep talking about Waste Management, Waste Connection, and more specifically, this pivot here around the 24th and 25th of February is where we saw a big shift in stocks. If we look at the S&P 500, you see that you haven’t traded to a lower low from that move on the 24th. You kind of went sideways, but then you had this big move higher, and so what you want to do is identify the stocks that are really in the best position to do well over that time period.
So where the S&P does one of these, this stock here, Waste Connection, you see, well, it’s a pretty straightforward right up here as far as your predictive tool’s saying, okay, you only want to be long, take profits on longs. We get a little bit of volatility here, but this is where the software does an excellent job of reacclimating itself and getting back with those daily levels so you can make those determinations.
You see recently, we’ve gotten that neural index going bearish, and you’ve moved down towards these predicted lows over the subsequent couple of trading days. This is how traders can make these adjustments, but detect early, especially these shifts in the market, so that when you’re getting your entries down at 120, well, up at 130, we can make some decisions on how we want to manage those profits.
Now, I wanted to bring this in because it really highlights the predictive capacity of the tools to help affect your trading decisions.
Here’s Compass Minerals, and we looked at this last week. You’ll see that pretty much over this whole time period, what’s happening? Well, prices are really running flat. And so you see that with this predicted moving average, it just starts to run flat. Eventually, you do get that crossover to the downside, which, in a traditional interpretation, be, okay, well, we expect average prices to move lower. We actually see that you’re hovering right at that level, so that if anything, it’s running sideways here.
But what I found very interesting about this, and again, bringing this market in because it came from last week, is look at the neural index here. It actually stays bullish through this period, saying there’s strength over the subsequent 48 hours consistently over the past few days. And then with the help of tools like predicted highs and lows, well, these are certainly picking out some levels where traders can make some very good trading decisions from and get some, at least, some good entries. So even if you’re long, you don’t lose any money. And so this has popped once again and has moved up towards these predicted highs.
And again, another one of these areas where we’ve already identified their strength in the market. You’ve identified the trend direction and then use these short-term tools are only going to be effective in helping you pull more money out of those opportunities.
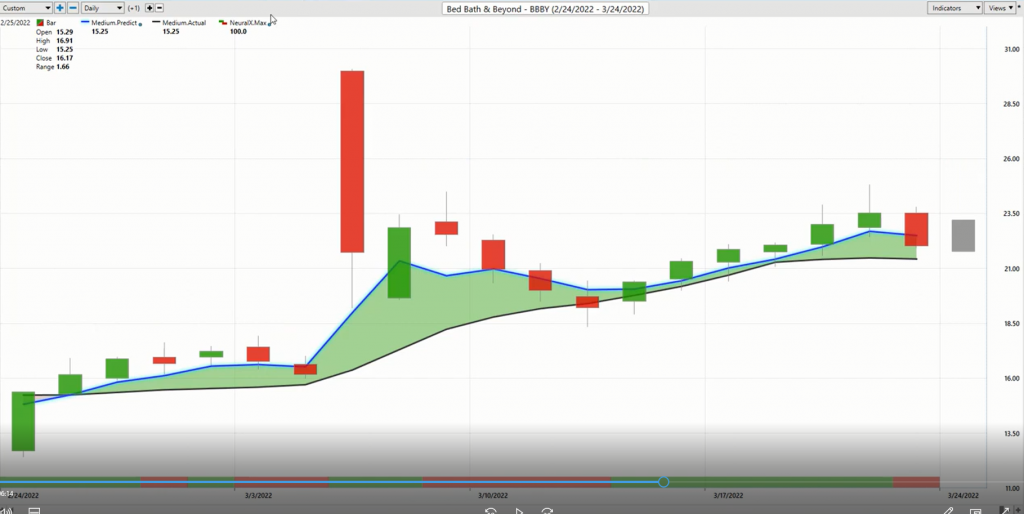
Now, here’s Bed Bath & Beyond. A lot of volatility. I believe this is earnings right here, but I just want to highlight how, even around a tremendous amount of volatility around earnings, when you have a technology like this that’s looking at those in intermarket relationships to make this assessment, it is also looking at what’s happened previously in Bed Bath & Beyond. It understands what’s going on in the single market you’re trading, but how those subtle market relationships are affecting things into the future. And so even when you have these days where the software doesn’t know earnings that day or a huge amount of volume catalyst might be there waiting to drive things, but this is up to you to know that, yeah, earnings are the next and things like this.
But you see how accurate the technology is. It’s saying, okay, well, there’s been a huge expanse in volatility. Let’s get these levels back on as far as getting tuned in and helping you make better trading decisions over the course of this period. Again, you see neural index goes bearish, these predicted highs and lows moving lower. Sure, there’s a lot of volatility, but as far as the forecast guiding you here, neural index goes bullish. Here, the strength comes back in.
These tools can really help you understand when to get into something, but also how to better manage that volatility and not get shaken out of trades where you may want to stick with that opportunity and not lose sight of the bigger picture or potentially add to it at better prices.
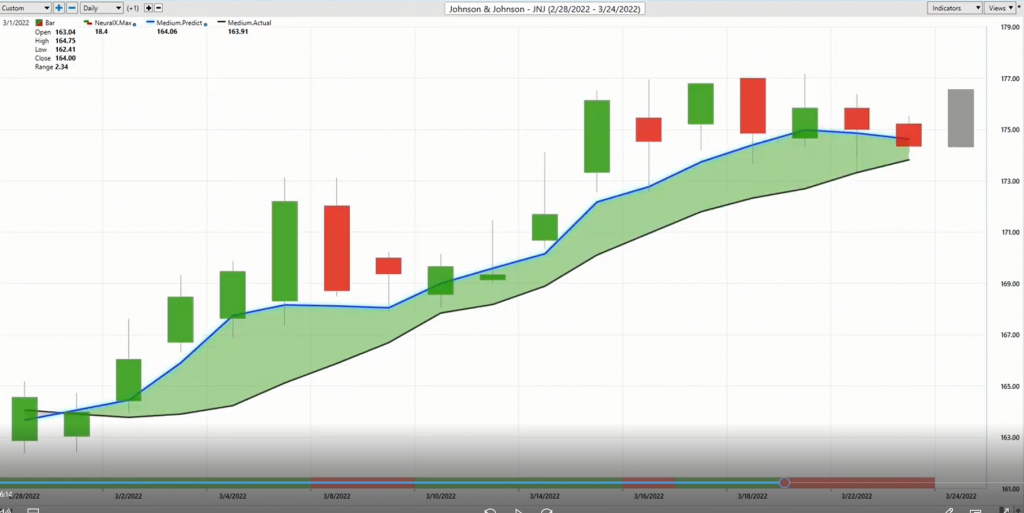
Johnson & Johnson here are going to be pretty similar to Pfizer. We again see this shift happening around the 24th, 25th. This is where the IntelliScan really comes in. When these predictive indicators start creating these consistent crossovers, really help you detect these opportunities very early on. And so that’s a key to, as a trend trader, recognizing that there’s been a shift in the marketplace, but more importantly, as recognizing if that shift is continuing and how to manage that.
Again, it gets back to these predicted highs and lows helping you out here to manage the situation, pull as much money out of the market as possible over a given period. You can get those nice entries by identifying those shifts, but more importantly, take some of these pieces out of the market even when the market’s running sideways here. Again, a pretty nice move here in Johnson & Johnson, but more importantly, I kind of argue that it’s about this exposure coming on from where these crossovers, and there’s a lot of different places to get that exposure. And that’s what we’ve been highlighting at least over the past couple weeks here.
Now, it’s all not to the upside here. This is where we want to identify some clear areas where you can hedge the market. I mean, honestly, there’s not a lot of markets that are in really strong down trends because you’ve had so many basic material stocks do well, so many stocks do well from about a month ago here, now. You really want to pick your spots as far as, okay, well, where’s that weakness playing out?
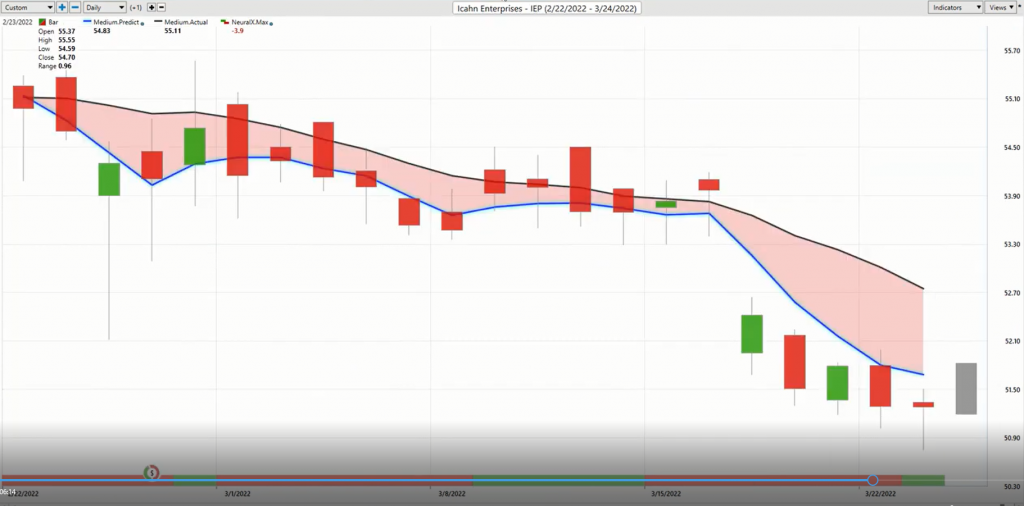
Well, you see here on Icahn, crossovers to the downside, going all the way back to about the same period, but clearly not a place you want to be. And if you’re you using those forecasts to guide the decisions, again, it gets back to… We have these levels sometimes where you see you get this volatility here, but you only want to be short, taking profits on shorts, and you see just how accurate these levels are on most of the days that you’re trading and looking at these opportunities.
Here, the neural index goes bullish and you see these moves to these higher highs, but very clearly, the trend is very much to the downside and a lot of separation still between that blue and black line and where you expect those average prices to be. Once average prices remain below that actual moving average and neural index goes bearish, that’s where you can really see some things accelerate to the downside and you can get ahead of that. That’s really the whole point of using predictive tools like this.
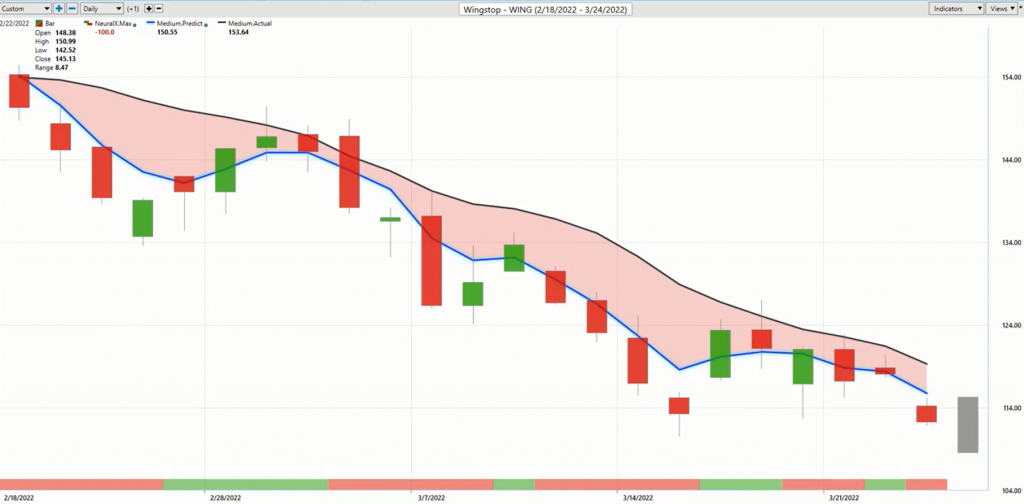
Lastly, here, Wingstop. Very similar sort of picture, but just want to highlight some of these differing situations that can really balance out the overall portfolio. But again, it’s the same thing. Whether you’re on the bullish side or the bearish side, you’re using the tools in a very similar way and helping you identify, again, those big macro shifts in the market, those big sector rotations. And where it’s appropriate, to then continue to use the predictive forecasts from VantagePoint and do some of that shorter term trading and understand where that strength is in the marketplace.
We’ll go ahead and leave it there. Once again, this has been the Hot Stocks Outlook for March 25th, 2022. Thank you all for watching. Best of luck and bye for now.


