


Register for a Free Live Training
The Hot Stocks Outlook uses VantagePoint’s market forecasts that are up to 87.4% accurate, demonstrating how traders can improve their timing and direction. In this week’s video, VantagePoint Software reviews forecasts for Caterpillar ($CAT), Pfizer ($PFE), Compass Minerals ($CMP), Quest Diagnostics ($DGX) and Waste Connections ($WCN)
Hello again traders, and welcome back to the Hot Stocks Outlook for March 18th 2022. Hope you all are having a excellent week out there in the financial markets, and as always plenty to cover here in today’s outlook. So we’re going to start out with shares of Caterpillar, we’ve also got Pfizer here, we’ll also cover Compass Minerals, so continuing on in the basic material space, and then Quest Diagnostics, and lastly we’ll end on Waste Connection, which we actually looked at Waste Management a couple weeks back as well, and is really matching a lot of the stocks that are doing well over this period, so it’s a good thing to take a look at here.
But let’s start out with shares of Caterpillar. What we have here is daily price action, is what you’re seeing with all of these daily candles here. So each one of those days is representing a full and complete trading day and right up against that price data you’ll see that there is a black line and also a blue line. Now the black line that you’re seeing there is a regular simple moving average. It’s actually a 10 day simple moving average. You just take the past 10 closed prices, add them all together, and then divide by 10. And it works really smooth out the existing price action. And let us know where the market has been over a given period of time. But obviously traders need to be ahead of the next move in the market. And so what we actually want to look for is this blue line crossing above that simple moving average value. And for that value to get calculated and plotted and put against the chart every single evening for the trader, this is where Vantage Point’s technology of artificial neural networks is coming in. So rather than just looking at the past close prices, and that line just ends up getting dragged around by what’s most recently occurred in the market.
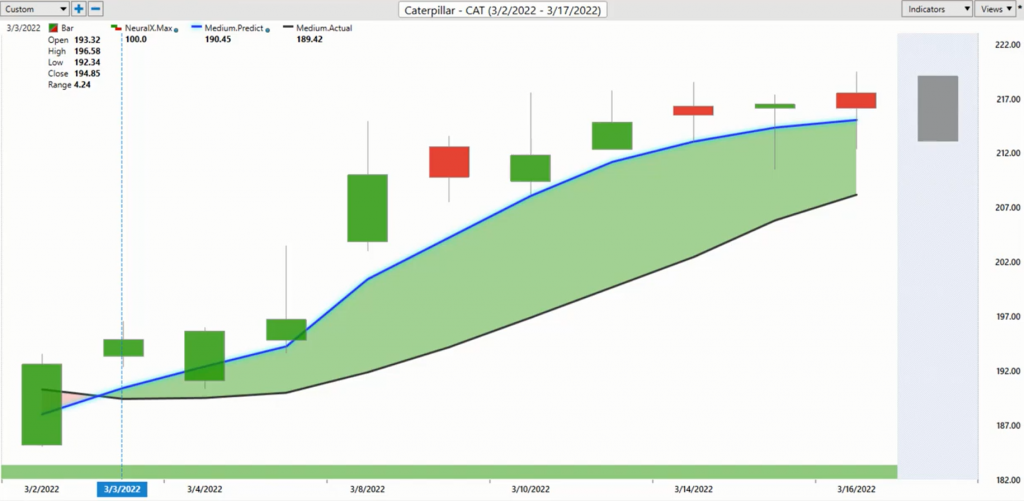
This is where Vantage Point’s technology of artificial neural networks are performing what’s called intermarket analysis, and it’s looking at important market relationships that are happening between the target market that you might be trading and other markets. So this may be the S and P 500, the Dollar Index, crude oil prices, commodity prices like gold and copper and silver. And so what we’ve seen recently is oil steel, commodities really start to move and that have a tremendous effect on things like Compass Minerals and Franklin Nevada, a lot of those stocks, we’ve had a lot of focus on over the past couple months. But the same thing is happening all the time in the markets, and what’s happening is these neural networks have figured out what markets are known to drive and influence specifically shares of Caterpillar. So it has its own unique set of known markets that are driving this forward.
And what happens is taking that information and actually using that to generate true price predictions forecasts, and using those predictions to actually construct the value of these indicators. So rather than having just a regular moving average that lags behind price, we have these predicted moving averages that can actually be entered into our scan. So you can actually see exactly when these predicted moving averages are crossing and creating signals for the trader. And it really helps you identify a lot of these big macro shifts that take a big sector of the marketplace or just stocks risk on risk off environment oftentimes. So what we have here with Caterpillar is you see that blue line crossing above the black line. But what I can do is if you look at the very bottom of the chart, you’ll see we have this bar and this is actually a predicted neural index.
And you’ll see that this will flip from green to red when we get to some subsequent charts, but this is also utilizing that technology of artificial neural networks, but it’s tuned to solve a different problem. Not looking at average prices, but looking at short term prices just over the next 48 hours of strength or weakness. And lastly, you’re provided with a predicted trading range. So think within 48 hours, but actually intra day of a predicted high and a predicted low price. And again, this is where neural networks do a great job of trying to solve a very specific problem using the clues from those intermarket relationships and then giving this information to the trader to make better trading decisions. So we can see here, if we actually look at how accurate are all of those predicted highs and lows against the actual market data, we can see this being the most recent prediction, and we can see how accurate all of these days are against the actual real market data once it fills in the blank there.
And this allows traders to recognize those shifts in the overall trend direction, but most importantly, manage those opportunities effectively and understand that if you want to get the best entry possible, well you might want to look towards these vantage point predicted lows and keep managing that opportunity. You’ll see that when you get the direction and things are breaking out, you might break past those levels, but notice how well it does even on the top side to take profit and then reestablish that position at even lower levels, but understand that look, if the trend is still up, you would want to maintain that long position. And there’s been some really tremendous opportunities opening up really very similarly to the opportunities we looked at a couple weeks ago in Waste Management, Waste Connection. A lot of these things starting to turn about a 12 and a half percent rally in shares of Caterpillar in just the past 10 trading days. So a hundred shares there has you up about $2,400 in just a couple of weeks of trading.
Now here we’ll move on to shares of Pfizer. And I wanted to sort of progress through things in this way where we can see a very similar forecast where that blue line crosses above the black line. But you’ll notice that the neural index goes bearish here, and you get some subsequent, I always look for lower lows over the next 48 hours, but not only do you expect those potentially lower lows to come through, but you have that guidance from the neural networks doing their job intra day and saying, okay well expect for prices to move down towards these predicted lows. You actually see that the predicted low moves lower than the previous day. It does again here, warning you that, okay well, expect prices may want to come back and retest this level. But as long as that blue line is remaining above the black line, well it says the overall trend is up.
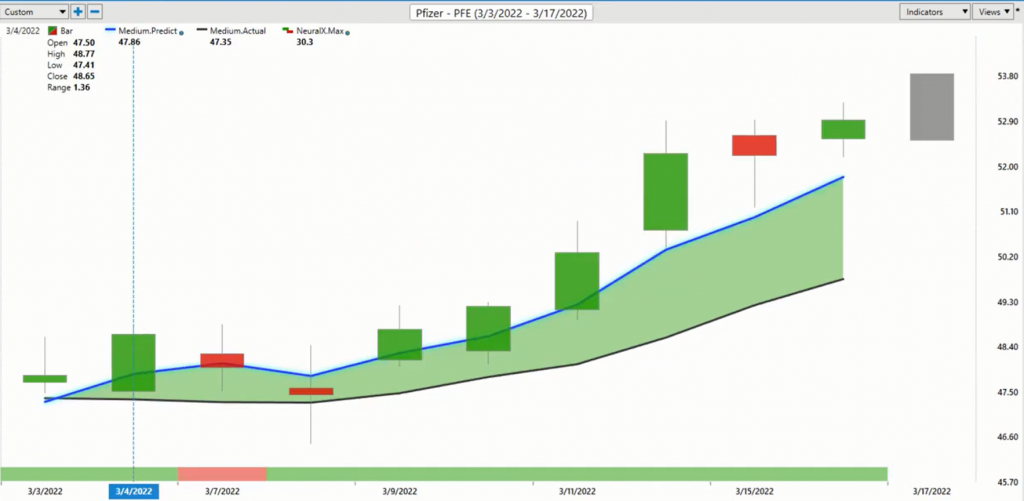
Because the last thing you’d want to be doing is not really going along the market right there where you see that circle drawn in the chart where the predicted low is you see about 11 and half percent move in just the last seven trading days again, a hundred shares there is about $550 in just a couple of weeks of trading so far. So again the important part here is not just recognizing that, okay well there’s been a trend shift, but managing that opportunity effectively. And again, this is where all of these tools work together, whether it be your predicted highs and lows, the predicted moving averages or that neural index at the bottom, letting you know, hey, short term strength or weakness, or when you should you be prepared for that potential dip in the market when potentially you can be getting some much better prices.
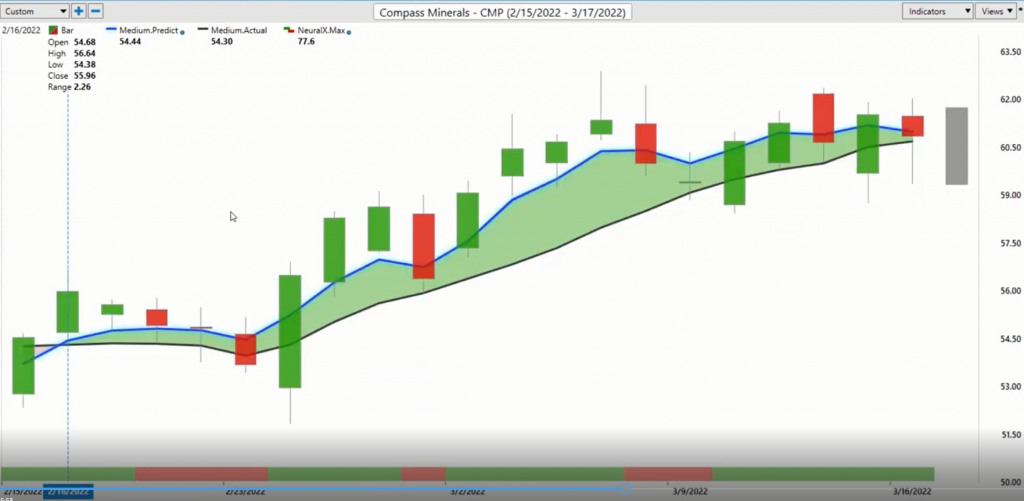
So here’s Compass Minerals and we’ve been all around the basic material space, but I wanted to sort of add some complexity as Caterpillar was a very straightforward chart. We get a dip from the neural index in Pfizer and you see that volatility can really heat up and see in this example, we have the neural index going bearish and the market starts to drift down to these predicted lows. But the blue line never crosses below the black line, right? The overall trend is still up. So you will get these blips where the neural index warns you of that subsequent weakness. But this is where this indicator is getting this right upwards of 86% accuracy on a very large number of markets, commodities, futures markets, stocks. And you can use that, pair that with your other strategies to really improve your effectiveness in the marketplace and understand when to exploit that strength or when to maybe look for that short term weakness in line with your overall strategies here.
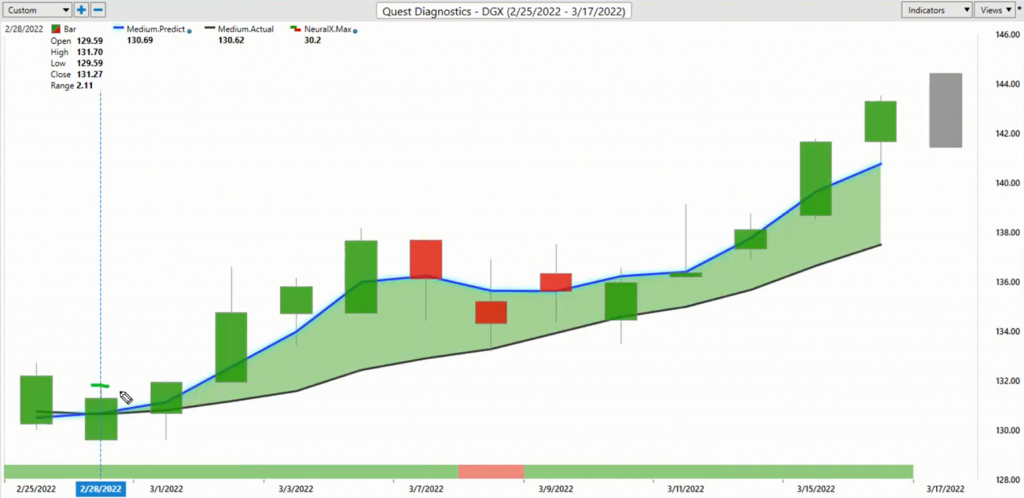
So Quest Diagnostics, again another example here. Much more simple here. You get a cross over the upside. Neural index get bearish here. So letting you know, subsequent weakness over the next 48 hours, but you have all of these predicted high and low levels before any of these trading days. And this is where you can develop systems that work entirely end of day, after the markets have closed, you have all the information that you need to make good trading decisions before the trading day even occurs. So even on days like this, if you have a limit order because you’re ready to buy at that predicted low you’re likely getting filled at the open and then the market’s continuing that trend and making you a tremendous amount of money here. So nice move here out of Quest Diagnostics, but you’ll see that a lot of these charts look very similarly and this is how things occur in the markets. Where we get this, a lot of stocks start to go risk on at the exact same time, certain sectors start to do extremely well.
And you’ve seen a lot of stocks that traditionally stocks had not been doing well in January and February and things starting to potentially turn around there. But the whole point of this is understanding that you may have a 9% cushion here from this nice entry on quest. But it’s those continual updated forecast that are going to help you and understand, hey, should you stay long here?
Or is it time to take those profits and get out of the way and we’re running into some trouble in the stocks again. So nice about 9% moved there again, a hundred shares about $1,200 profit here in Waste Connection. So this is very similar to Waste Management, which we brought in over a couple weeks ago now getting that blue line over the black line. And this is a big area of the market where we see the markets pivot.
So again we can set up things like the intele scan to actually identify on the night when that blue line crosses the black line, not just in Waste Connection, but Waste Management and all those other stocks and understand, okay, well, let’s go ahead and pick our spots, find the areas where we’re getting the most cleanest crossover and the conditions look most favorable to take those long positions. And then you’ve got that roadmap to manage it. So again, you see you get this little pullback from the neural index here, but a lot of separation between this blue line and the black line, and very clearly a pretty strong trend, at least up and to this point. So again, we’ll bring up those predicted highs and lows to take a look at the bigger picture here. You see, you get a little volatility here, big vacuum up and comes back down.
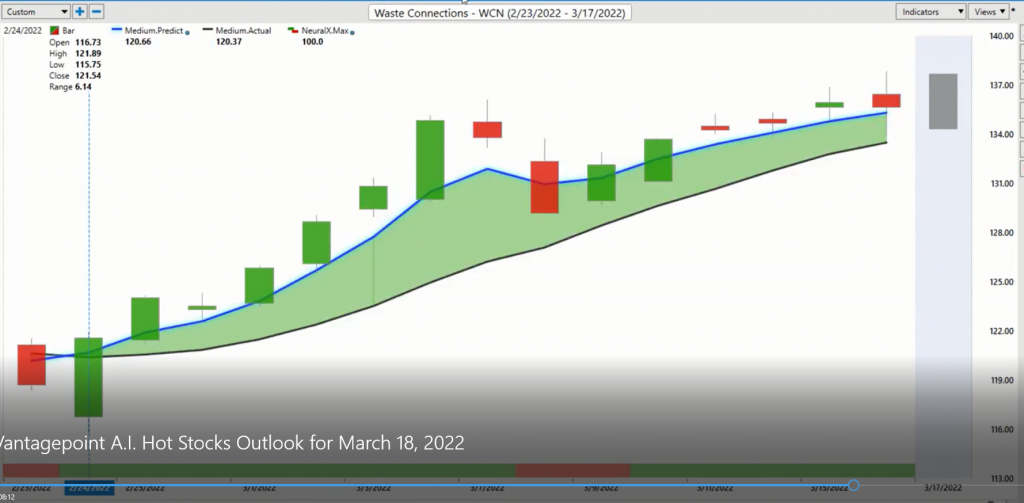
But this is again, what I love about the software is that adaptability and it just quickly gets right back online, getting you very good, predicted high and low levels to make good trading decisions and keep managing that existing opportunity in the portfolio. So go ahead and leave it there. We’ve been focusing mostly on this basic material space. We bring in things like Waste Management a couple weeks ago, and that sort of clues you into this whole pivot that you’re seeing very similarly in many of these other stocks and also the S and P it actually was a few weeks ago where the S and P had bottomed out and has now sort of run sideways on a very big channel.
But that has some stocks doing well, other stocks not doing so well. And this is why you really want to pick those spots and identify, okay, well, where are those strong opportunities, not just in maybe one individual market, but across the sector and in very similar stocks. That’s where typically the best opportunities are going to open up the most manageable opportunities where you can find an easier place to trade where those expectations are met and you can make a lot of money. So once again, I’ll leave it there. This has been the hot stocks outlook for March 18th 2022. Thank you all for watching best of luck, and bye for now.


