The Hot Stocks Outlook uses VantagePoint’s market forecasts that are up to 87.4% accurate, demonstrating how traders can improve their timing and direction. In this week’s video, VantagePoint Software reviews forecasts for AutoZone ($AZO), Kirkland Lake Gold(KL), Barrick Gold (GOLD), Lockheed-Martin(LMT) and Home Depot (HD).
Register for a Free Live Training
Hello again, traders and welcome back to the Hot Stocks Outlook for April 23rd, 2021. Hope you all are having an excellent week out in the financial markets and as always plenty of opportunities to cover here today. So we’ll start out, we have shares of AutoZone. We talked quite a bit about the gold mining stocks. We have a couple of those here as well. Home Depot, which we looked at a few weeks ago and also Lockheed Martin, which we looked at a few weeks ago. So a lot of these examples are things we’ve identified in the markets over the past several weeks, and really where you benefit from the vantage point forecast here is utilizing these tools to help manage that opportunity, right? So when we identify that, “Hey, something going on in the gold mining stocks,” well, then we can use those short-term forecast from Vantage Point, to really make better trading decisions here.
So starting out here with AutoZone, a really good example here of what we have is daily price action. And regardless of which markets you’re trading, this all works off of end of day data. So each one of these candles here represents a full and complete trading day. And you’ll recognize that there’s a black line and a blue line right up against that price data. Now the black line that you see there, that is actually a simple moving average. So a very common technical indicator. What it does, it just looks back at the previous, in this case, 10 close prices, adds them all together, and divides by 10. And that’s a good measurement for us as far as letting us know where market prices have already been over a given period of time, right? It works to smooth out that price data and let us know, “Okay, where are things at?”
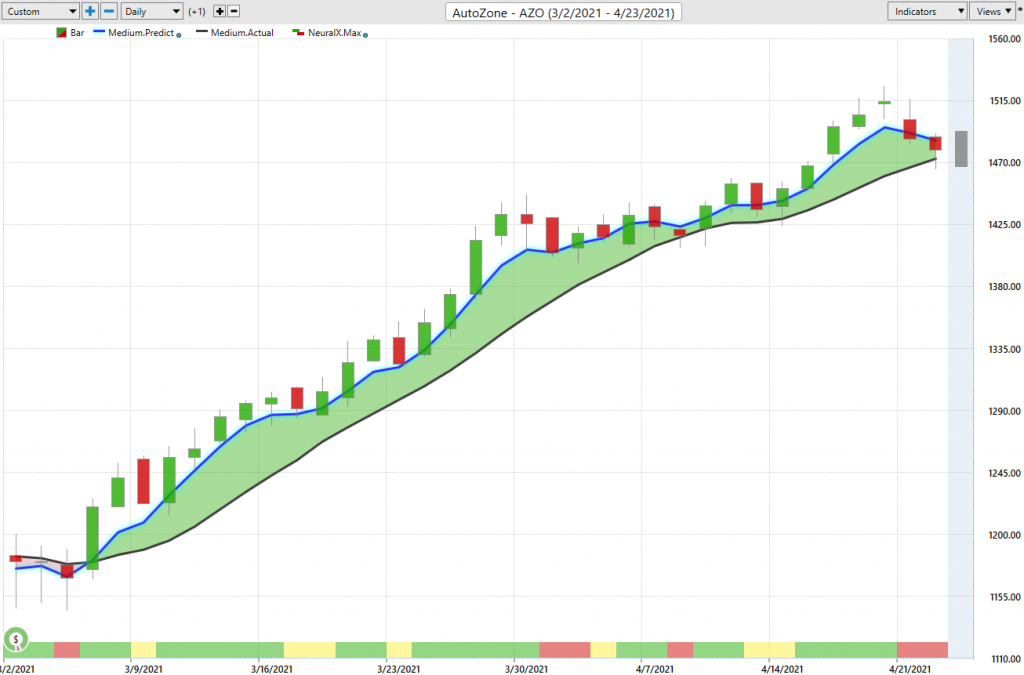
But obviously as traders, we need to understand where things likely to go moving forward. And so to do that, what we’re able to do is actually compare that black value. So that, again, that simple moving average of where market prices have already been, to this blue value. And for that number to then get calculated and plotted against the chart each and every trading day, vantage point is performing what’s called, intermarket analysis. And this is very important because it’s utilizing its technology of artificial neural networks to do that. And so what that means is specifically for AutoZone stock, these artificial neural networks have identified important market relationships, and that can be all over the global marketplace. It can be things like ETF groups. It can be things like individual stocks. It can be things like the broader S&P 500. It can be interest rates, global currencies, commodities, futures markets.
And so specifically to the target marketing question, we want to know, “Okay, which markets are affecting future prices and share important market relationships, and how was that going to affect things moving forward?” So what we’re able to do is actually look at those relationships, calculate a true prediction of where average prices are headed, and use that prediction to actually calculate these predicted moving averages. In this case, the predicted moving average, but also these predictive indicators. If we go to the very bottom of the chart, you’ll see that there’s a line that goes from green to red. And this again is utilizing this approach of looking at those intermarket relationships, and how they affect future price, but over a much shorter term window, just over the next 48 hours, or you can think of that as two candles of strength or weakness over the short term.
And lastly again, to really round out, “Okay, what are these neural networks doing? How are they picking out levels?” Well, we also have a predicted high and a predicted low for the next trading day. So at 6:00 PM the night before, you have a predicted range for the subsequent trading day ahead. So you can set limit orders, set profit targets, and really what happens is you get an overarching forecast here, right? The overall trend direction, short term strength or weakness, and then that predicted high and low range changing each and every trading day. So what we see here with AutoZone is we get this crossover between that blue and the black line. And it’s letting you know that average prices are going to start moving higher. Well, if that’s the case and we’ve got strength over the next 48 hours, well, it’s not a bad time to look for opportunities to go ahead and start getting long in the market.
But as an intraday trader coming in each and every trading day, what we need to figure out, what price levels are we even going to accept? And so this is where Vantage Point you see, each and every trading day is updating these forecasts. So what’s going to happen today, we have this forecast, you see the trading range has moved lower. We have a predicted high and a predicted low, but what’s going to happen is that’s going to get filled with an actual trading day. And so what we can do is look back and see how accurate were each one of these daily predictions against the actual market data that occurred. And you see here that if you come in with that understanding that look, I know I want to be a buyer here. Well, every single trading day, you’re getting these new levels that say, “Look, if you want to be a buyer, what level should you be looking to accept prices?”
And what this does is it really does a great job of generally getting you in at the lower part of the range. You see here, how you have a market that’s trending up, but you’re buying at these shorter term lows here, these intraday lows. Then the same thing here, as the market runs sideways, you have that guidance to say, “Look, where’s the better price levels for you to go ahead and get involved and participate, as that overall up trend continues?” So really nice opportunity here in shares of AutoZone. We’ve seen a lot of similar opportunities over the past few weeks as the S&P has gone higher, here you see about a 22% rally over the past 32 trading days. So what we’ve identified is that you really want to pick your spots in the market. Obviously, AutoZone here, has very straight forward, said, “Look, this is a very strong uptrend, blue line above the black line. Use those predicted lows, if you want to be a short-term trader and benefit off of this 22% rally.”
Now going over to gold mining stocks, this is something more recently we identified, with things like Franco Nevada reversing a while ago and keep moving higher. Well that’s because gold keeps moving higher and therefore these gold mining stocks are performing similarly. But if we want to trade one of those gold mining stocks, we have to come in and say, “Okay, well specifically for in this case, Kirkland Lake Gold, I have my blue line crossing the black line, neural index, bullish here, letting me know, ‘Okay, well look to be a buyer in this market.'” And of course you’d want to say, “Okay, well, let’s use those predicted high and low levels, to help guide us as gold moves higher.” You see here that you get a couple of days where not much happens, but where do you want to be a buyer?
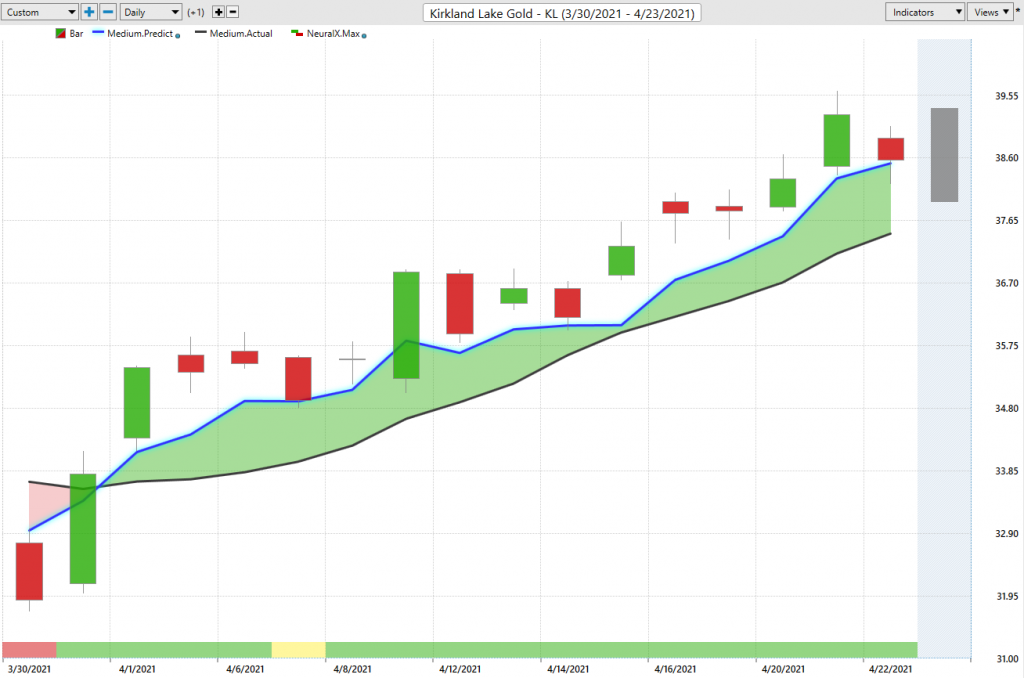
Well, use these predicted lows and you see how perfectly the market actually closes down at that low, but you need to be prepared to buy down at that low, buy at the close, hold overnight, so that trend can continue. And you see you gap up and then things really accelerate to the upside. Again, you see a pullback here hitting the predicted low, but you really just want that guidance that says, “Okay, well, if you want to be a buyer in this sector of the market, on a daily level, where do you want to come in and look to take that position?” So you see her a couple opportunities to the upside. This being very early, as far as when these crossovers have come through, but still a very nice opportunity, right? So if you’re buying down at that predicted low, you’re already up about 12%, and this is just in the past two weeks.
So I really we want to highlight opportunities like this because they really speak to that inner market relationship of yes, this is looking at gold mining ETFs. Yes, it’s looking at gold mining, service stocks, individual stocks, but it’s looking at things like the dollar index. It’s looking at things like the gold futures markets, and we’ve seen the gold futures recover, and that’s had an effect on this target market here in Kirkland Gold. But what you want is that information and that daily predicted high and low range that lets you know, that, “Hey, if gold’s shaken around a little bit, where do you want to come in and actually be a buyer intraday, to participate in those opportunities as that trend and opportunity progresses here?”
So here’s Barrick Gold and this speaks to the scanning for new opportunities.
So when we’re running these scans with the IntelliScan feature in Vantage Point, that looks for new fresh trend shifts in the marketplace, we can actually set that to look for any of our predictive indicators. But what we can do is identify when big sectors in the market are starting to reverse, and so we’ve identified that something’s going on in gold and gold mining stocks, that would be an area where over the past few weeks, I want to come and use my Vantage Point tools and say, “Okay, well, if I want to trade Barrick Gold here over the next few weeks, where do I want to come in and be a buyer?” And you see, this is a great example of how beneficial the Vantage Point tools are. You see days like this, you’re getting really spotty price action, right? So this might be a really illiquid stock and its gapping around, but where do you want that guidance to be a buyer to get in on the lower part of the range?
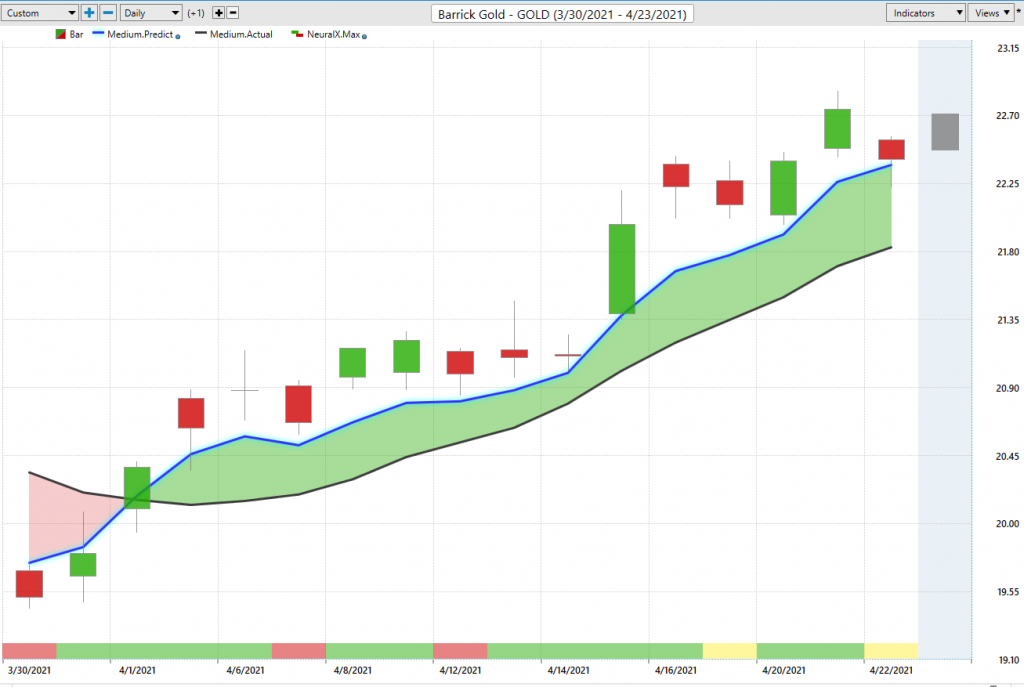
And you see eventually here you get that predicted low, you get hit a really nice fill, and market isn’t even turning back. I mean, pretty much from that point on neural index goes bullish, trend is up and this thing really starts to accelerate to the upside. So again, all of these opportunities are not very different here that we have in gold mining stocks, right? So if you buy one gold mining stock, you buy another one, you’re probably going to have a very similar opportunity. But the point is that this has been a very important area where you’ve seen really aggressive price appreciation in stocks. So if I’m looking for long opportunities in equities and to say, “Okay, well here’s some new opportunities coming through in gold. I can see what’s going on in the gold futures as well, and pick my spots,” and come in everyday with a new level that says, “Look intraday, if you want to add to that position and maybe look to take profit on a shorter term trade, as you’re adding to that position, as it continues, you can use those daily levels to help you along.”
Now, here’s Home Depot. We looked at this a few weeks ago and I often bring through opportunities like this because we’ll often take a look at opportunity that started to trend or is moving. But if that market’s still trending, we want to say, “Okay, well what have those forecasts looked like?” So this is a great example to have a stock and say, “Okay, well, we’ve seen that it’s been accurate so far, but however, the past couple of weeks, has it been accurate as far as those predicted highs and lows?” And you see here very strong neural index over the past couple of weeks. We do have a neural index bearish here, so potential for some sideways up here about 325 on Home Depot.
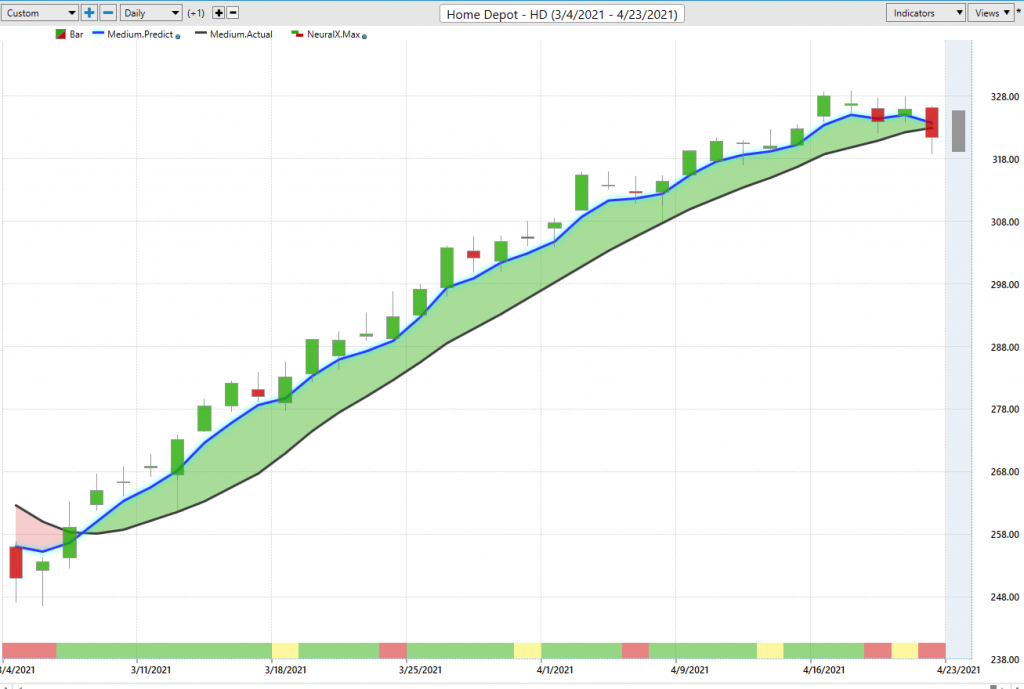
But very clearly here, if we look at these predicted highs and lows over the past couple of weeks, you again see that, okay, well, here’s a strong uptrend. We know Home Depot’s in an uptrend. Well, if I’m hanging out down at these predicted lows, those would be the levels where I’d want to go ahead and get involved. And you even see over this very short-term period, even if you’re a buyer here, you come up the next trading day, hit this predicted high, and you can do that trade management. So if you’ve been adding to the position all along the way, buying down at these predicted lows, targeting a predicted high, and of course keeping potentially that overall core position of the overall trend, as long as that blue line remains above the black line, the trend is still up, the trade is still on, and you can maintain that position. But, over the past couple of weeks, there’s been some good opportunities to add to that position and take some profit as this trend continues to the upside.
And all that’s going to do is essentially be like short-term trades where we’re taking profit, taking profit, and maybe continuing with this longer term trade they’re just letting run, as long as that overall trend continues.
Now here in Lockheed Martin, we looked at this a few weeks ago and I just wanted to highlight what things look like when a trade ends here, right? So here’s Lockheed Martin, we had this crossover to the upside, blue line over black line, neural index bullish, and we looked at this a few weeks ago. You see that your neural index gets a little bearish here, you get a little sideways action.
But look at that blue and black line, I mean, a lot of separations saying, “Look, the overall trend is up.” You’d only want to be long and take profits on long. Sure, you’ll get these periods like this, where neural index says, “Be aware of some weakness over the next 48 hour periods potentially, you see on this one, we just go straight higher, but clearly, only wanting to be a buyer in a market such as this. So again, we can bring up those predicted high and low levels, it’s a very clear shot up. It says, “Look, if you want to be a buyer here, you’ve got these levels for your predicted lows that you can just have a limit order waiting, right? Just let the market do what it’s going to do, eventually it’ll come down and fill those orders. But you see that all these opportunities, 1, 2, 3, 4, 5, 6, 7, 8, 9, 10, 11, 12, about 13 opportunities to be a buyer in this market, as the trend continues over a longer period of time.
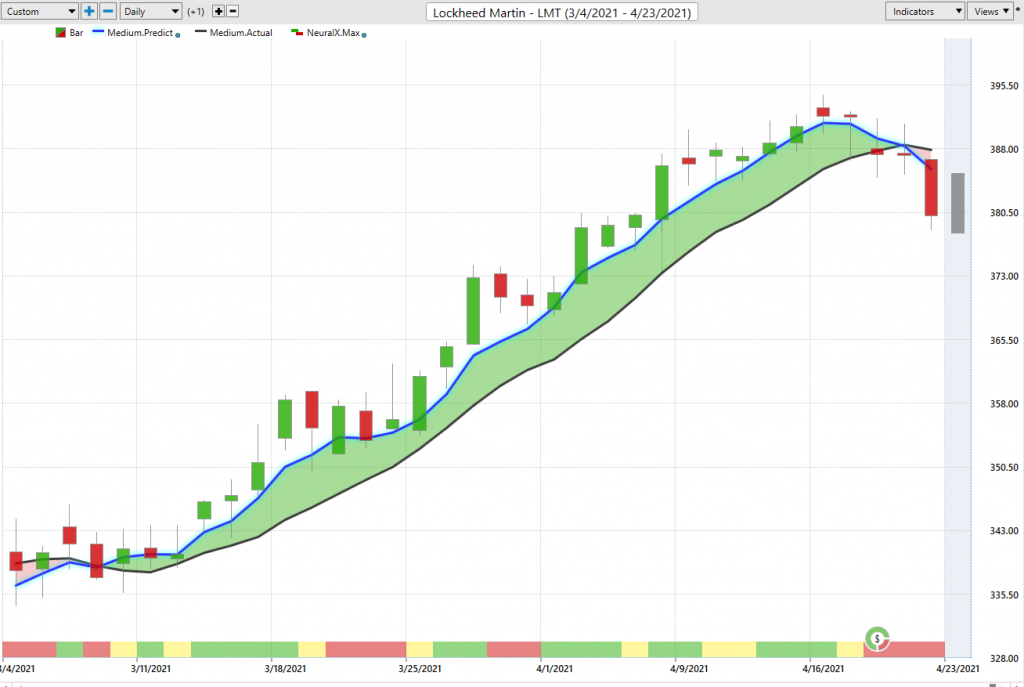
And we see that we can kind of look at the overall move here, about 10 opportunities in there over about 30 trading days as the market moves up, about 15%. But you can see very clearly here that that blue line has shifted below the black line. You also see even from back here, the neural index is warning you, look out for cheaper prices. So even if you’re a long there, you may say, “Look, let me get out of the way, look for cheaper prices here,” and then recognizing, “No, this isn’t the opportunity, let’s get out of the way.” If anything, maybe potentially look to short up towards those predicted highs. But again, one of these areas where Lockheed Martin potentially shifting here, Home Depot still in an uptrend, Gold Miner, still an uptrend. So you can identify how to construct that portfolio, and when it’s time to go ahead and step aside from other opportunities, take your 15% and move on.
So again, just another Hot Stocks Outlook here again today for April 23rd, 2021, and just a good time to highlight a lot of these different examples. We’ve had a very mixed market, some things doing very good, some things doing very poorly. We sort of saw gold start doing well, oil doing poorly. And that’s led to some of those oil stocks and things related to just the broader equity markets actually falling off and not doing so well. So you really want to pick your spots in the market and that’s been very, very profitable, right? So when you identify that, look, over these past few weeks, AutoZone, great area to be in the market. You look at the Russell 2000 Index, and a lot of those stocks have really had problems, run sideways, sold off and been places you want to avoid. We’ve highlighted a couple of those over the past few weeks as well, as far as those bearish opportunities. So once again, have a great rest of the week, everyone. This has been our Hot Stocks Outlook for April 23rd, 2021. Thanks again, and bye for now.