Register for a Free Live Training
The Hot Stocks Outlook uses VantagePoint’s market forecasts that are up to 87.4% accurate, demonstrating how traders can improve their timing and direction. In this week’s video, VantagePoint Software reviews forecasts for SPDR SPY($SPY), Amazon ($AMZN), D.R. Horton ($DHI), Franco-Nevada ($FNV), H.F. Sinclair ($DINO), Apple ($AAPL). Xencor ($XNCR)
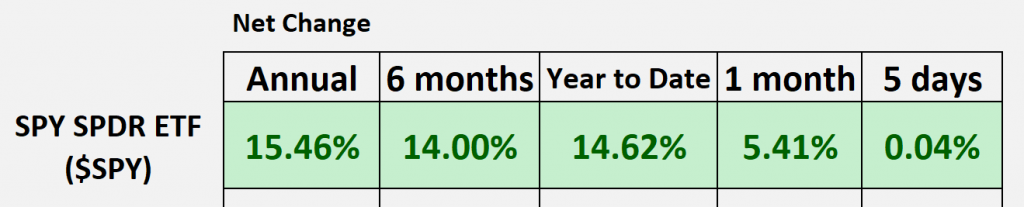
SPDR SPY ETF ($SPY)
Hello again, traders. And welcome back to the Hot Stocks Outlook for June 23rd, 2023. I hope y’all are having an excellent week out there in the financial markets. And as always, we’ve got plenty to cover in this week’s outlook.
So as we typically do, we’ll start by taking a look at the past performance of the SPY ETF. But if you haven’t already, make sure you go ahead and click on the link in the description below. You get a live demonstration to learn more of the specifics about how this technology can help you make better trading decisions day in and day out in the marketplace, really regardless of which markets you’re trading.
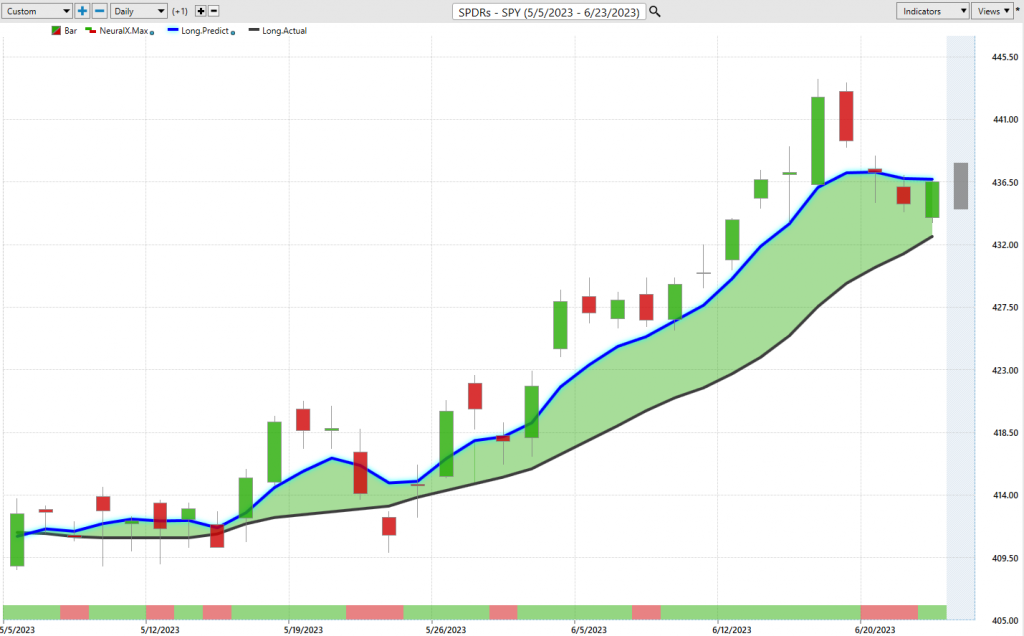
So we look back over the SPY ETF, where we can see that we’ve really done really well if we look back over the 12 months, six months, year to date. But what we’re starting to see is really the range expands. So over the past couple weeks, we’ve been really bullish highlighting a lot of these great opportunities.
But what’s going to happen is you’re going to see that range expansion, a lot more volatility. So this is why you really want to be prepared for this because the further and further you get away from a trend, the bigger and bigger that range is likely to get.
So as we look at the SPY forecast, here, we can see since that last VantagePoint forecast to the bullish side, we’ve had about a six or 7% rally, but there’s a lot of really nice opportunities within equities here. So we’ll start out looking at shares of Amazon. We’ll look at Apple, which we looked at last week, DR Horton, and how there’s a very mixed nature to the market, right? We’ve got a lot of these leaders really leading the way with the index. But like I said, when that volatility heats up, you want to be careful and really pick your spot.
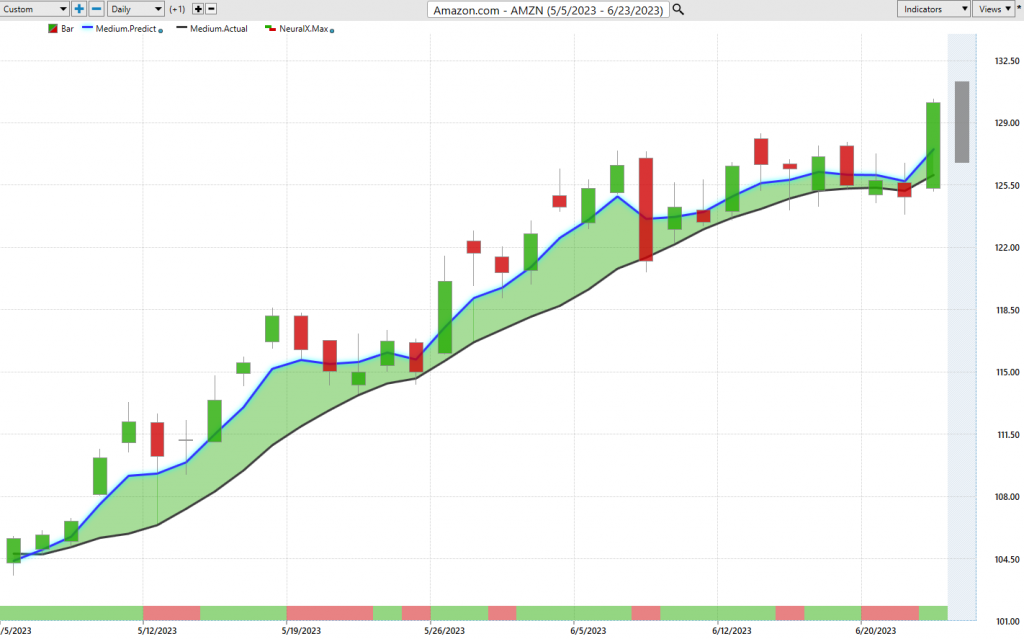
So what we have here with shares of Amazon is daily price action. So each one of these candles represents a full and complete trading day. And so, it’s right up against that price data that you’ll see that there is a blue line and a black line value there.
So what that black line value is, is actually a simple moving average. So this is a very common technical indicator, and we can really think of this as the baseline, really letting you know where market prices have been. But the problem with tools like this is that all the data that constructs that moving average really comes from the past. So it really just gives us that baseline of where market prices have been over a given period of time.
So in this instance, it’s about a 10-period simple moving average. And what we’re able to do is compare that value to this proprietary predicted moving average. And so, for that number to get plotted and calculated for the trader every evening on the chart, well, this is where the technology of artificial neural networks are performing, what you call intermarket analysis.
So artificial intelligence obviously needs data to generate its predictions and you really want relevant data to generate good predictions. And so, what we’re able to do is look at markets that are known to drive and influence the future share price of amazon.com, looking at all that market data that comes in every evening.
So this will be things like broader market ETF groups that group up a lot of tech stocks or retail stocks. This can be really individual names within the equity space, but it gets very important when you look at things like the gold market or the value of the dollar index or interest rates or the value of oil contracts.
And so, it really looks at this global approach, looking at really dozens of markets that are known to influence specifically here the target market you’re interested in, so amazon.com. And so what it does, is it takes all of that information and generates highly accurate predictions about future price. And it’s that data that is used to generate these, what we’d call, predictive indicators.
And so what we have is a predicted moving average. Whenever that blue line crosses above the black line, it’s an indication to the trader that we should expect the market trend to start moving higher, those average prices to start moving up relative to where they’ve been.
So we see here that over the last 32 trading days since that forecast came through, you got a 24% rally in shares of Amazon. But what we look at every week is really the entirety of the forecast. So if we come to the very bottom of the chart here, you see we have this bar that goes from green to red. And again, this is getting updated at the most recent trading close.
And so this is forecasting with that same technology and utilizing those same set of intermarket to generate those forecasts. It’s tuned to solve a different problem, and this being a very short-term strength or weakness forecast over the next 48 hours. So we have that prediction of overall trend direction with the predicted moving average. But this really helps us anticipate short-term strength or weakness within that trend.
So this is why this is really exciting, is we can see that neural index go bearish and we see we typically get the market sliding or running sideways over the subsequent 48 hours of price data, but the overall trend is up. So the trader wants to say, “Okay. Well, I still want to remain long here.”
And so when we really look at all these forecasts every single week, well, of course, we want to look at the predicted high and predicted low. So now, we’re down to intraday values that have a separate neural network picking the high out for you and trying to find the low out for you so that you can really be prepared to execute your game plan and really be ahead of the market.
So as we look back at all those previous predicted highs and lows, and we see that once this trend gets started, well, where do you want to be looking to buy the market? Here, the neural index gets bearish. Well, maybe look towards the predicted low to be a buyer. And you see that works pretty excellently. Again here, neural index gets bearish. Look for weakness over the subsequent 48 hours. Where should you look for that because down towards the predicted lows, what happens from that point, the market resumes its trend. We have another level hit here, hit here.
I actually wanted to show you this period right here because it’s very interesting in that this is a weekend and you really see what happens here is the price data goes all the way to the bullish side, and these levels never get hit. So that’s what I mean is when the trend starts to get going, the range will expand, and you’ll get these sort of days like this, but you really have all those levels even ahead of time. And then, you see, again, the trend resumes.
And so even just this last week, really nice predicted low levels hit and obviously hitting any of those price targets that you might have been aiming for as a short-term trader and as a trend trader hitting new highs here.
So really nice opportunity here in Amazon. And just going through each of these indicators, so you can really think about, “Okay, well, what is my trading style? What is my timeframe? How can I benefit off of these predictive tools to really make that roadmap for you and guide the way?”
So there’s Amazon, a really robust view of how all these tools work together. And what I like to do is every week go back and review many of these markets that we’ve brought in previous weeks. So here’s Apple, right? Maybe, you’re looking for new markets to trade. You’re looking this week on how should I look to position myself?
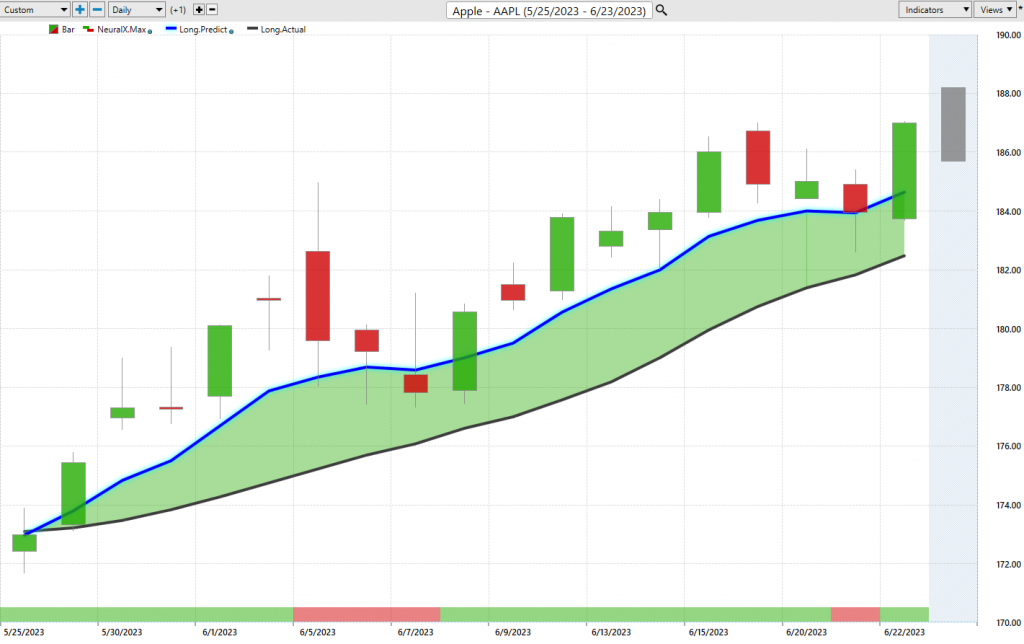
Well, Apple’s in an uptrend. We have Amazon in an uptrend. We know the SPY’s in an uptrend.
So with Apple here, we can utilize these tools like the predicted neural index, predicted highs and lows. And you see this last week, we say, “Okay, well trend very bullish, a lot of separation between that blue line and the black line,” and look towards VantagePoint predicted lows essentially that say, “Okay, well down here would be good places to maybe scoop up some shares.”
And again, you see those profit targets being hit as we get that really nice advance, again, another week, moving a little bit higher here. So shares of Apple, again, doing well, working out for the trend trader, again, shorter term trader really benefiting from the output from these forecasts, about a 7% rally, 8% rally about 18 trading days.
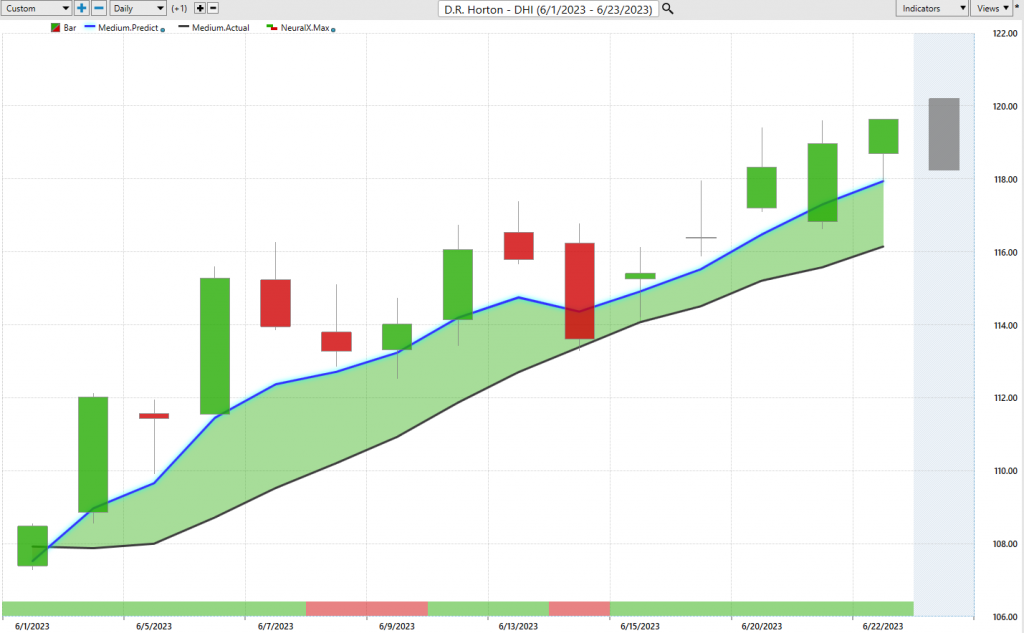
The Home Builders have all been doing really well here. So again, we see this last forecast, blue line crossing above the black line. Neural index, very bullish. But you see here that, okay, well expect some weakness over the 48 hours, expect some potential sideways price action, but you only want to be long and taking profits on long positioning and potentially using things like your VantagePoint predicted lows to identify those intraday levels to actually go ahead and scoop up shares.
So I love days like this where if you have a limit order waiting down at that predicted low, you’re very likely to get filled at the open and shoot towards that potentially short-term profit target there.
So again, really nice move here. Really all the Home Builders doing quite well. But now, let’s go ahead and transition a little bit, highlight how, yeah, the strength in the market is really in those obvious places where you see a lot of momentum and these forecasts looking very bullish, but there have been some warning signs.
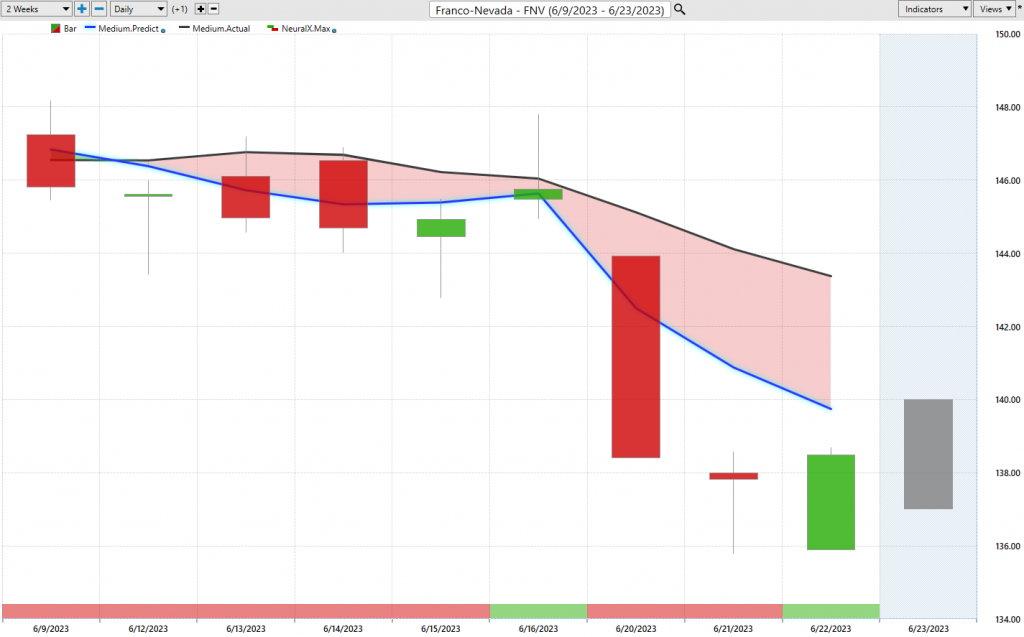
Now, if you trade commodities in the gold market, well, here’s shares of Franco-Nevada, and things have been struggling in gold and silver and some of these other areas of the market. So you see that blue line crossing below the black line, neural index very bearish here. We do have a blip there, but you can’t get long here. The overall trend is down. You only want to short take profits on shorts. And again, you can see, okay, well, if you’re looking to short the gold market, well, on this individual stock, Franco-Nevada, or get short in this space, these are the levels that you really want to look for.
And we see, again, as the dollar advances and gold declines, well, it causes this market to go aggressively lower here. So again, we can take a look at this percentage move so far. We’ll just get the gist of it here with, about a 6% drop. But that’s all this week, just in the past few trading days here.
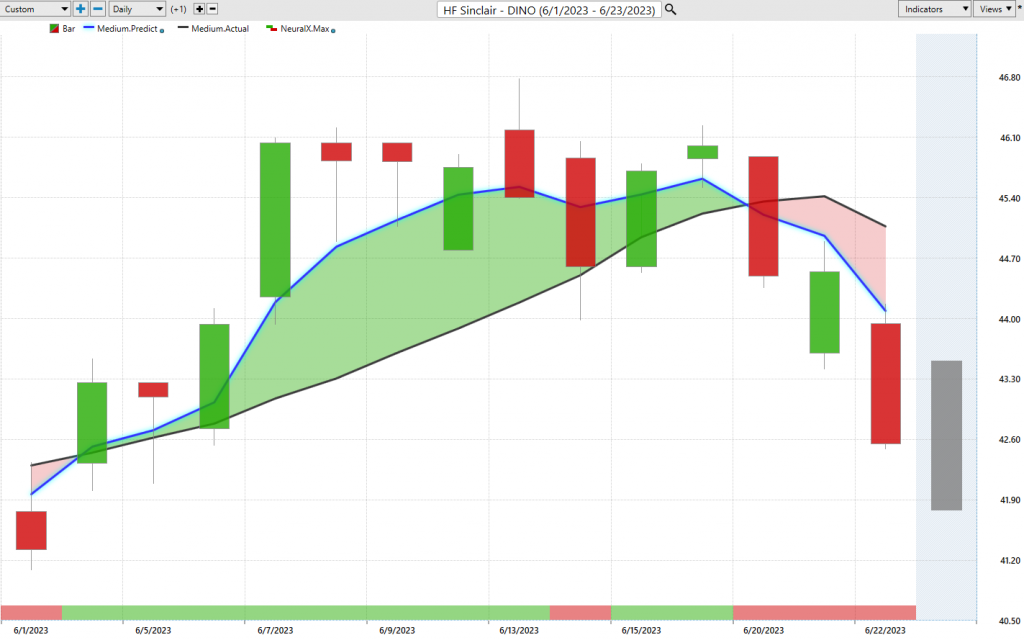
A couple weeks ago, we brought in HF Sinclair. And if you watched this forecast, you can hear it in my voice that you want to be real careful around energies. This is not as clear as it seems, and we’ve seen energies really fall off here. But if you wanted to take a stab at it, a lot of these refineries were looking a lot better, and those really advanced quite well over the past couple of weeks. And so, this opened up a really nice opportunity here in HF Sinclair. We see that blue line crossing above the black line.
We have our predicted highs and lows coming in. And so, you’re able to get a really nice entry into the market, but we’ve seen the market shift here. So it’s about an 8% rally from where that starts out. And you see, as the market starts to settle sideways, there’s even more trading opportunities to buy at the market, take profit, buy the market, take some profit. But we see that weakness start to slip in.
And so, it becomes very clear that, look, you’re done, right? You don’t want to be buying this market anymore. If anything, reverse that position short, take profits on shorts, and we’ve seen oil start to decline and a lot of weakness out of the space. So that trader, that short-term trader and the long-term trader, making trade adjustments can be ahead of that.
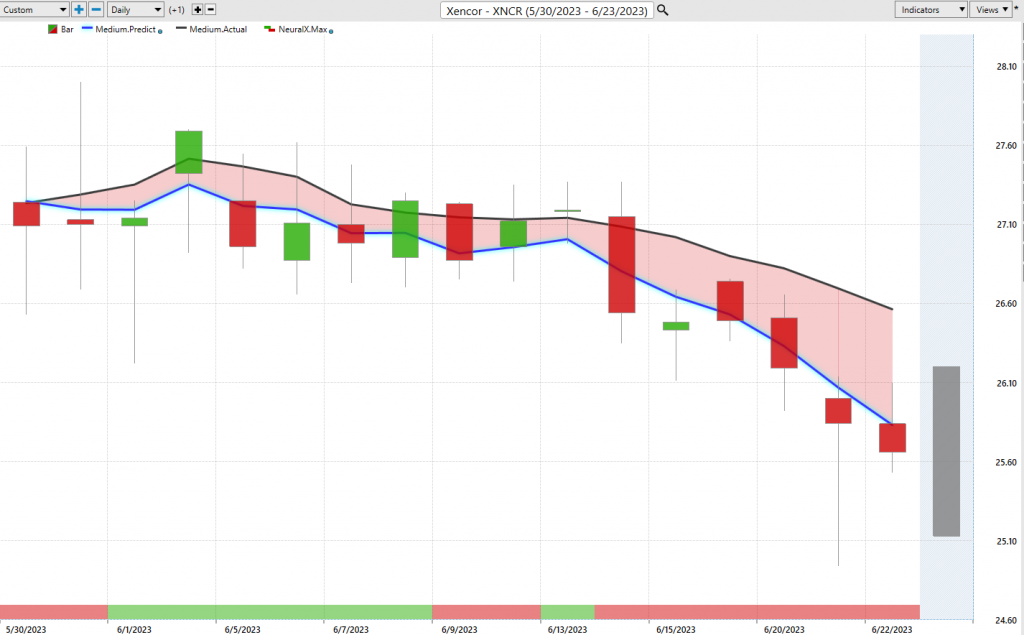
Lastly, again, just some generalized weakness is really in the biotech pharmaceutical space. So here we have shares of Xencor, and again, just a great example of the indicators each on an individual basis doing their job.
So here, we have that blue line crossing below the black line, and you see that we get really almost a couple weeks of complete sideways price action. And you see what’s going on here is the trend is lower, but you’re going to get that strength over those subsequent 48-hour periods. So you don’t want to be getting long. If anything short, take profits on shorts, but don’t expect this to immediately collapse. It may need to run sideways. It’s very likely to move up towards VantagePoint, predicted highs.
And so as a trader, you’ve got all of this daily information being updated really every single day that says, “All right, if you want to short in the biotech space, well, maybe use VantagePoint, find where these forecasts are highlighting some bearishness,” and then fire away, get some of that positioning to contrast maybe the bullishness that you’ve identified.
You’ve really insulated yourself quite well regardless of what we see here as far as overall volatility in the marketplace. So again, share’s off about 6% here, but many opportunities as you see that sideways period to take some really nice chunks out of the market here, right? Short the market, target the predicted low, yeah, we can kind of get a sense of this about a one, 2% move.
You get another move here, moving down to these predicted lows, eventually hitting there, and then just re-shorting and re-shorting at better price level.
So I’ll go ahead and leave it there for today. But really exciting things going on in the marketplace, tremendous opportunities opening up in a lot of different sectors, but it’s moving very quick, and the sectors are rotating very quickly. So if you’re in the wrong things, you can really get hammered and not really be in a great space, even though the S&P and the broader indexes are doing quite well. So once again, this has been our Hot Stocks Outlook for June 23rd, 2023. Thank you all for watching. Best of luck, and bye for now.