Register for a Free Live Training
The Hot Stocks Outlook uses VantagePoint’s market forecasts that are up to 87.4% accurate, demonstrating how traders can improve their timing and direction. In this week’s video, VantagePoint Software reviews forecasts for SPDR SPY($SPY), Nike ($NKE), Carnival Corp ($CCL), Adobe ($ADBE), Cleveland Cliffs ($CLF), Jabil ($JBL), Apple ($AAPL).
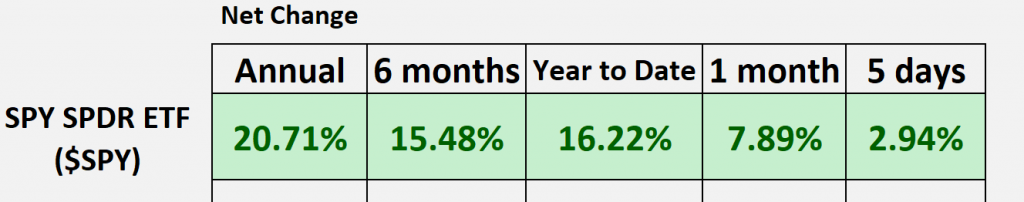
SPDR SPY ETF ($SPY)
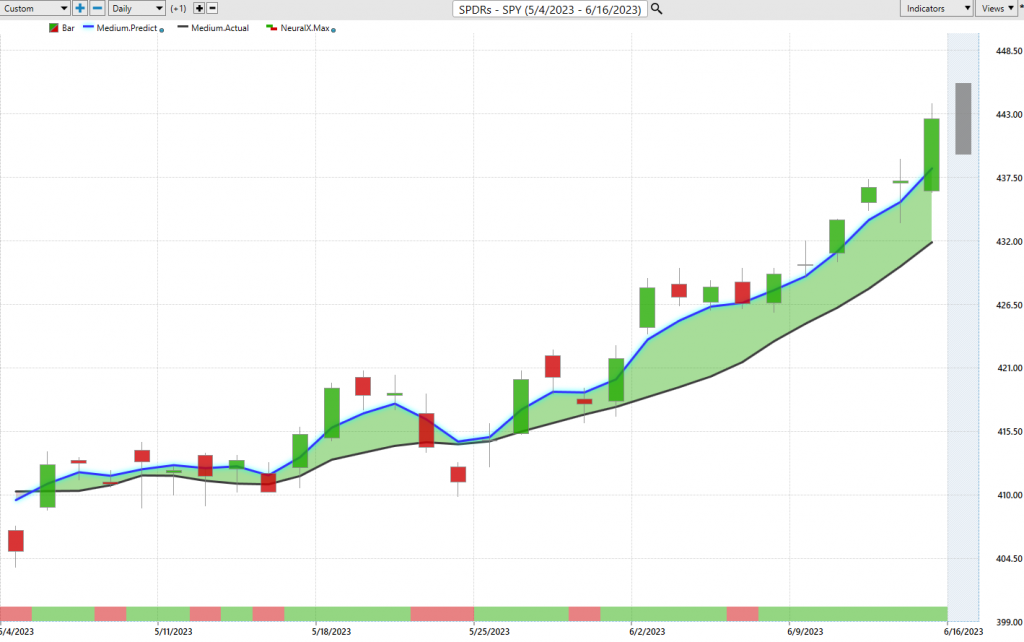
Hello again, traders, and welcome back to the Hot Stocks Outlook for June 16th, 2023. I hope y’all are having a excellent week out there in the financial markets. As always, we’ve got plenty to cover in this week’s outlook. So let’s go ahead and jump right into things. Now, as we typically do, we start by taking a look at the SPY ETF, and as we look at the chart here in the VantagePoint forecast, well, we can see that well, what’s happened really since that last Hot Stocks Outlook… And I’m getting very excited about all the new opportunities opening up on the bullish side. Well, we’ve got the SPY up about 3% over the past five trading days, and like we typically do, let’s look at those predicted highs and lows from the SPY forecast. And we can see this week, well, dipped down here Wednesday, and really benefiting from that monster rally we had on Thursday, you see about 2%, just there in the past two trading days.
So, as we typically do, we can look back over the past 12-month period and say, well, we’re actually up about 21% now, going back 12 months. Obviously a lot of that rally starting at the beginning of the year, and now really seeing things pick up. And so really it seems like the markets were being led by a lot of those big stocks, the Microsoft, the Nvidias, all that, and some stocks were performing poorly. But what we’ve noticed recently, really with the help of things like VantagePoint’s Intelliscan, is that it seems like the rest of the market has started to shift, and that’s why last week it was like, look, there’s a lot of bullishness coming in, get prepared for this, and that’s why going through this week we can use VantagePoint’s shorter term tools, that we look at each week, like the Neural Index predicted highs and lows, to make the most of these opportunities.
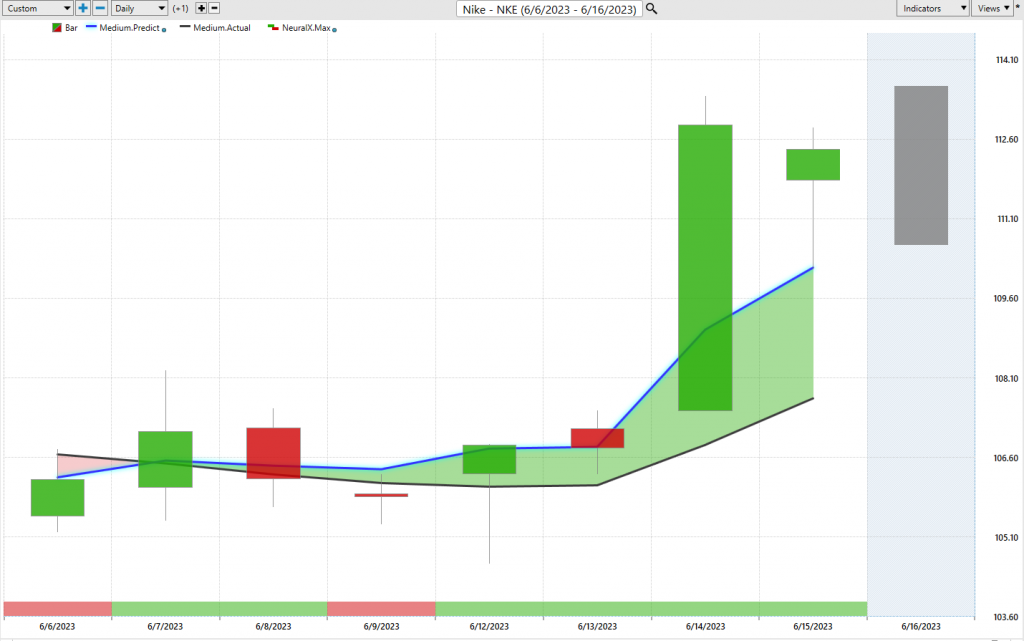
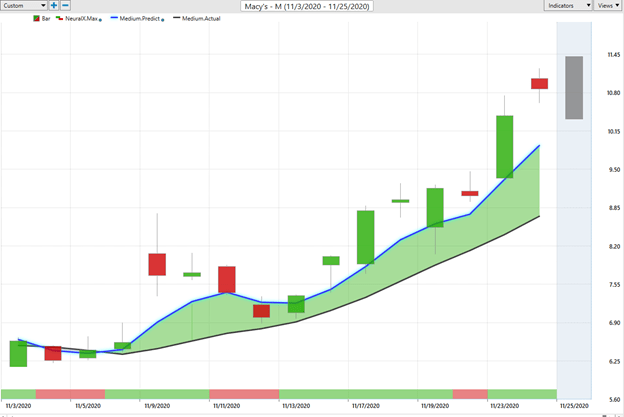
So, starting out with shares of Nike, really explaining how all this works. So what we have here is daily price action, right? Each one of those candles that you see represents a full and complete trading day, so you can see this is just going back about seven or eight trading days. And so right up against all that price data, what you’re going to notice there is that there is a black line and a blue line value. Now, the black line that you’re seeing there, that is a simple moving average, this is a very common technical indicator, in this case, it is a 10 period simple moving average. So add the last 10 closes together, divide by that number, and what it does is smooths out the existing price action for traders, let us know where market prices have been over a given period of time.
But what traders using VantagePoint are able to do is really compare that value to this proprietary predicted moving average. And so for this number to get calculated and then plotted for the trader every single evening, this is where the technology of artificial neural networks come into play, and they’re performing what you’d call intermarket analysis. So what that means is, specifically for shares of Nike, there are known markets that are known to drive and influence future share prices. So, that can be things like retail ETFs, that can be other individual stocks, but this goes all the way down the line to things like the value of the dollar index, global interest rates, the value of oil, copper, crude oil prices, gold prices… And so it’s looking at all of these global market relationships, essentially that’s the data being used to generate these extremely accurate future forecasts.
And so, what the software is able to do is generate these essentially future price predictions and use those values to construct these indicators. So, then what you get is rather than just tools that get dragged around by what’s already occurred in the market, we have a forward-looking predictive tool. And you see with shares of Nike here, we have that blue line value crossing above the black line, indicating that, hey, there’s likely been a shift here in shares of Nike. And so again, we’ve seen the leaders leading the way, right? Adobe, Nvidia, these really big stocks, but that’s where the Intelliscan comes in and really clues us in that we’re actually seeing more of these crossovers to the upside. Now, since that blue line has crossed above the black line, well, we can see just like the SPY, really most of this coming through over the past couple of trade days, about a 5.5% rally there, but this is where VantagePoint’s really suite of indicators come into play.
Our Neural Index at the bottom here, which goes from green to red, and then the predicted high and predicted low range, which you’re provided with each and every trading day. So again, what we’re going to get today is a, we’ll get the actual price action, it will fill in this candle, and we’ll see how accurate those predictions were against the actual market data that occurred. And so this is what we do each week is we look back and say, okay, well, if you were looking at shares of Nike and looking for places to accumulate a position, well, these levels are updated for you. So after this trading date, it says, expect the range to go a little bit lower. All right. Expect the range, actually this predicted low to come higher, and this is where you should be accumulating a position down here at, looks like about 105, 106, and seeing shares now accelerate.
But this is critical, and so again, what we’ve seen is certain markets leading the way, dragging the indexes up, but then when everything else comes around and participates, well, what are you going to get out of the indexes? A really nice rally, and that’s exactly what we got.
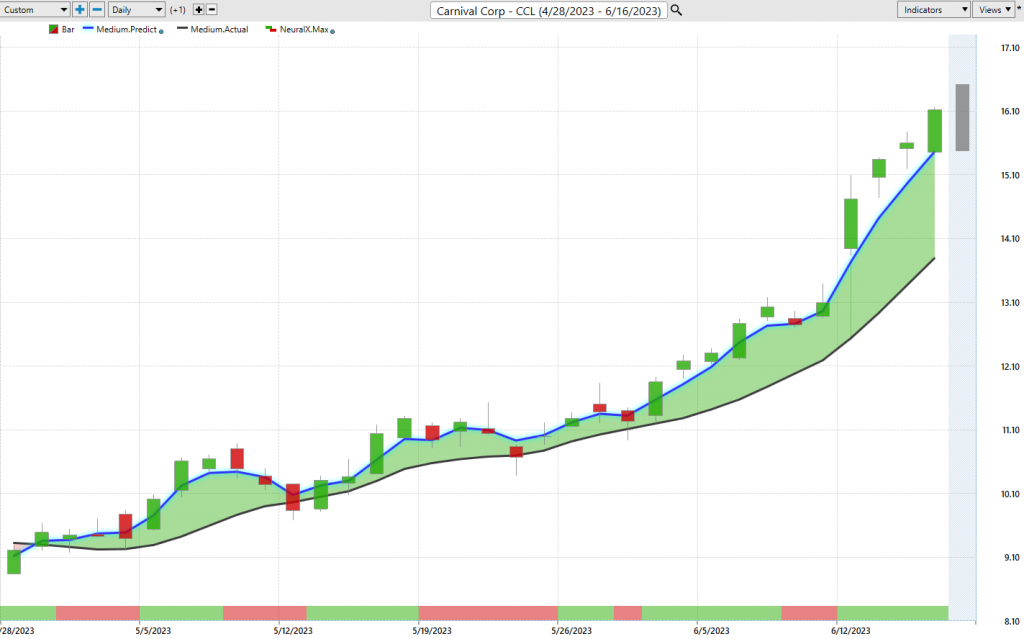
So, last week we also looked at Carnival Corporation. And again, why you want to recognize those shifts early on, like in shares of Nike? Well, when you recognize shifts just like that in Carnival Corporation, well, we went over this last week, of using the predicted highs and lows to accumulate a position, and well, since the last forecast, well, you’ve had quite the rally here.
So this is actually going back to Friday, really well before this gap up. These forecasts are made really after Thursday’s data, this low red candle here, and so we can see a 25% rally just in the past five trading days. And so traders utilizing this software can accumulate a position, again with help of things like VantagePoint’s predicted lows, that say, yeah, be adding to this position, and so when we get to this point, we actually see that, there’s Thursday, probably another addition into the market, and this market just really starting to accelerate as the broader markets were doing well, the bigger stuff, and then everything comes and participates, and you see this really beneficiary here, at Carnival Cruise Line.
So, now this rally takes up about 72% in the past 33 trading days, and we’re not done yet. Here’s shares of Adobe, this a lot more straightforward, right? Blue line above the black line. A couple little blips where that Neural Index will get bearish, and so what the Neural Index is forecasting is just very short-term strength or weakness over the next 48-hour period. So you can think of that two candles ahead, short-term strength or weakness, and what we’ll often see is that you see that you get the move where the market moves lower than the previous close. You see it again here, you actually get a little bit of a gap down, a little bit of a move lower, but the overall trend extremely bullish, and you see the Neural Index for the most part, extremely bullish.
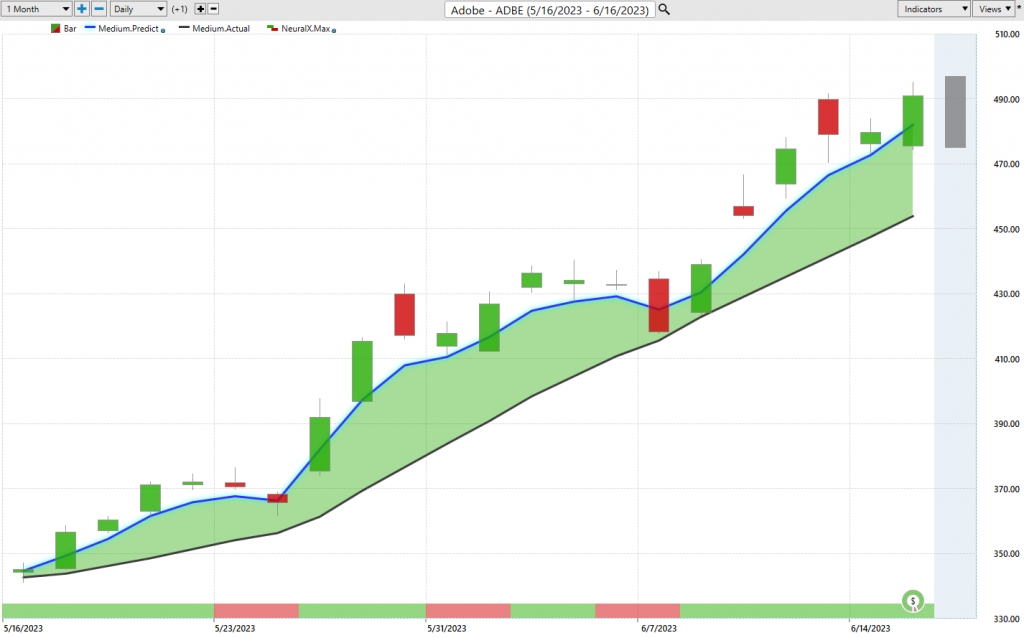
Just like the Tesla forecast we looked at last week, well, what have we seen here over the past week with shares of Adobe? Well, here you see a little bit of price action on Friday, market moves up, and then we gap up going into the week and really things starting to accelerate here. So about a 16% rally just over the past really week here, but a much bigger rally, about 42% move, over the past 22 trading days. And so this is just a great example of things like Adobe, already in that rally mode moving higher, and then you have some of this other stuff in retail start to move higher, and we’ve got ourselves a stock market rally.
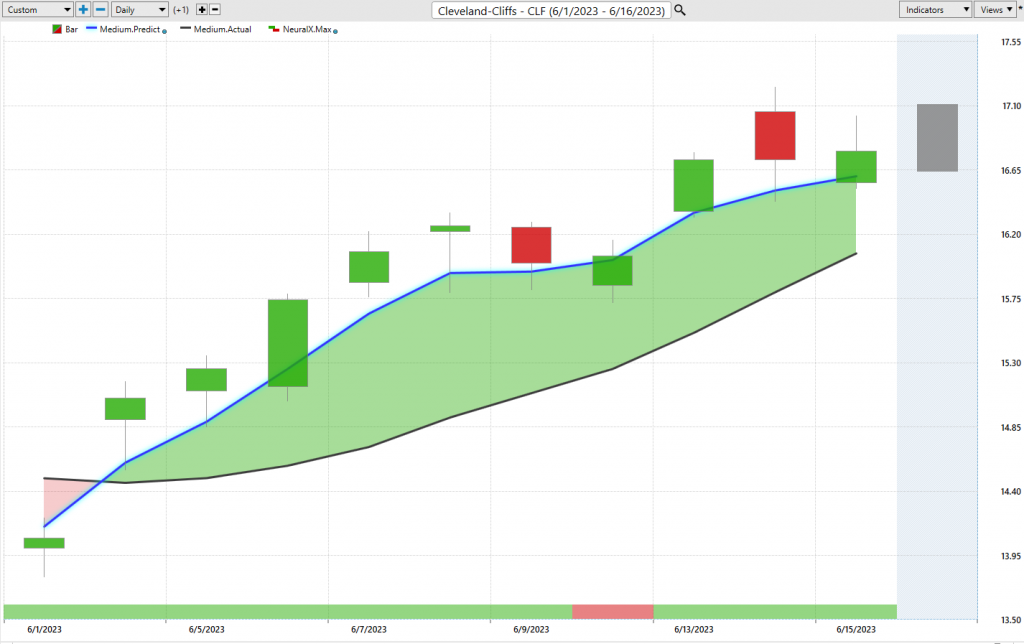
Here’s Cleveland Cliffs over in steelmaking [inaudible 00:07:18]. So these shares had really been pushed lower, really across the steelmaking space, and we’re starting to see things come back again, all over the place. So here you see that blue line crossing above the black line, Neural Index very bullish over the duration, and again, I just wanted to bring through more of these recent forecasts.So we’ve got those markets that have been trending, but now we’re seeing things shift and a lot more markets in uptrend.
So you see here, just over the past five trading days, about four out of the six trading days, you’re getting towards that predicted low, and the market then moving higher there in shares of Cleveland Cliffs. And this is pretty cheaply priced stock here, we’re down to about $16 per share here, since those forecasts have gotten bullish, about a 12% rally, again, just in the past 10 trading days, so the past couple of weeks here. Here’s shares of Jabil, again, really good example of identifying these trends early, once you identify where those areas of strength in the market are, well, you can use things like the Neural Index, VantagePoint’s predicted highs and lows, to manage the position.
But you see in these markets where there’s been strength and in the short term that excessive strength coming in and really seeing really these markets just pick up, right? The rally, just really pick up steam here.
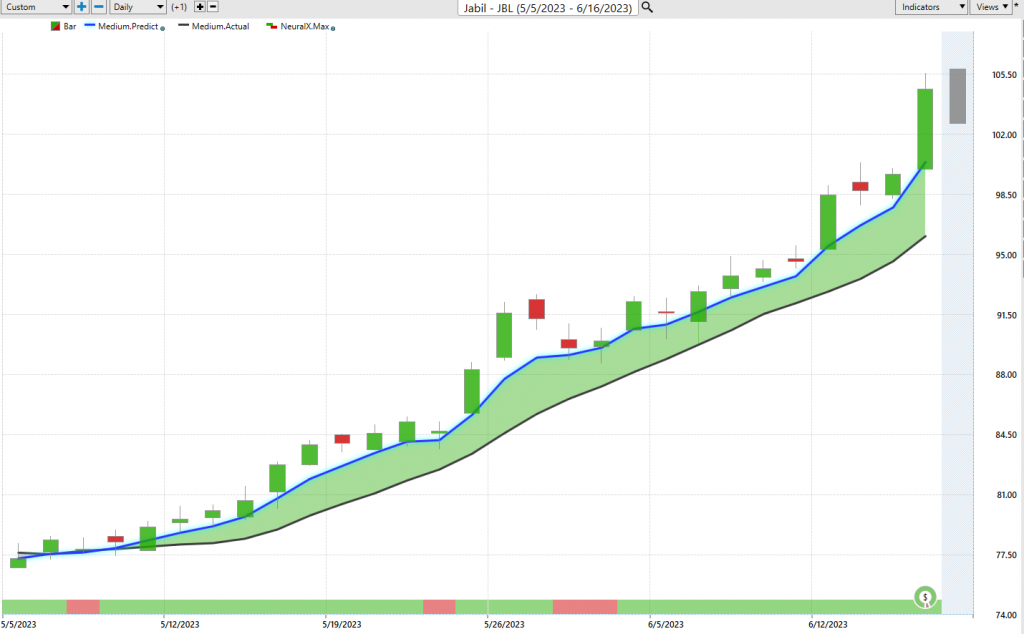
Here’s shares of Jabil, we can see markets up about 32, 33% over the past 25 trading days, but over those 25, 26 trading days, you’ve had 1, let’s see, 2, 3, 4, 5, 6, about six entries on the way up, and you just see not even a blink of weakness there out of the VantagePoint forecast.
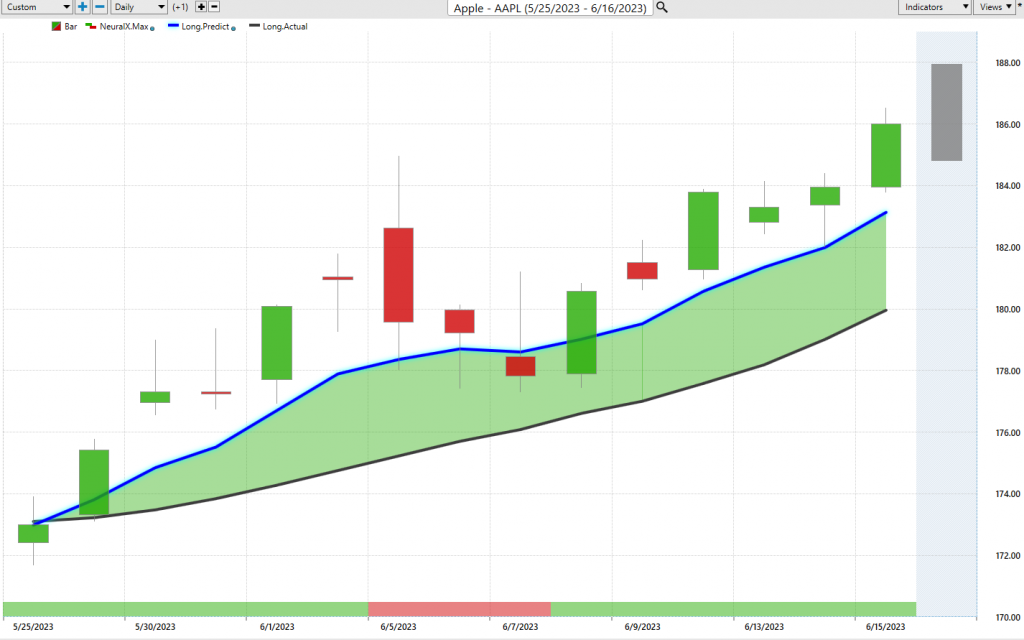
Lastly here, just want to look at a popular share here, shares of Apple. It’s the most recent forecasting that blue line crossed above the black line. Same logic here, right? Neural Index gets bearish, some weakness over the subsequent 48 hours of price action. But as long as that blue line remains above the black line, the overall trend still up, and you see, what have we seen over Apple over the past week?
This is a time to go ahead and belong, really, again, five days straight of just strength coming through the space. So, what you’re getting and what you really have to appreciate is in all these forecasts everything’s skewing extremely bullish. And there’s only one way to look at this as the VantagePoint user, is, look, this is forecasting, the trend is up, we’ve got strength over that 48-hour period, and then you can go in.
Like with that SPY ETF that we have here, and say, okay, well, where do I want to be looking for places of value? And so when you understand that the SPY is down here, well, that’s where you want to get the portfolio positioned bullishly. You can buy SPY, you can buy S&P 500 features, maybe you want to time the individual stock purchases knowing that this is where we’re likely to see those indexes advance, and you’re getting in at a lower part of the daily range there. So, once again, this has been our Hot Stocks Outlook for June 16th, 2023. Thank you all for watching, best of luck out there in the marketplace, and bye for now.