


Register for a Free Live Training
The Hot Stocks Outlook uses VantagePoint’s market forecasts that are up to 87.4% accurate, demonstrating how traders can improve their timing and direction. In this week’s video, VantagePoint Software reviews forecasts for General Mills ($GIS)., Domino’s Pizza ($DPZ), Moderna ($MRNA), Microsoft ($MSFT) and Apple ($AAPL)
Hello again, traders. And welcome back to the Hot Stocks Outlook for July 8, 2022. Hope y’all are having an excellent week out there in the financial markets. And as always, plenty to cover here in today’s Hot Stocks Outlook. Now, we’re going to revisit many markets that we’ve highlighted over the past couple weeks, starting with shares of General Mills. We also have Domino’s Pizza, Moderna, Microsoft, and will end on Apple here. I really encourage traders to go back and watch those previous Hot Stocks Outlooks, because we’ve had a highly volatile period. Stocks up, stocks lower. It’s important to understand how these tools are going to help you make those better trading decisions day in and day out.
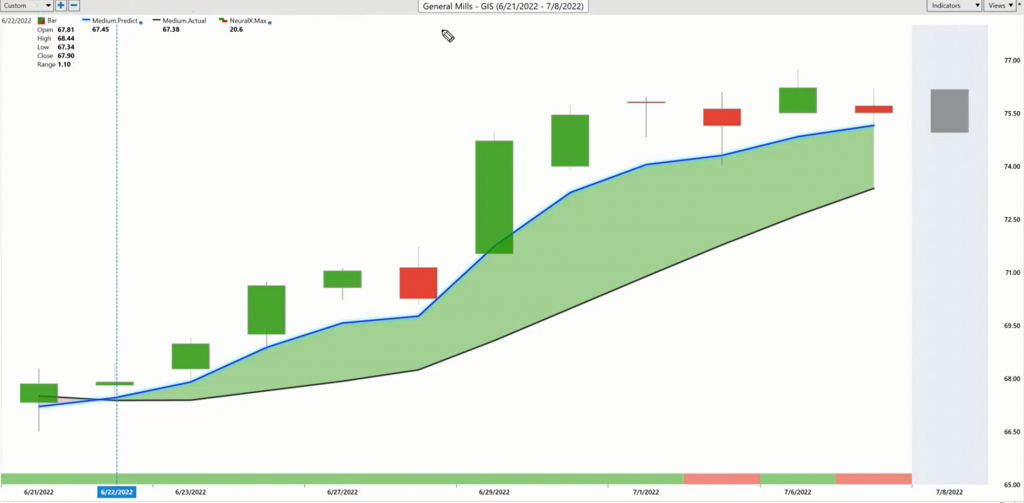
So here we have shares of General Mills, and what we have is daily price action. Each one of those candles is representing a full and complete trading day. And you’ll notice that right up against all that price data, that there is a black line and also a blue line there. So what you’re seeing with that black line is actually a simple moving average. That’s a very common technical indicator. In this case, it’s looking back over the previous 10 close prices. It’ll add those all together and divide by 10. And with that calculation, it’s easy to understand how that really just smooths out the existing price action and acts as a baseline to let traders know where market prices have already been.
But traders need to be ahead of the next move. So what we’re able to do is actually compare that black line, or that lagging moving average, to this blue value that you see against the chart. And for that number to get calculated and plotted against the chart for the trader every evening, this is where the technology of artificial neural networks is coming into play, and it’s performing what’s called intermarket analysis.
What that means is rather than just like normal technical analysis, just looking back at closed prices and previous closes of General Mills, what this software’s able to do is understand how other markets are affecting and driving the future prices moving forward. Now, that can be things like the broader markets like the S&P 500 or the NASDAQ. We’ve seen huge implications for the dollar in oil as that’s rippled through shares all over the place and commodity prices. But when you think about General Mills and how much has been going on with grain prices, right? Wheat, corn, soybean. All of these things get factored in, and it uses those inner market relationships to actually generate future price predictions, so that technologically driven price prediction. And it’s using those values rather than just lagging past prices to generate this predicted moving average and really to generate all of these predictive tools for you.
So whenever you see that blue line crossing above the black line, it’s suggesting average prices are going to start moving higher and you therefore would want to take a long position in the market. Now, when we highlighted this a couple weeks ago, we were highlighting it as just a bit of a 5, 6% move to the downside over some weakness. It’s a slow moving consumer non-cyclical stock. Well, since that crossovers come through, you’ve had 11.5% rally over the past 11 trading days. And again, that’s that blue line crossing above the black line and letting you know that something’s going on here. Now, we have these other tools like the neural index at the bottom of the chart and the predicted high and low range, and so we’ll show you how this all works in combination in these subsequent forecasts here.
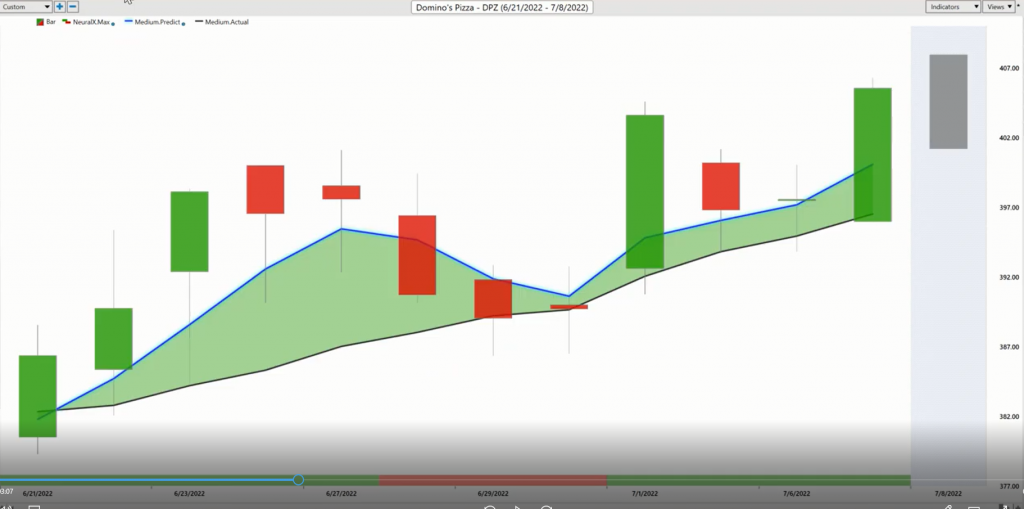
So let’s move over to Domino’s Pizza, and this is a market that again, we kept bringing through, even all through June as a exceptionally strong market. So when we see generalized strength come back into the marketplace, well, it’s not a bad place to look and continue that trading. So what we have here again is that blue line crossing above the black line. We really highlighted this crossover as well, and that neural index is in a green configuration.
Now, this is very important to understand. You see that this bar goes from green to red, back to green. This is another one of these indicators that’s driven by that technology, right? So what it’s doing is it’s incorporating that inner market data, generating those future price predictions, but this tool is meant to solve a different problem. What it’s solving is really short-term strength over the next 48 hours within that existing trend, right? So you see that when that neural index is bullish, you tend to get subsequent 48 hours of strength. We actually looked at this. I believe this is this Tuesday in Apple, and we’ll go ahead and look at that chart as well. But you see this weakness coming through, and what it’s indicating to you is that, look, there’s weakness over the next 48 hours. You may want to go ahead and adjust your position, look for cheaper prices. But as long as that blue line remains above the black line, well, the overall trend is still up.
Where this is really helpful is really not just using the individual market to potentially trade Domino’s, but actually using these tools across the range of markets. You can run these through the Intelliscan feature. That’s actually able to find these fresh crossovers happening right as they occur. So you can recognize these shifts in the market not just in Domino’s, but General Mills and the broader marketplace, and that can really get you ahead of things. So again, you get that overall trend strength, short-term strength or weakness with this neural index. And we’ll go ahead and look at things like these predicted highs and lows which we took a peak at here, and we’ll do again with Domino’s Pizza. But this predicted high and low range, again, provided by that neural network technology is provided before each and every trading day. So over the past couple weeks where you see strength coming into the market? Well, these forecasts for Domino’s Pizza are saying, “Hey, look down here at this 3.95, 3.96 level,” and now you see shares pushing over really 400 pretty quickly there.
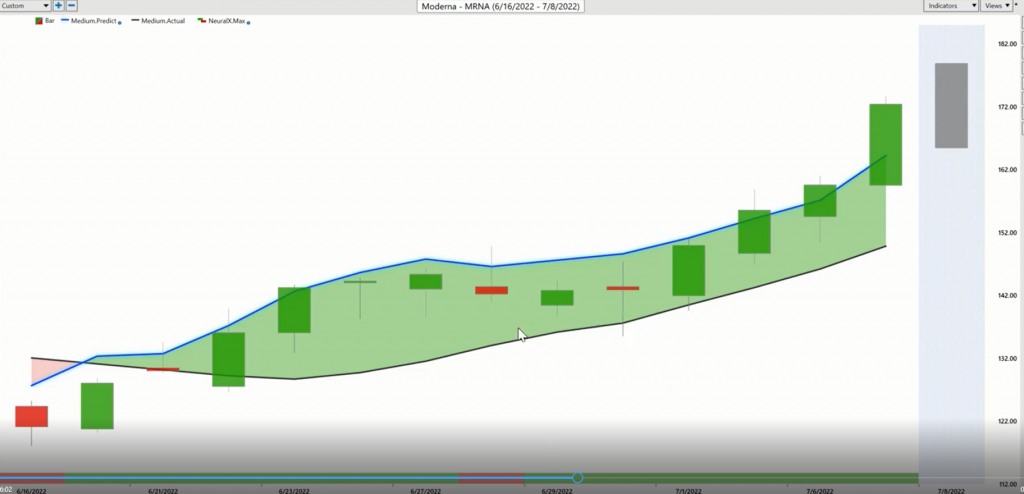
Now, let’s go ahead and go over to Moderna. This is a very straightforward forecast, but again, I just want to highlight the overall strength that you’re able to identify in certain areas of the marketplace. Now, we highlighted last week some areas of weakness. What I really want to highlight is we peaked at Apple, and we’ll revisit that as far as highlighting this very early strength coming into the market. But here again, Moderna, a lot of strength over the past few weeks. You see here as the neural index, it stays bullish, and those 48-hour periods are very strong. This one blip where the neural index goes bearish, you get a little sideways price action, some lower lows over that next 48-hour period. But look how quickly that neural index is getting bullish and saying, “Look, this is strong. There’s strength throughout the marketplace.” There’s certainly areas where you can position yourself to benefit as we see things move higher.
It’s been just a tremendously interesting period as we see again, those big commodity markets starting to ripple around, very important shifts happen. And that’s what’s important to identify as when those shifts are happening, so you can get that really early entry and make as much money as possible. So here in shares of Moderna, nice reversal here. We’ve got a move of about 31% just in the past 12 trading days, and more recently just over the past few trading days. If we again look at these predicted highs and lows, about a 15 to 20% rally here just over the past four trading days, really just this week, and you see how strong that forecast is.
Now, let’s go over to Microsoft. We’ve looked at this quite a lot actually to highlight the strength in the S&P 500, really going back almost couple months now as shares ripple up and ripple lower. What I just want to highlight is this crossover to the upside. You see this blue line crossing above the black line? There’s a lot of volatility here, but I’m again, bringing it through to highlight this generalized strength, right? This is the forecast we use for every single Hot Stocks Outlook, the same blue line crossing above the black line, neural index bullish. And you see this neural index getting bearish over this dip, lower in the market, but very quickly resolving itself and things accelerating to the upside. So as far as that strength coming into the market, well, tools are really pointing you that this is where you want to focus attention to benefit off of that.
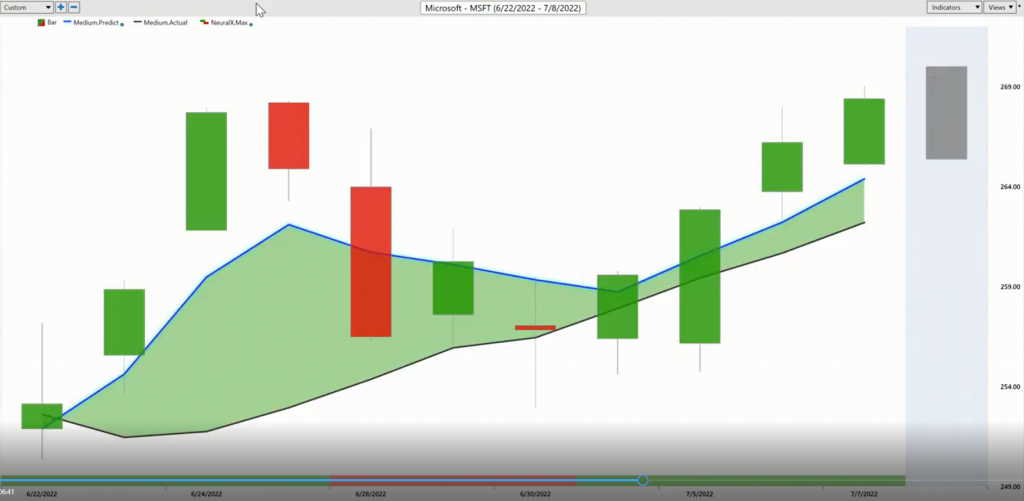
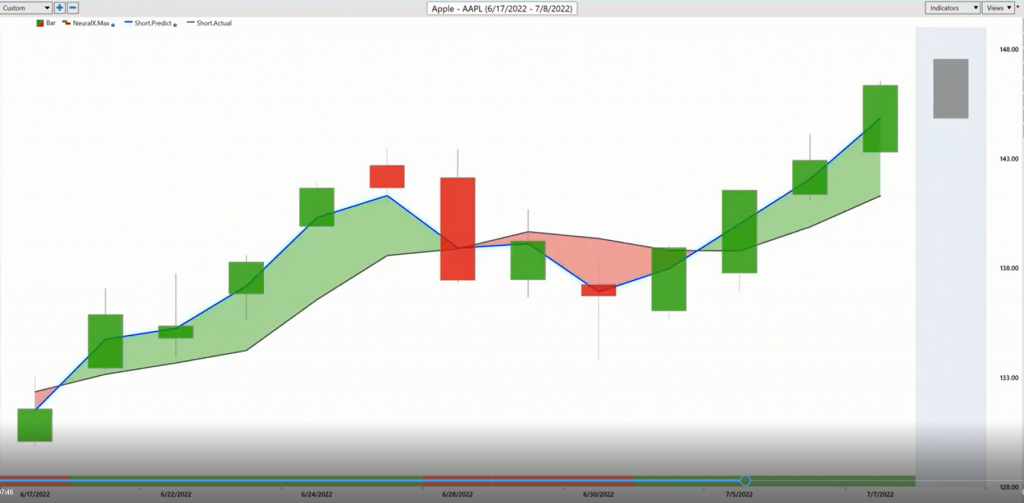
So again, we can look at those predicted highs and lows. Again, this is this big drop on Tuesday, but look how these predicted high and low levels work to really indicate where the better spots to get that exposure are for the bullish side. So here’s Microsoft. You see really an excellent entry down here and shares accelerating pretty quickly here. But I really want to go back to Apple here, because I brought this through really to highlight that we’re seeing a very important shift in the marketplace. So we looked at this blue line crossing above the black line, and what we were highlighting was this predicted high and low. You see how this predicted low comes in the very next trading day, and it’s letting you know down at 1.34, that’s the opportunity there in Apple, and so we get this big shift in the market. That’s what we looked at last week with the Hot Stocks Outlook. And if you really listen closely, what I’m highlighting is down here at this predicted low might not be a bad place to look for shares of Apple to scoop up some value. We see the rest of the market moves higher.
Well, I’m going to go ahead and pivot this forecast. We typically don’t do this. We want to keep this consistent. But the reason that I brought in this very quick short-term forecast is we can plug in these tools into the Intelliscan and recognize that, hey, this is a potential shift here. We want to go ahead and get that exposure on. I’m going to pivot really quickly here to the regular 10-period, simple moving average with this predicted moving average on the bullish side here. This is what we look at every single week.
What it helps you identify is that shift very early in the marketplace, right? That’s where the Intelliscan can come in and help. Hey, there’s potentially a shot to take here, but if you take that shot and the market moves higher and we start to see that weakness come in, well, what you need to understand is, look, that blue line is still above the black line. There’s still a lot of strength in the broader market, General Mills, Domino’s Pizza, Moderna. So what you’re able to do is understand that, hey, maybe I can go ahead and stick out this position, right? We get this move lower Tuesday, but you see how it’s going? Okay, well, now that neural index gets bullish. We see all that strength coming back into things.
And this is very important to understand if you’re trading things like the NASDAQ or the S&P. The Apple more so for the NASDAQ, Microsoft, or the S&P 500. But highlighting that there’s been strength coming in. Those blue lines are above the black line, and this is very atypical to what we’ve seen again for previous months. So it gets very straightforward as far as if you’re looking for strength in the market, where are the areas of that strength? And you see how persistent this has been, all these forecasts really for the past couple weeks now with that blue line consistently over the black line and indicating that this is a bullish market here. You can get that exposure on and get a really nice position. Even if shares go lower, a 17% cushion this week on shares in Moderna.
So just wanted to bring this through. I know it’s a little bit different as we look at things like this Apple chart, but it’s so important in a period like this to recognize those shifts in the market as early as possible, understand where to stake out those positions so that when we get things accelerating, you’ve already got those positions on. You really insulated the portfolio and can benefit when these really big trends start to break out and things start to move once again.
So once again, this has been the Hot Stocks Outlook for July 8, 2022. Thank you all for watching. Best of luck, and by for now.

