


Register for a Free Live Training
The Hot Stocks Outlook uses VantagePoint’s market forecasts that are up to 87.4% accurate, demonstrating how traders can improve their timing and direction. In this week’s video, VantagePoint Software reviews forecasts for SPDR SPY($SPY), Archer Daniels Midland ($ADM), Brown Forman ($BF/B), Dropbox ($DBX), Apple ($AAPL). Xencor ($XNCR)
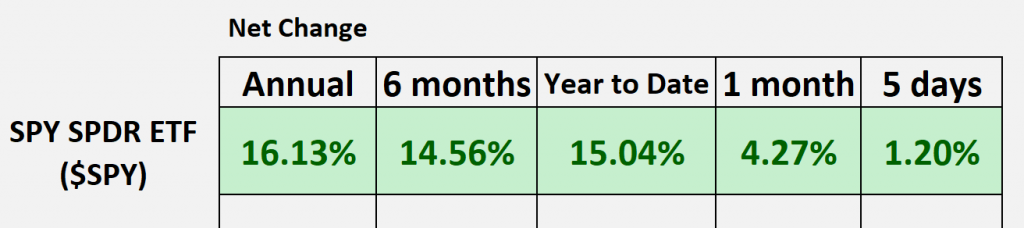
SPDR SPY ETF ($SPY)
Hello again, traders, and welcome back to the Hot Stocks Outlook for July 7th, 2023. Hope y’all are having a great week out there in the financial markets. As always, we’ve got a lot to cover here in today’s Hot Stocks Outlook. So if you haven’t already though, make sure you click on that link in the description below so you can get a live demonstration and learn more of the specifics about how this technology can really help you make better trading decisions in the marketplace. So as we typically do, let’s take a look at the broader markets via that SPY ETF. And we can see that again over the past year we’re still up about 13% year to date, almost 16. And we’ve seen a little volatility recently. I mentioned this over the past couple weeks. We’ll probably see the range expand, and especially on the tech stock side, you’ve really seen things separate a little bit.
Some things doing well and still holding up, but you want to be aware of how to position that portfolio to really make the most of these opportunities, and we’re certainly seeing things shake up.
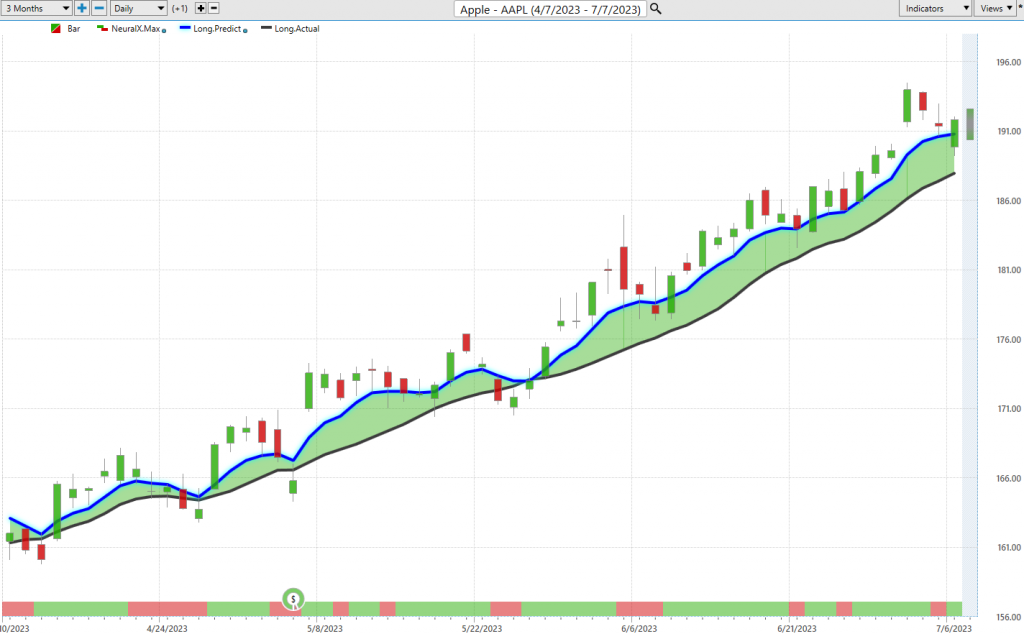
So as we go ahead, let’s take a look at Apple. And this is something we looked at a few weeks ago because we have a extremely bullish forecast here, and it’s really great to understand how all these tools work together with an example we’ve used week-to-week here. So looking at Apple, what we have is daily price action. So each one of those candles represents a full and complete trading day. And it’s right up against that price data that you notice that there is a black line value and also a blue line value. So, that black line that you’re seeing there, that’s a simple moving average. Really no predictive capabilities here, very common technical indicator. In this case, it’s just going to look back over the previous 10 closes. It’ll add those all together and divide by 10.
And so that acts as a good baseline for us, letting us know where market prices have been. But a trader wants to know where our price is headed before they start that move. And so what we’re able to do is compare that black line value, or what you might call the actual simple moving average, or what we really call a lagging moving average, to this blue line, which is a proprietary predicted moving average. And therefore, for this value, essentially forecasting future average prices, for that value to get calculated and placed on the chart every evening, this is where the technology of artificial neural networks come into play. And they’re performing what we would call intermarket analysis. And so what that means is specifically for Apple, there are known markets that will drive and influence future price.
This can be markets that share very similar relationships, inverse correlations. Some of these relationships are leading and lagging relationships, and those are the clues that artificial neural networks are really able to pick up on and you can leverage to your advantage. But this is going to be things like we’ve got technology ETFs, individual stocks. But it goes all the way down the line to things like the value of the dollar index or global interest rates, or think about gold or oil prices being extremely significant to how certain stocks move and react in the marketplace. And so what we’re able to do is take in really dozens of markets and create a summary, essentially using all that information to generate future predictions of where price is headed. And it’s those future price predictions generated via the technology that are used to construct these indicators.
So, rather than having a rearward-looking really summary of what’s already occurred, well, now we have a forward-looking predictive tool. And so whenever this blue line value crosses above the black line, it’s suggesting average prices are expected to start moving higher. If you’re a day trader, swing trader, however you want to approach it, understanding that, well, if you’re a day trader, you may want to be bullish over this 27 days where the market’s going to go up 10%. If you’re a trend trader, you recognize a shift in the marketplace and then can start adapting and managing that position. But really the beauty of VantagePoint here is that it’s really a suite of predictive indicators to give you a rounded-out forecast each and every trading day. And so if we look at the very bottom of the chart here, you see you have this bar that goes from green to red and back to green.
And so this indicator is very short term. It’s really only looking 48 hours ahead. So every day it gets a prediction, whether it’s green or red, bullish or bearish. And what it’s predicting is short term strength over that next 48-hour period. And this is very helpful for traders because when a trend starts moving up, it’s not going to go straight up. We may have those pullbacks, really, opportunities that maybe be really advantageous to buy on the dip. And when you’re aware of this as a trader, and incorporating that into your overall strategy, then you can really take advantage of the other market participants. And so you see here, as the trend moves higher, that neural index gets bearish. And I always tend to say, “Okay, you can expect the market to move below those previous close prices.” And you see you get that, it really moves lower as far as those wicks from each candle here.
And you see it again here, you run a little bit sideways again here, moving a little bit lower. But the overall trend is bullish, and you see that blue line value remains very extended above the black line value, signaling that this is actually a very strong forecast here. Now, that would be really helpful enough to understand, “Hey, I should be long Apple.” “Hey, there’s a little bit of weakness coming in over the next couple days.” But you’re also provided a predicted high and predicted low level. So this really gets down to intraday levels that could be used to set limits, profit targets and really enhance what you’re doing in the marketplace and really limit the risk when you want to go ahead and say, “Okay, what price should I be trying to get in on to really minimize my exposure here and not get caught up in something?” Or things are moving in a way that you wouldn’t want them to.
So what we have here as far as Apple, we’ve gotten this really nice rally, but actually what I want to do is take a look at those predicted highs and lows. And so this is really important for traders because it’s all about adapting. You may recognize that there’s a move higher in shares of Apple here, but you want that updated information so that you can adapt to what’s going to happen ahead of time. And so what we have here is you see these predicted lows doing an excellent job of getting you a really great fill, and then the market pretty quickly, within about 48 hours, starts progressing higher. And so again, you see this pullback here, get a little gap down, and the market moving higher once again.
So, we’ve looked at Apple a couple times over the past few weeks here because getting that sense that we’re going to see some volatility. But things look particularly strong here. And until we see that blue line cross below the black line, you’d expect the market to keep moving higher.
The Hot Stocks Outlook uses VantagePoint’s market forecasts that are up to 87.4% accurate, demonstrating how traders can improve their timing and direction. In this week’s video, VantagePoint Software reviews forecasts for
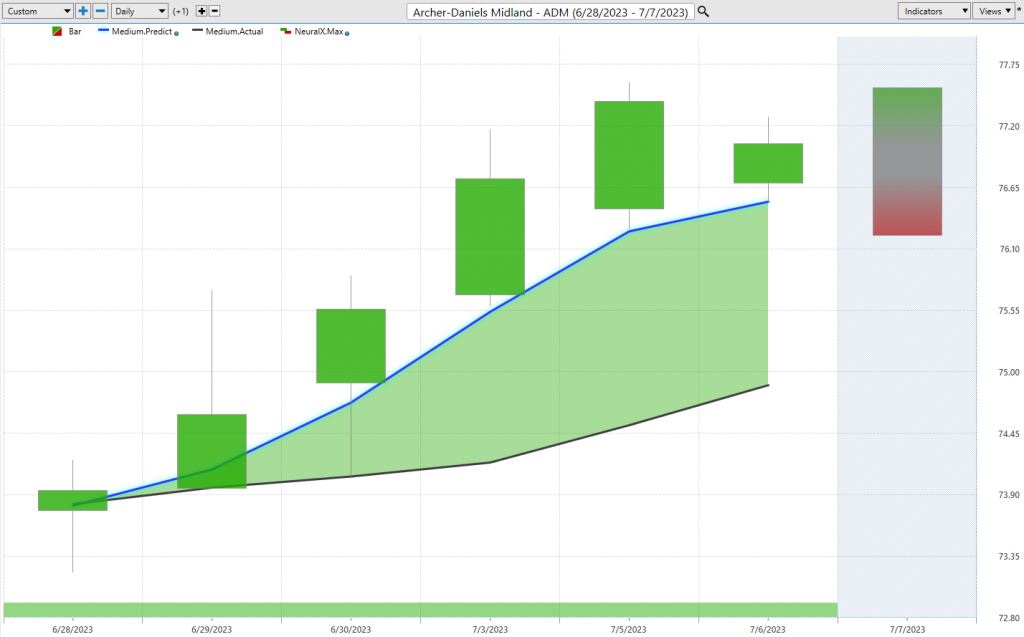
So I wanted to bring in this opportunity much more recently, but just to highlight how these things work and really to highlight how you need to adapt to changing market conditions. So here’s a fresh crossover you see coming through in Archer-Daniels-Midland. We see that blue line crossing above the black line. But what you’ll notice here is look how bullish the forecast remains. So, even before this trading day, you’ve got that neural index saying strength, strength, over these subsequent 48 hour periods.
And that may give you the confidence to say, “Okay, I can hold onto this position.” We’re still seeing that strength. You see this predicted high and low range, moving a little bit lower than the previous high and low. But these are the clues that make it very easy for you to understand what should you be doing and how should you be adapting to the situation. And so we can again look at those predicted highs and lows. And we see this all the time, is that when that trend gets started, excellent job of these values picking out very good intraday price levels. Sure, you’re not going to hit them every single day, but you see in this instance, you’re moving up to that top end predicted high value and then pulling back. And so you can see here just very simply on this ADM chart, good buying opportunities, good profit-taking opportunities, more good buying opportunities. But you want to link that with the timeframe in which you are trying to exploit the market.
And so where this is really helpful is tools like the VantagePoint Intelliscan, so that you can recognize these fresh shifts that are happening in the marketplace. And so we can bring all this up and you see I’ve got really the S&P 500 here. But what we can do is really utilize this to search. If we want to find markets that are in strong uptrends, we can even use some of these other predictive indicators that can help us out and really narrow down on, okay, where are these markets where we want to go ahead and focus some of our attention? And again, using predictive tools to make those assertions and really narrow down on, okay, where should I focus my attention? What’s starting fresh crossovers? We can set this to a fresh value of one and really see these fresh shifts in the markets so you don’t get caught up on the wrong side of them.
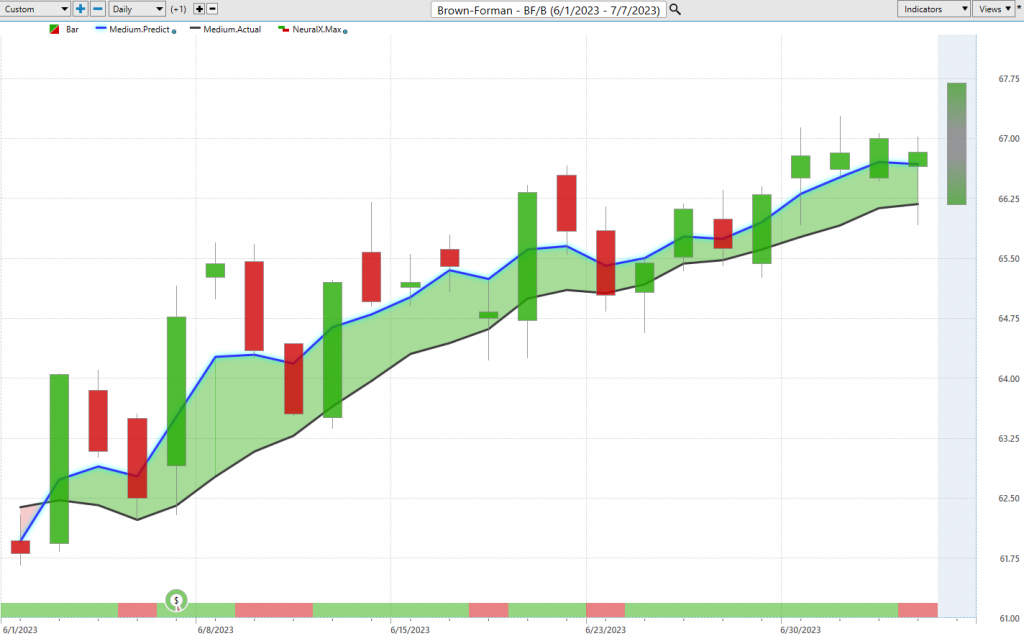
So, as we go ahead and move forward, we can take a look at, here’s Brown-Forman. And I wanted to bring this stock through because stocks are sometimes pretty tricky. Sometimes they may close on the low, and this is where really short term traders get caught up and really can’t exploit a day trading opportunity. But if we look at Brown-Forman here, we can say, okay, really strong blue line crossing above the black line. And this also has remained very bullish over the duration here, even though we’ve seen a little bit of volatility come into the indices. And so if we go ahead and bring up these predicted highs and lows, this is what I wanted to highlight, is sometimes you really need to understand that look, you want to be buying down at these predicted lows. And you notice that the market closes down at these levels, and then that’s where you see that explosive move.
And so sometimes certain stocks are going to be tricky, but this is why you want a neural network that’s able to pick out these advantageous price levels so that you’re ahead of things. So you see, even on a trading day like this here in the middle here, I mean, you want to understand that look, it’s telling you the predicted low is actually moving lower, but the predicted high is going higher. And look at the type of price action you have over the next couple days. The market closes right at that predicted low, and then rocket ship up as the market wants to continue higher here. So again, really nice opportunity here. Brown-Forman, really a seller of, I think, alcohol and spirits and those sort of things. But not a huge move, but plenty of opportunities to take these pieces out of the market over these 22 days as the market moves lower, then makes that big move higher and ideally hit some profit targets that you have set there.
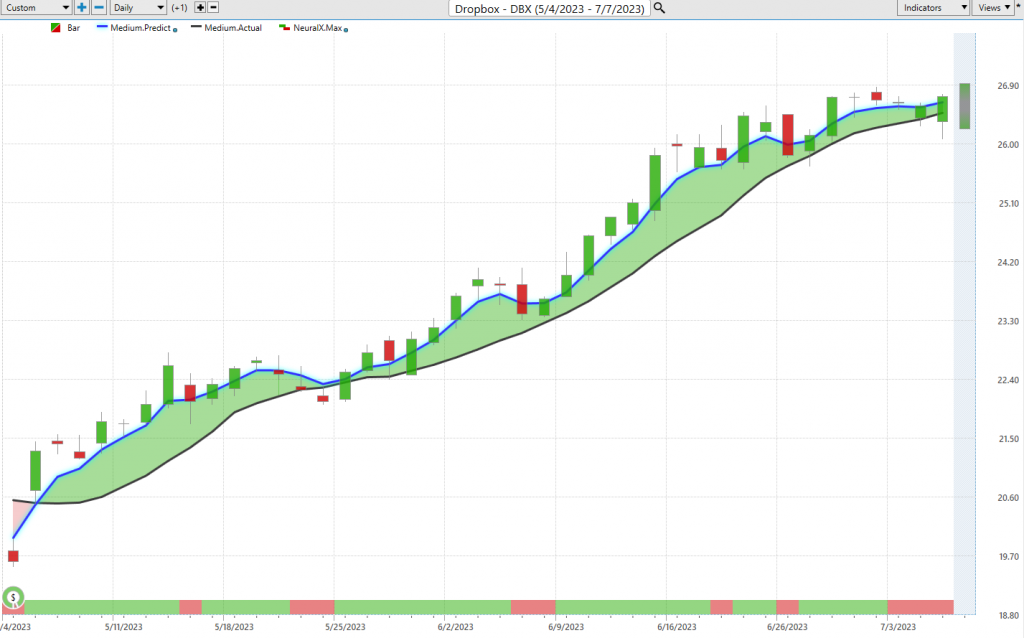
Here we can move forward to Dropbox, and another great example of some of these tech stocks that are performing pretty well. Blue line crossing above the black line. And you’ll see these instances again where the neural index gets bullish. You can sometimes get these sideways periods. But remember, that’s only a 48-hour indicator. So as soon as that indicator you see in these instances gets green in a bullish environment, that’s where momentum picks up. Bullish environment, a trend to the upside, and you really see this momentum really heat up. So that’s where traders, again, can utilize things like the Intelliscan to find these areas. Right where that blue line is above the black line as far as your predicted moving average, where the neural index is quite bullish. And that’s where you should probably focus your attention, bringing in your trade management, your risk control, and your overall style, and really exploiting the forecast for all you can here.
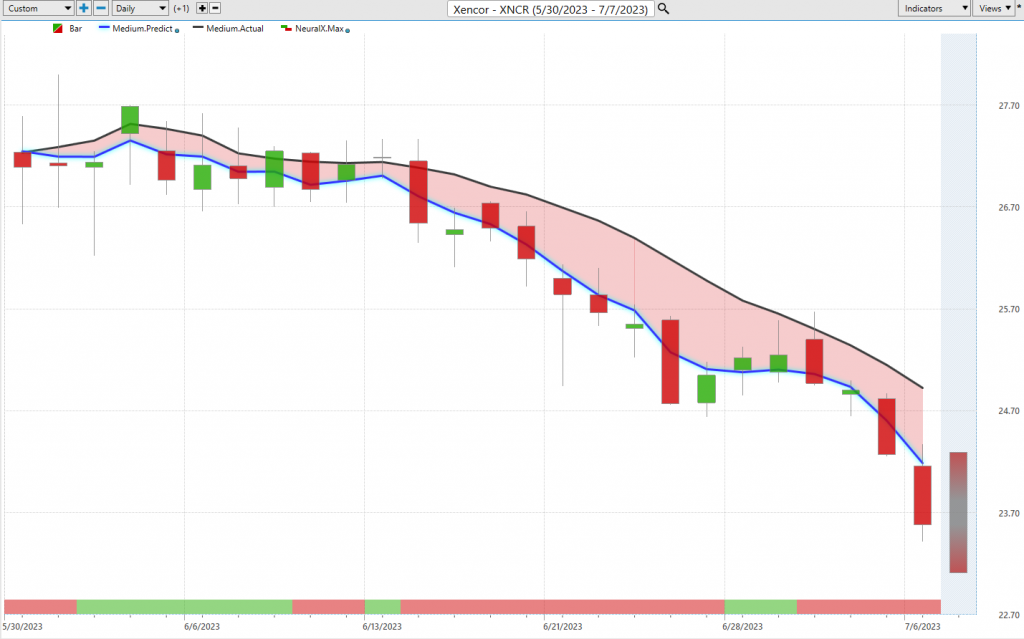
Lastly, I wanted to bring in Xencor. Because I’ve kind of highlighted, you want to be careful here. We looked at Amazon and Apple, some of these more safer places where you can go ahead and keep the bullish exposure in the portfolio. But you may want to go ahead and hedge that, and so Xencor was really kind of the pinnacle example of, hey, there’s a lot of weakness in some of these areas in the marketplace. And so we had this period, again, it’s a great example of neural index is bullish. And what do you get as far as the price action? It’s running sideways, but is the trend up? Well, clearly not. The blue line is below the black line, and this market has really just gotten hammered.
You see this past week as things really running somewhat sideways. Well, shares of Xencor are off quite a bit. And even here, just the short-term forecasting is so exceptional here to let you know that, okay, short-term strength coming in. But if you want to reset short positions in the market, it would make sense to use that short-term strength and maybe a level like your VantagePoint predicted highs and lows to determine, okay, where might you want to go ahead and set short positions? And you see this predicted high and low range, slanted lower. And this is what’s really helpful about this, is understanding that even these short term tools like this, before this next trading day, it’s telling you the range is coming lower, the range is going lower, the range is going lower. And that can be additional confirmation that if you’re a trend trader or a short term trader, there’s still some weakness here.
And so we can take a look at the overall move here. Overall about a 13% decline over the past 25 trading days. But this is just why this is so important. We’re bringing up Xencor, 13% decline in 25 days. And you’ve got shares of Apple doing just about the opposite, and Dropbox doing just about the opposite. But what’s going to happen is as traders have these tools and are able to set up really a process with things like your Intelliscan, you’re going to see which markets are starting to shift and go lower. And that’s critically important to make sure that you’re not buying the wrong things and trying to expect that the market’s going to go higher when a lot of these conditions are really positioned against you and the probability is that things aren’t going to work out like you’d like. So once again, this has been our Hot Stocks Outlook for July 7th, 2023. Thank you all for watching. Best of luck out there, and bye for now.


