


Welcome to the Artificial Intelligence Outlook for Forex trading.
VIDEO TRANSCRIPT
Hello, everyone, and welcome back. My name is Greg Firman, and this is the VantagePoint AI Market Outlook for the week of July the 4th, 2022.
U.S. Dollar Index
Now, to get started this week, we’re going to begin where we always do it, with that very important US Dollar index, which is driving currencies, commodities, equities, all of the above.
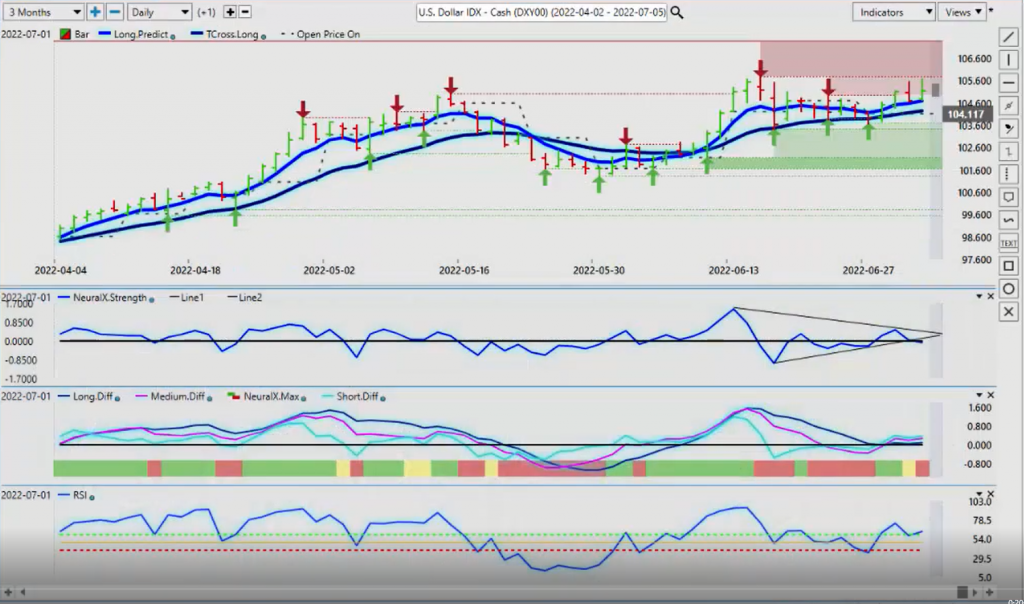
So, when we look at the Dollar index, once again, we’re failing at the critical level that I’ve discussed over, basically, the last several weeks. We can see this level clear as day on the weekly outlook. That area is 105.78, excuse me. But we’re just not getting above this particular area.
So when we bring this back into the daily timeframe, we bring our indicators into this, we can see that we’re holding above our TCross Long. That’s this blue line, which is acting as a daily pivot area. Once we came down on Monday and Tuesday, we came down, hit the VantagePoint TCross Long to the number at 103.96. Actually, we went below it. But we didn’t close below it, as I had discussed.
Now the current situation, again, we’ve had a holiday short week this week with the Canadian holiday on Friday. We have a holiday short week coming up next week with the US holiday on Monday. So as we look at the main indicators, we are extremely conflicted here. We had a pretty strong move up on the Dollar on Friday, only to close the day lower yet again at 105.12. But as you can see the prediction for Tuesday of next week, I’m going to say Tuesday, because Monday, the American markets are out.
So when we look at the predicted RSI, it’s showing momentum to the upside. However, the neural index strength is not, neither is the neural index. It’s pointing down. You can see that I’ve done a makeshift trend line in here, which I often do with the neural index. Neural index strength, I should say. And I can see that we’re breaking this makeshift trend line here to the downside. Now that is in a holiday thin market on Friday, but, again, a very conflicted signal here with the RSI showing momentum above the 60 level.
But again, that neural index strength has seldomly been wrong here, guys. And I would have to say that there is not a lot of buyers on the Dollar index above 105. But there isn’t a lot of sellers either near the TCross Long around the 103.89 area. So we’re waiting for this particular range to break.
Now from a seasonality standpoint, in my respectful opinion, it heavily favors Dollar shorts. I believe on a 20 year basis, it’s an 80%, the Dollar sells off in the month of July over a five-year period. It’s an 80% bearish signal on that seasonality. And even on the 10-year, is still not good. That doesn’t mean the Dollar can’t go higher. It’s just something I would mention to everybody.
Now, next week with this close of 105.12, that’s where we will start the week. I would strongly advise we keep a very close eye to see in next week’s trading, if we can hold above the weekly opening price. If we can’t, then that would suggest that the neural index strength is correct. And the Dollar actually is nowhere near as strong as what it appears to be.
Gold
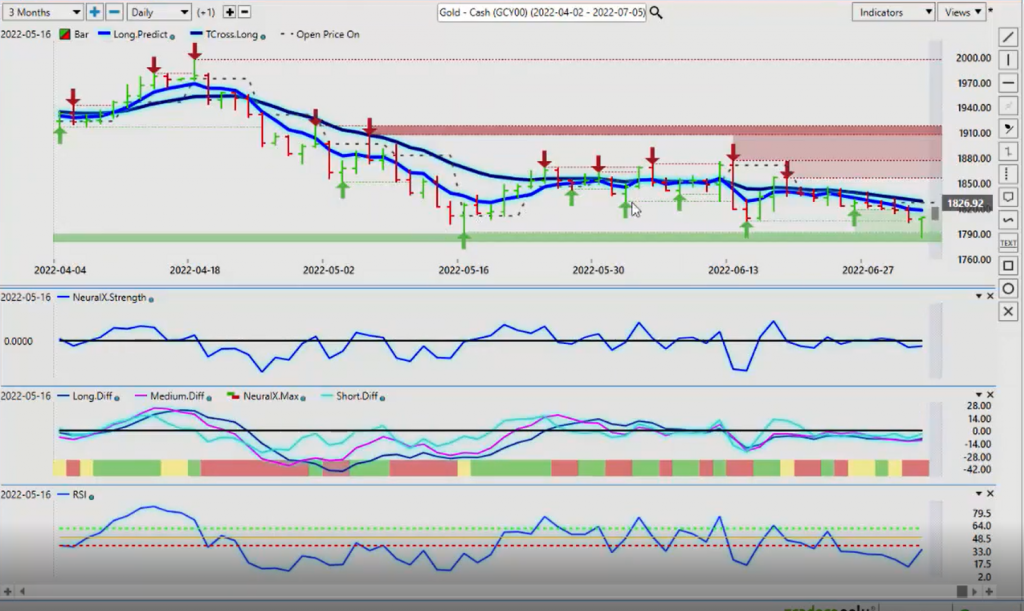
Now on Friday with gold, the arch nemesis, obviously of the Dollar, there is a very strong seasonal pattern for gold in the month of July. And when we look at recessions over the last X amount of years, 70 to 80% of the time gold goes up in a recession. If I was betting on either gold or the Dollar, I would always bet on gold versus the US Dollar. When we look at the depreciation of the US Dollar over the last 20 years versus the appreciation of gold, it’s a very different but complex, because we have Bitcoin in the mix here now, which I’ll discuss in a moment.
But for now, right now on Friday, we had a bit of a sell off in thin illiquid markets down to the low of 1791, where you can see, we saw strong buying down at that particular level off that verified support low. 1791, that will be our support for next week. In order for gold to really break down here, guys, we would need at least a two day close below the 1790 mark to confirm that it is the Dollar that’s going to win this battle. But my optimism on the Dollar winning this particular battle in the month of July remains heavily guarded.
Bitcoin
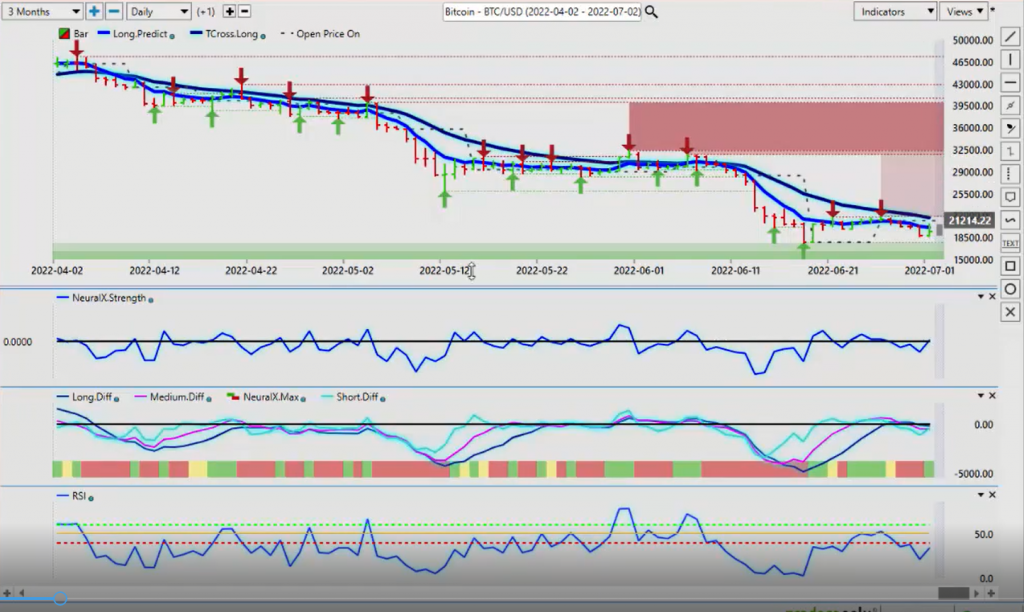
Now, when we look at this on a comparative basis to Bitcoin, once again here, guys, I will quickly pull this back because the media pundits on this. This is also a known seasonal pattern in the mid to end of July, where Bitcoin gains significant strength. And in multiple years, looking back at this, it’s always been down during this period of time. So I think the media is spinning this one a little bit, but for now what we are looking for is confirmation as we move into July, that Bitcoin can recover. So our support going into next week, our low is going to be 17,006.14. We’re looking for that level to hold or slightly below that. Once again, our neural index strength is pointing up. In this particular case, the RSI is recovering with it. But you’ll notice a very, very different signal here between the RSI and the neural index strength and Bitcoin versus what it looked like on the Dollar index. So once again, potentially yet another inner market that is pointing towards actual Dollar weakness, not Dollar strength.
Now the signal is very mixed around the zero line. I don’t think this will work itself out till probably Tuesday or Wednesday of next week, but if we can get above the TCross Long at 21,608, that will confirm what we’re looking for, that buyers are in a very quietly, in a sneaky manner, are moving into longs on this. So watch those levels very, very closely.
S&P 500 Index
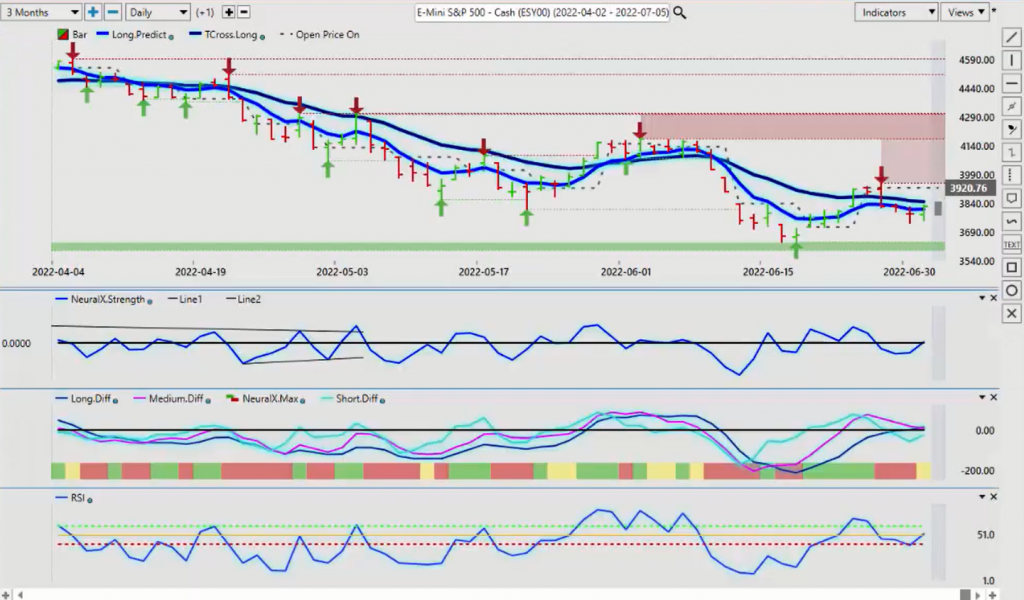
Now, as we look at the indexes, the stock index, more specifically the S&P 500, it continues to meet heavy resistance. Any rally, clearly they’re selling it, pointing again towards a recession. But again, if we look at stocks from one year ago, this is another easy way to check patterns here. You can see that the S&P actually started to recover last year in the month of July. And I’m sure if I go back two years, you will see something very, very similar. If I go back three years, I’m pretty confident you’re going to see the same thing.
You’re seeing more or less bullish until we get into the fall, I’m not, I’m certainly not suggesting to buy stock the S&P 500. I’m simply warning that if Bitcoin is a leading indicator, if there’s a 80% or 90% correlation between the S&P 500 and Bitcoin, and Bitcoin does turn around in July, there’s a strong possibility that stocks will at least level out here a little bit. But for now, once again, the TCross Long, 3,850, that’s our resistance for the week. That’s where I believe you. You will see your sellers are camped out waiting for a rally higher. But if we get a sustained break of that level, then we could see, again, something very, very different.
Now the MA Diff Cross is attempted to cross, but it didn’t make it here. So once again, we’re kind of flat, but it is still pointing that we could see recovery. Now with the predicted RSI with the 60/40 split. Again, I’m gauging this based on, I’m looking for momentum from the RSI, not an overbought or oversold signal. I don’t trade off of those types of signals. We’re looking more for momentum.
The momentum to the downside, it was not strong. It was strong up until about Thursday or Friday. But then we turned around and closed positive on the day, very close to the TCross Long. So what I would anticipate here is an immediate sell off to begin the week, but then a recovery on Tuesday or Wednesday. So we’ll keep an eye on that. But for now, clearly bearish biased here for stocks, undeniably.
Now, last week, we talked about the buy signal from the MA Diff cross, which, again, I had stated that I don’t really care for buying oil at these prices, but once again, VantagePoint was absolutely spot on with this. If you look at last week’s video, this was a very small pink line crossing the blue line, and that led to a significant rally in oil. But we are also not closing above the TCross Long, we’ve had a significant failure up there again. But when stocks recovered oil recovered on Friday also. So to begin the week, there’s still a slight bias, but as you can see with the predicted RSI and the neural index strength, they are not crossing that zero line yet. So we’ve got a caution or a yellow sign on the neural index itself, but it is still warning that it’s momentum is building again to the upside.
Euro versus U.S. Dollar
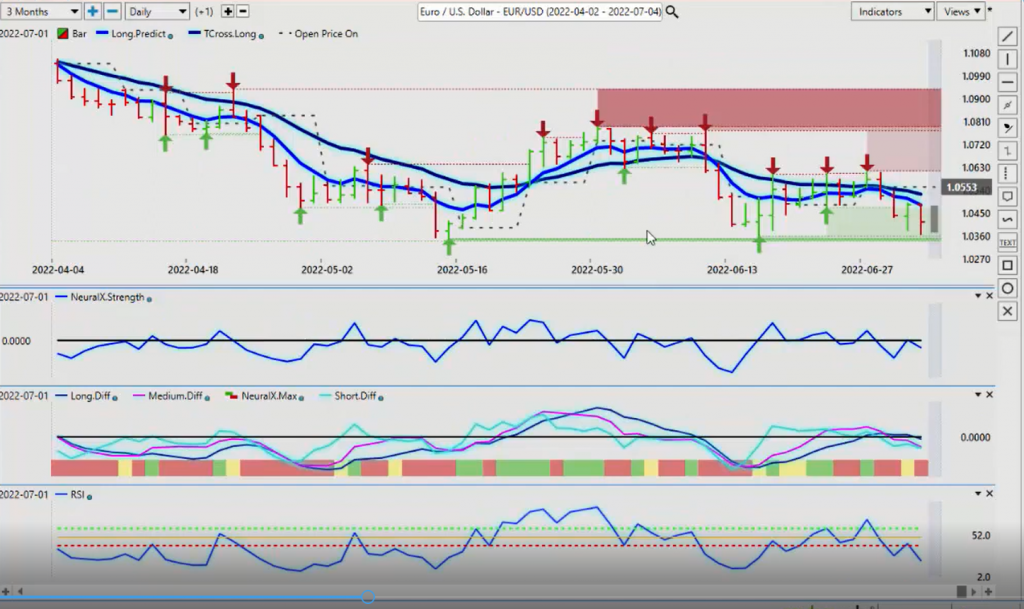
Now, as we look at our main forex pairs here, guys, this is where I think people get confused. They throw 50 indicators at something, at these forex payers, et cetera. But the reality here guys is before you take any trade based on indicator based or anything else around the Euro currency, you want to make sure you’re looking at the Dollar index. The other thing you want to make sure is that you understand that there is no big up trend or down trend on this. We’ve been range trading since May the 13th.
What I find also very interesting is around that 13th to the 15th of the month, the Euro repeatedly gained strength. Now I’ve talked for many, many years on, TraderPlanet, on the VantagePoint AI YouTube channel, seminars about the Dollar cycle at the beginning of the month, where we see real Dollar demand. Regardless of the wars, regardless of COVID and all this other stuff, people are required, more specifically the US government, some of these other people, are required to buy Dollars. It’s not an option they have to, they have to pay government pensions. They have to pay trade balances. There’s been many articles written on this through Goldman Sachs, et cetera.
And I support the theory because I’ve seen it. So this would say that we would have probably one more bout of Dollar strength, which could come next week. And then we would likely see the Euro start to turn around. But the immediate support that you want to watch here is 103.50, between 103 and 103.50. Be very cautious of a bear trap down here, is all I’m wanting. I’m not saying the Euro can’t go to parity, or it couldn’t go lower. I’m just saying we’ve had several tests here of this level, and if it doesn’t break through this time, then we’ve got a serious problem on what the media is telling us is a no-brainer trade, meaning Euro/US shorts.
Always remember here, guys, the more people, more specifically, retail traders, that pour into Dollar longs, the less attractive it is to us, to your more institutional plays. Because they know retail traders flock to these type of, what appears to be, an easy, no-brainer trade. But either way, guys, I say, we’re going to retrace, likely to the long predicted 104.81. We still closed bearish on the week. The indicators are very mixed, but the immediate push is likely to the downside. But we need to break free and clear of the 103 level and stable at 103 to create a new range. Very often, that is not the case.
U.S. Dollar versus Swiss Franc
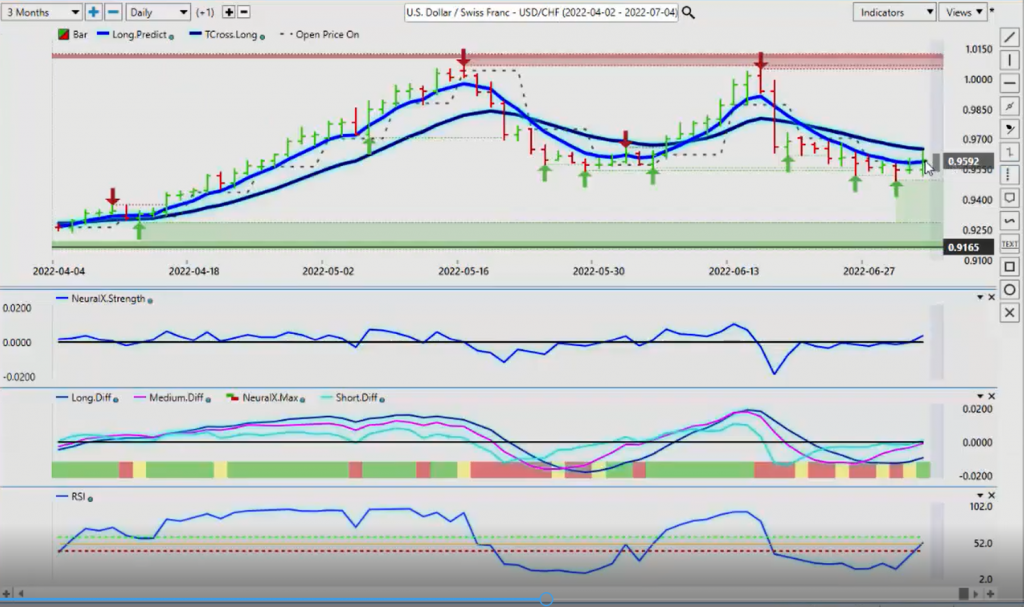
Now, as we look at US/Swiss Franc going into next week, once again, we’re seeing some recovery here in the Dollar index, but again, can we close above the TCross Long, 0.9653? Always remember too, it’s difficult to base all of our trades on the Russia-Ukraine war or the fed hiking because all the other central banks are hiking also. And the interest rate differential, it doesn’t always support the Dollar long. So once again, the Swiss Franc is a safe haven currency, just as much, if not more than the US Dollar. If I had a choice between barking my money and Dollars or Swiss Francs, it’s always going to be Swiss Francs, until something changes.
Right now, our neural index strength is saying we are going higher, our MA Diff Cross, we’ve got a rising RSI. But we don’t have the momentum building just yet. The last area of momentum that we had, I will point out here, guys, was on June the 6th. We had significant momentum building. So again, this would tell me that we are going to recover on this particular pair for potentially about a week, week and a half. So if we look at these repetitive patterns, then we can expect it. But again, that seasonal pattern in July for the Dollar is one to be very cautious of.
British Pound versus U.S. Dollar
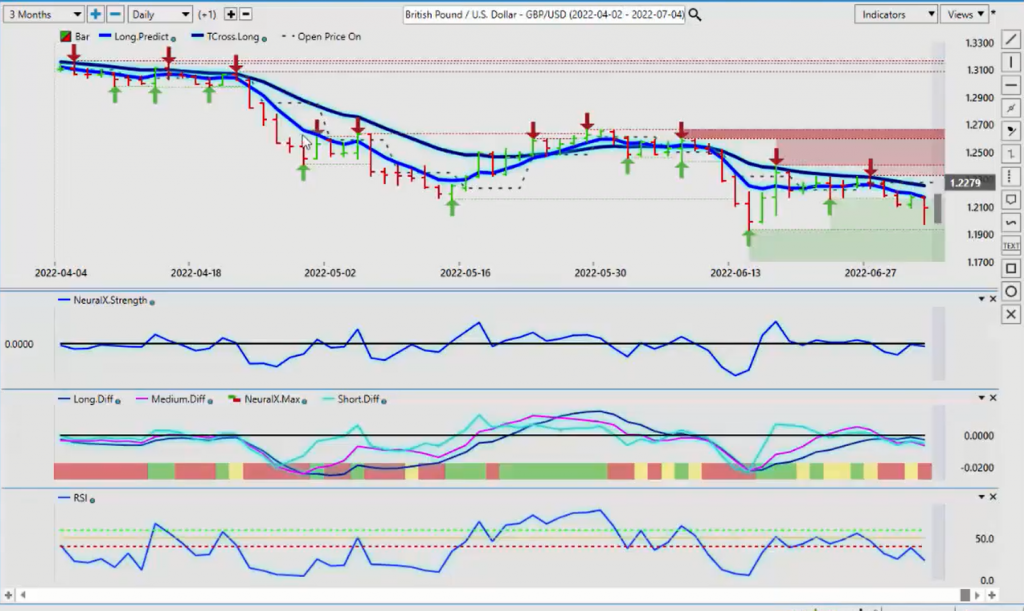
Now with the Pound/Dollar, again, more Brexit fears are coming into play here, but we’ve come down again below this 1.20 area, we’ve got down to 1.1934. This is the level to keep your eye on this week. Now, the bulk of the indicators are still bearish, but I don’t believe we’re going to have a lot of sellers here below 1.19. So be very, very cautious. Keep an eye on your main pivot levels. Your long predicted, that’s about 1.2173 and your TCross Long at 1.2253. And as you can see, when we got near that verified support low at 1.1934 on Friday, the buyers were in there within a matter of seconds, driving this thing back up to a close almost at 1.21. So a nice trade off of that verified support low. And I would look to potentially repeat that next week, if we can get the neural index, the neural index strength and the additional indicators coming on board.
U.S. Dollar versus Japanese Yen
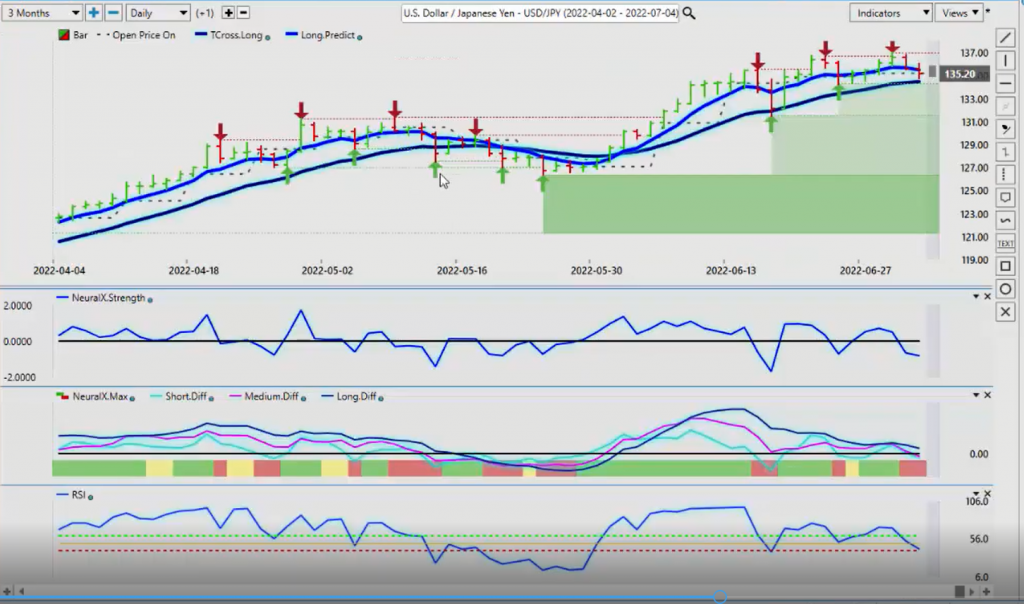
Now with the Dollar/Yen, once again, my view on the Dollar/Yen is, the US Dollar is, I would argue, grossly overvalued up here. And I mean, grossly overvalued. But again, that doesn’t mean it can’t go higher, as we’ve seen. But now we’re starting to get resistance building up here. This resistance is coming in at the high of 136.71. We can see that the neural index strength, when it crosses that zero line, it is very seldomly wrong. The predicted RSI is moving lower, but we haven’t broken down below the 40 level, showing that we have momentum. If we lose the 40 level on the predicted RSI and the neural index strength continues.
But as you can see right now, this pink line is crossing that zero line. That is a medium-term crossover, which I’ll show you right here. So as that pink line crosses the zero line, we get the blue line crossing over the black line. This suggests that this pair is getting ready to move lower. Now, once again, that indirectly supports gold and potentially even Bitcoin. But the low right now that we’re looking to break is 134.27. We are closing the week here out at 135.15. So if we lose this particular support level, then I would be looking towards a retest of the 131.50 level. But expect a very, very choppy volatile US/Japan pair.
U.S. Dollar versus Canadian Dollar
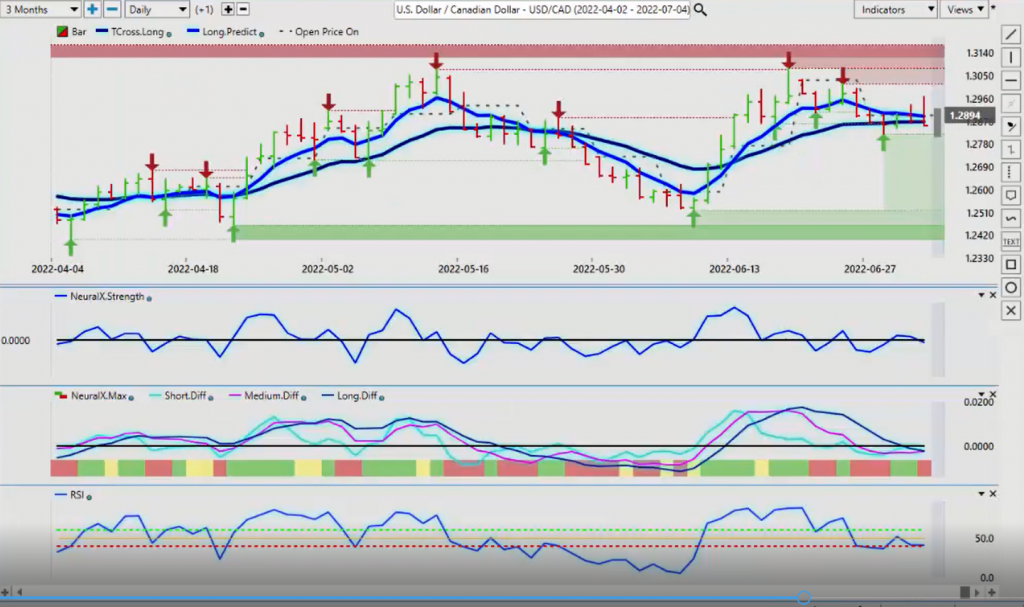
Now, US/Canada, once again, here guys, we are still within a very well defined range. And this is where, if you’re putting 20, 30, 40, 50 pip stop-losses, that’s a sucker’s back guys. They’re selling near the top of the range, which I’ve discussed since early May, which is the 130.76 area. And they’re buying it back, when we get down here around the low, in and around the 124.59 area. This most recent long they were picking up buys at, or about the 125.18 area.So once again, we’ve had multiple failures here. This is a fantastic trade that I’ve gone through over and over and over again here on VantagePoint AI YouTube channel and in the live training room, that again, you can put as many indicators as you want onto this, but if we don’t break through these verified zones, then it’s going to reverse.
So what they’re doing is they’re selling the top of the range, but they’re also buying the lower end of the range. And right now we’re looking for a sustained break of the TCross Long at 128.70, but a very dismal week here for the Dollar. The Dollar made no gains against the Canadian Dollar, but remember US and Canada, two of the main trading partners with each other. What supports the Canadian Dollar? Oil supports it, wheat supports it, gold indirectly supports it. And some of your other precious metals. But oil is still a big one. And if this does break down lower, this could actually be a leading indicator that the S&P 500 is getting ready to recover and the Dollar is not going to fare well in the month of July.
So this is something we’ll be watching. Right now, our neural index strength is down. My only concern here guys, is again, that MA Diff Cross is trying to cross back to the upside. So when we look at these, the times when these rallies have taken place, then it’s usually at the end of the month or the first week of the new month. And the Dollar, again, every dog has its day, the Dollar goes higher, but each time they’re waiting up there to sell this. So watch this level very closely. But nothing has changed, we continue to range trade on this particular pair and many others for that matter.
Australian Dollar versus U.S. Dollar
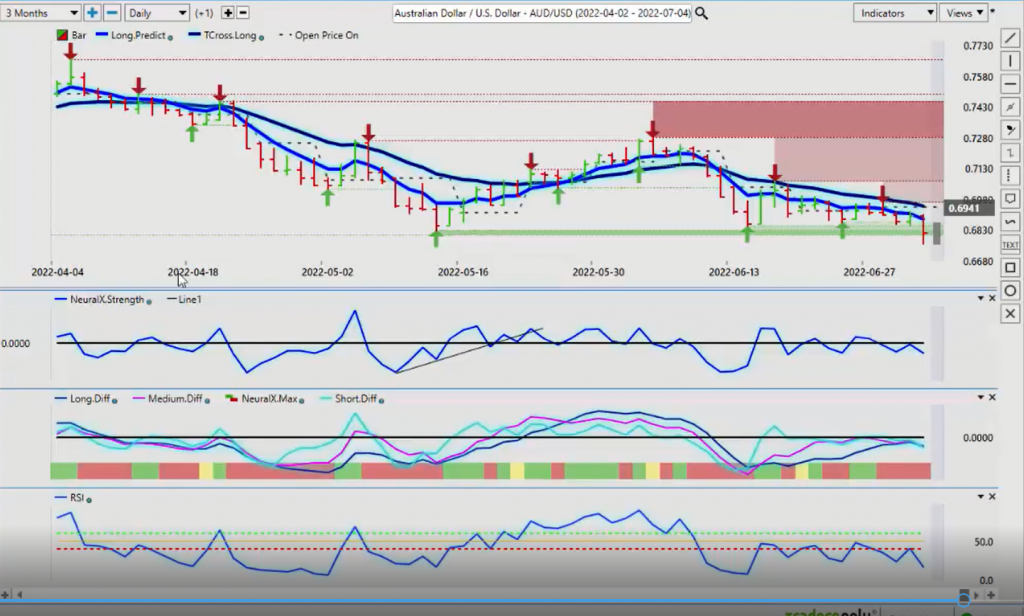
If we, again, look at some of the other similar pairs that are correlated the Aussie/US Dollar. Basically, we’re still range trading here. There’s no disputing this 0.6829 is the low. We’re pushing a little bit lower down here, we’ve got to 0.6764, but you can see the buyer stepped right in it again. But if we’re looking at setting a new range for this particular pair, then we need that sustained heavy break below 0.6829. And I mean, for 2, 3, 4 days. And we need to create a new range where the former support will become resistance.
New Zealand Dollar versus U.S. Dollar
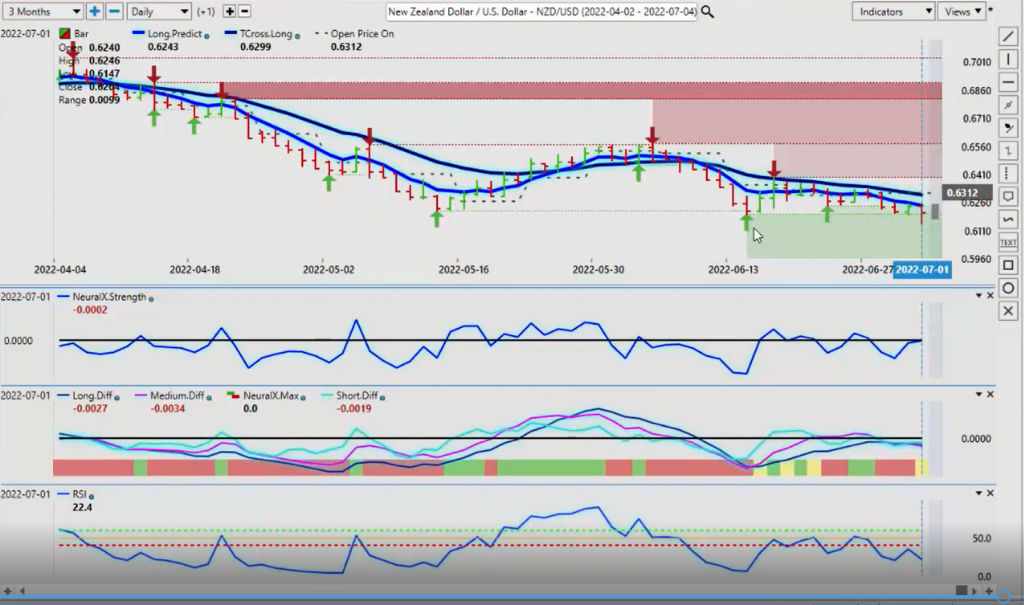
The same thing would be applicable to us on New Zealand. It made a slight new low on Friday, but it’s still in the overall range, within a few pips down at this 0.6196 area. So again, we always have to make sure before you’re taking a short-term position, look at the long-term or medium-term structure of the overall market. Shorts are very dangerous here. Just like shorts could be very dangerous on Euro/US. But they’re all reliant on one thing, the Dollar continuing to advance. If the Dollar can’t advance, the Dollar will lose ground against all of these particular currencies, which would indirectly fuel a rally in gold and the S&P 500.
So with that said, this is the VantagePoint AI Market Outlook for the week of July the 4th, 2022-


