Register for a Free Live Training
The Hot Stocks Outlook uses VantagePoint’s market forecasts that are up to 87.4% accurate, demonstrating how traders can improve their timing and direction. In this week’s video, VantagePoint Software reviews forecasts for SPDR SPY($SPY), CF Industrial Holdings ($CF), Archer Daniels Midland ($ADM), HF Sinclair ($DINO), Dell ($DELL), IAC/Interactive ($IAC). Tesla Motors ($TSLA).
SPDR SPY ETF ($SPY)
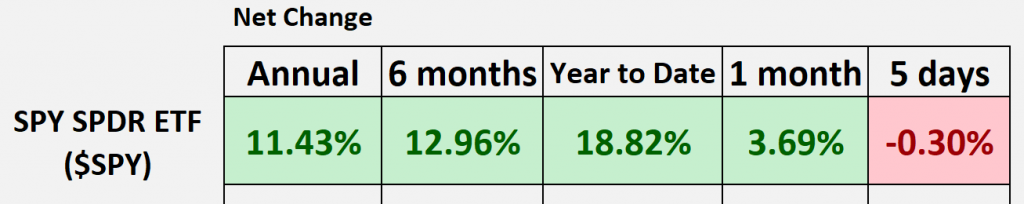
Hello again traders and welcome back to the Hot Stocks Outlook for July 28th, 2023. I hope y’all are having a great week out there in the financial markets. As always, we’ve got a lot of opportunities to look at some markets over the past few weeks that we’ll bring back into the Outlook. But before we go ahead and jump on into everything, we can take a look at the SPY performance, that performance of the S&P 500 over some of these rolling periods. And so, we can see if we go back 365 days, we’re up about 11.5% year to date, almost 20 getting really close there, but we’re having a little trouble, a lot of that on the tech side and spoke to this a little bit last week, but we’ll go ahead and show you how the VantagePoint forecast can really help you out.
So, if you haven’t already, make sure you go ahead and click on that link in the description below and you can actually sign up for a live demonstration and get all the specifics about how all of these tools can really help you make better trading decisions day in and day out in the marketplace. So, what we’re going to do is we’re going to take a look at CF Industries, we’ll revisit ADM and HFD and clear a lot of stuff going on in energies and even agriculture here. And then a little bit on the tech side really highlighting how traders can get ahead of things and understand where the better places to position themselves are based off of artificial intelligence and these predictive forecasts.
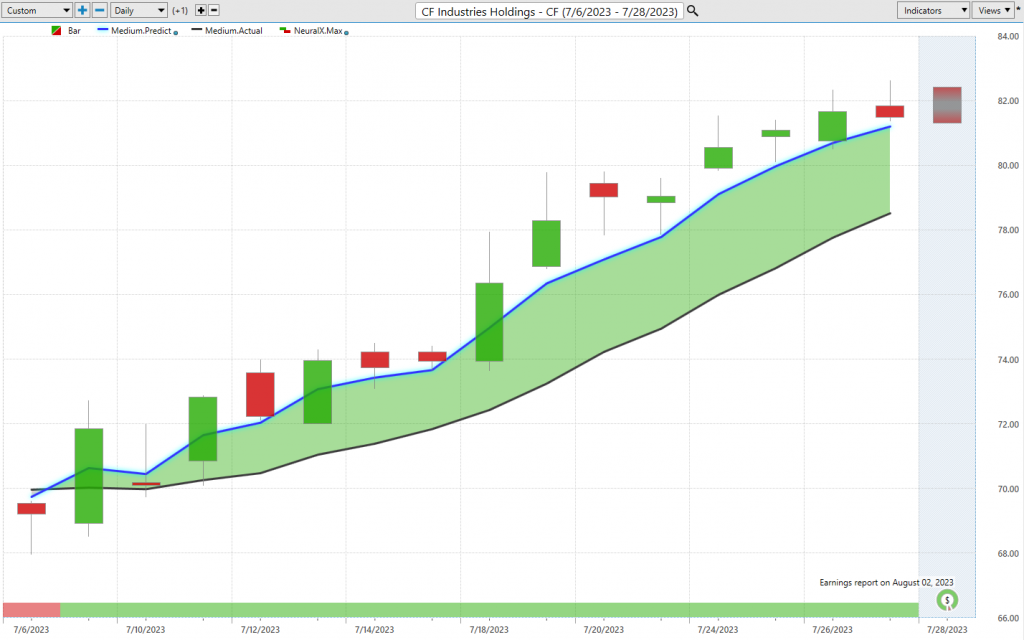
So, as we start out here with CF Industries, this is a good example of how all of these tools work together. And so, what we see on the chart here is daily price action, right? So, each one of those candles is representing a full and complete trading day, and it’s right up against that price data that you’ll notice that there is a black line value and also a blue line value. So that black line that you see on the chart there, that is a simple moving average or what we call the actual moving average. And this is a very common technical indicator. In this case, what it does is it looks back over the previous 10 close prices, and so it’ll add all those values together, divide by 10, and what you get is a rolling period or rolling indicator showing you where market prices have been. But the problem with tools like this is that all of the data that constructs that indicator comes from the past and only comes from one market, in this case the target market, right? CF industries.
And so, the problem with that is it’s really lagging and really just summarizing where market prices have been. So, what we do here is we actually use that as our baseline to actually compare that to this proprietary predicted moving average. And for this number to get plotted and calculated on the chart every evening, essentially a forecast of future average prices for the trader. Well, this is where the technology of artificial neural networks come into place and they’re performing what we would call intermarket analysis. And so, what that means is rather than just looking back at the past close prices of CF industries, well what VantagePoint is able to do is understand market relationships that will drive and influence the future price moving forward. And so, in market prices, there can be leading relationships, lagging relationships, sort of inverse and positive correlations, and that’s what neural networks are very good at feathering out is all that information and then generating highly accurate predictive forecasts.
And so, this can be things like individual stocks, it can be things like the S&P 500 ETF or the other indices, but it can also be things like the value of the dollar index or global interest rates all the way down to global commodities like things like soybean prices, gold, silver, oil prices. And so, it takes this global approach taking huge amounts of data and then it’s generating highly accurate predictions that traders can use to make better trading decisions. So, as we look at that predicted moving average, whenever that blue line crosses above the black line, would suggest that prices are going to move higher. Additionally, the slope and the distance from that black line value is indicative of a strong trend. And so, you see here as that blue line crosses above the black line, we’ve gotten a really nice rally here in shares of CF Industries about a 16, almost 17% move higher.
But what’s really important here is to understand that you really have a suite of predictive tools here to solve different problems for the trader. And once you’ve identified that, okay, well the overall trend direction is up, well then you may want to pivot to, “Okay. Well, what’s going to happen here in the short term?” And this is where this indicator at the bottom of the chart called the predicted neural index comes into play. And this is a very short-term indicator. It’s only forecasting ahead 48 hours at a time, or you can think of that as really two candles. And it does that with a very high level of accuracy, and so it’s either going to be green or red. So, essentially yes or no right or wrong, and that’s how we get that very high level of accuracy associated with the indicator. Now we can see in CF Industries this has gone pretty much straight up that green being very bullish and that’s all very good.
But what traders can also use intraday are these intraday predicted high and low values. So, this is extremely helpful for entries, short-term traders and profit targets that may want to set up. And so, as we look at the forecast for CF Industries, well, we can clearly see that blue line crosses above the black line, but what we can do is look back and see exactly how accurate are each one of these predictive forecasts. And all of these values are known before the market day, actually 6:00 PM the night before, letting you know that, hey, if you have a limit order set down at these prices, well that’s where there’s really value, and you may want to go ahead and scoop up a position. You see about five very excellent entries there. And also, on the top side of this, right?
So, in this case, you actually shooting up looks like to this predicted high as that trend resumes, but constantly moving up to these predicted high values and again, really nice areas to take profit, reset your position and maybe add to your position in the marketplace. So, really nice opportunity there in CF Industries, and I really bring this through because there’s been a lot more opportunity here in things like agriculture and a little less so on the tech side.
Archer Daniels Midland ($ADM),
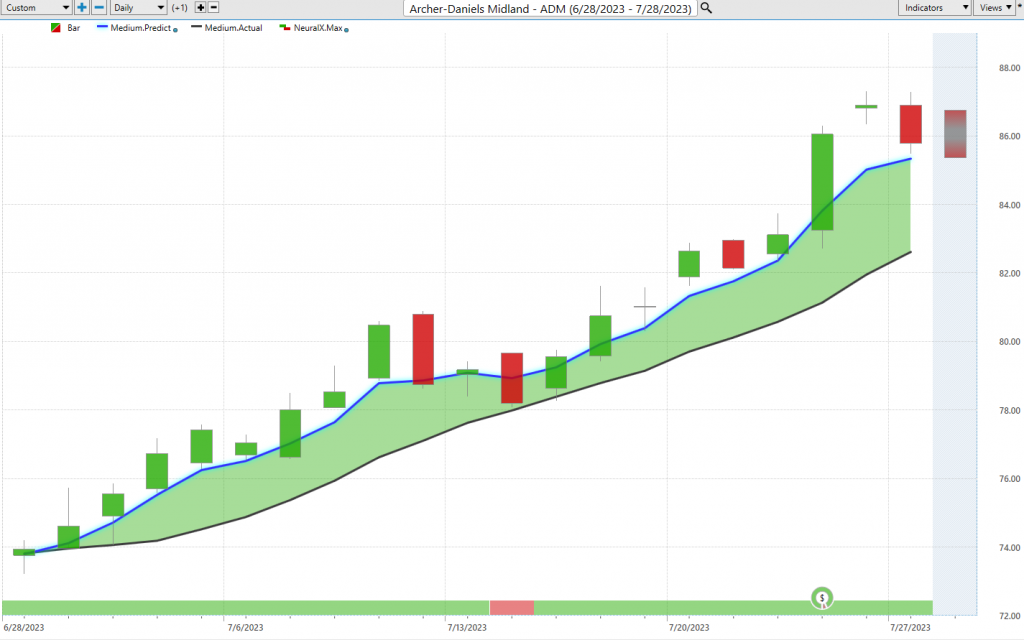
And so, this is where we come back to ADM, Archer Daniel Midland. So again, exact same approach. We had this crossover between the blue line and the black line, and this is really the key here. You’ll notice that you get one day where that neural index is bearish in this case out of… Let’s see how many trading days here.
And so, it’s essentially extremely accurate here, going on, let’s see, 20 trading days, it’s getting that, right? I’d say about 19 of the 20 trading days as ADM moves up now 17% over the last 20 trading days, just over the past two weeks. We can look at the predicted highs and lows from ADM, and we actually came back here on this Friday. The market pushed against you less than 1% and then rallied pretty much straight up for the next two weeks here.
So, really nice opportunity there in Archer Daniel Midland.
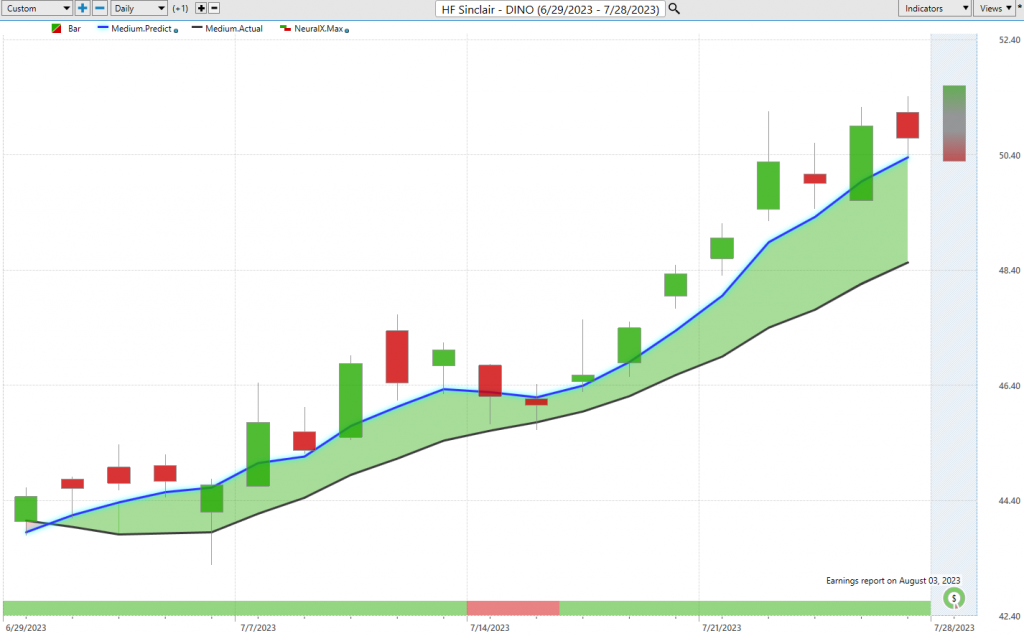
And then we looked at some energy shares, here’s shares of DINO HF Sinclair, sort of a specialty chemical company here. Blue line crossing above the black line neural index, very bullish. You see, you get this bearish day here, you get a little bit of sideways price action, a little bit lower lows over the next 48-hour period, but then again, two weeks later you’re going much higher and energies have done quite well. This can also help you trade crude oil futures potentially if you want to trade oil or oil contracts. You see about a 15% rally in the past 19 trading days.
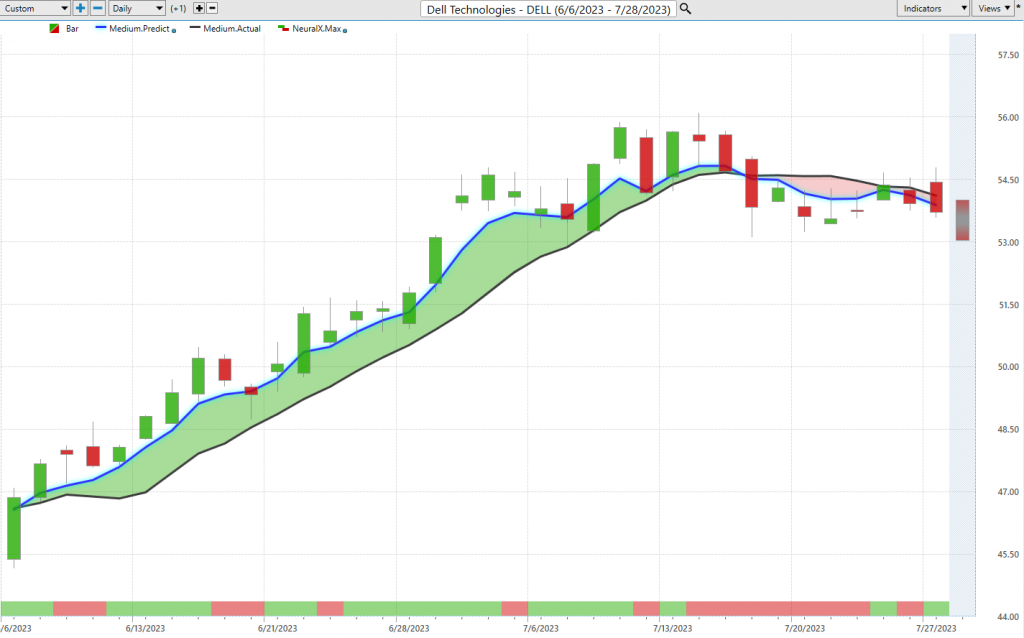
Now, if you were listening closely last week, you’ll hear I said, things are looking a little toppy in some of these stocks, and this is exactly why you want to be positioned in the right things. Well, here’s Dell Technologies. And so, we can see here exact same approach, blue line crossing above the black line, and we get a really nice rally. I mean, shares have been doing extremely well, pretty much all over the place, but over the past couple weeks here in Dell, while we’ve had a really changing of the situation here, right? 16% rally, but more recently, we’ll go ahead and take a look at this crossover to the downside here. And so, once you get that move, you recognize that hey, there’s a little more weakness across the tech space and you want to make sure that you’re not positioned in the wrong things over the next couple of weeks here, right?
So, if you’re positioned in some of these agricultural stocks, some of these energy stocks, things have worked out quite well, but you may want to avoid things like Dell Technologies. And so, you see that blue line crossing below the black line neural index, quite bearish here. And we can again look at those predicted highs and lows, so those very short-term values. And you can even see here on the top end really great entries if you want to go ahead and short, maybe hedge your portfolio a little bit, but just how quickly things change, right? So really nice opportunities to the upside for really a long period of time. But when that shift happens and when that weakness comes in, you really want to be prepared for it based on your trading style and your approach. So, again, just a little bit of weakness here, but again, a great opportunity to pivot the portfolio, move into some other things that can move things along a little bit more smoothly here.
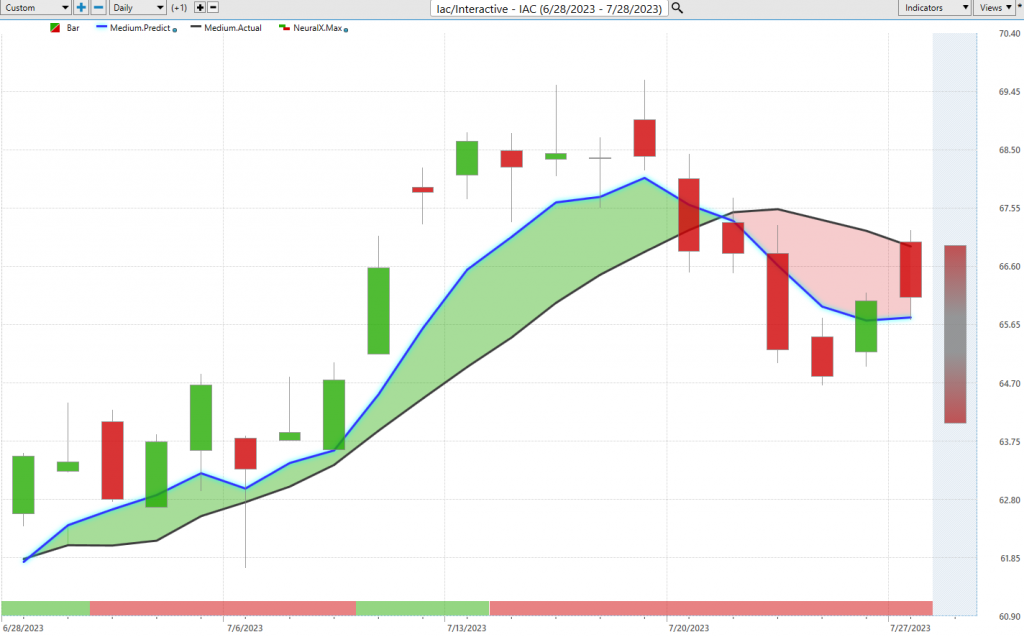
Here’s IAC InterActive and again, really a gappy stop things moving or stock, but things moving around quite a bit here, some gaps on the chart. But just I want to highlight is it all works the same whether you’re bullish or bearish. You get that blue line crossing above the black line, really choppy, sideways period here, but then that neural index gets bullish, and you see a lot of momentum. But look how consistently that neural index has been bearish as the market has declined. You really get those very early clues that say, expect lower prices and eventually get in that crossover that says, look, you definitely do not want to be long here. Maybe look to go ahead and short take profits on shorts. And again, you see these predicted high is doing a good job of letting you know where that market’s likely to trade intraday to potentially set positions and potentially hedge things.
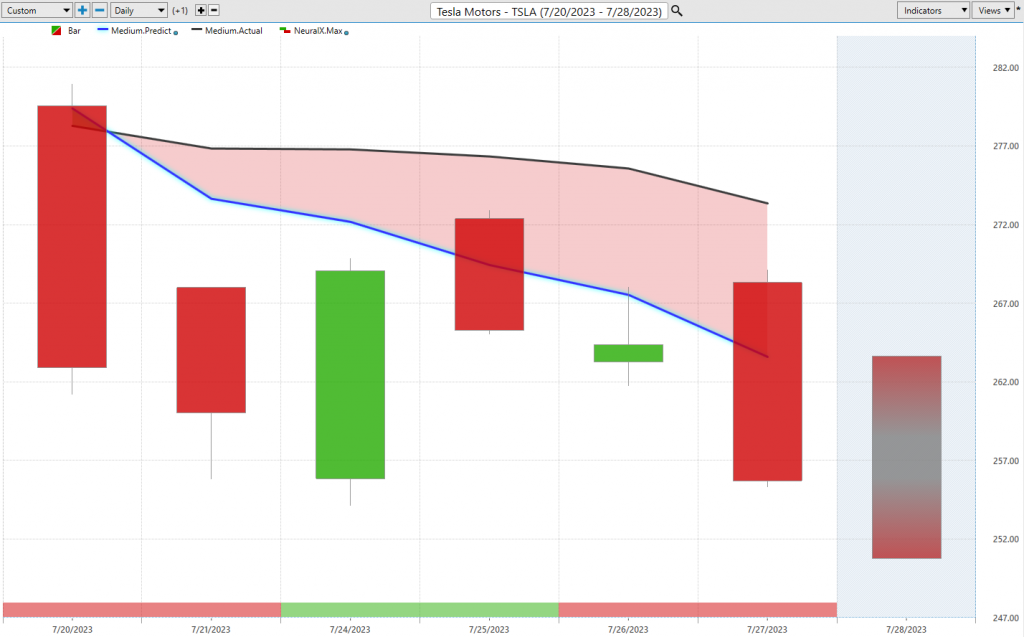
Lastly here, we’ll just take a quick look at Tesla. And again, this is just back to understanding that there’s a little bit more sideways action going on in the tech space, and we see that blue line crossing below the black line neural index gets bullish here. You get a little bit of a gap up, but let’s take a look at those predicted highs and lows, and we can already see that it’s really screaming at you up here. You really don’t want to be long the market there. You’re very likely to see some weakness and you see the market quickly moving down to those predicted lows and having a pretty strong close there. Most recently, this being Thursday’s forecast, a video happening here before Friday’s open here.
So just wanted to highlight a lot of these really nice opportunities on the bullish side against this really tremendous profitable opportunity here. A 16% rally in 14 trading days. Really small position there. It can have you up a pretty decent amount. Really, it’s a thousand shares or so, you’re up about $11,000. But again, just a really good opportunity to understand how these tools work. So, if you are interested, go ahead and click on that link in the description below. You can get a specific demonstration based on the markets you’re trading and really the type of style and approach that you like to take here. So, once again, this has been our Hot Stocks Outlook for July 28th, 2023. Thank you all for watching. Best of luck out there and bye for now.