


VantagePoint AI Market Outlook for the Week of November 2, 2020
VIDEO TRANSCRIPT
U.S. Dollar Index
Hello, everyone. Welcome back. My name is Greg Firman. And this is the VantagePoint AI Market Outlook for the week of November the 2nd, 2020. Now to get started this week, again, we are going to have an extremely volatile week this coming week. We’ve got the Nonfarm payroll number on Friday, we have the FOMC announcement and of course the US election. So the recommendation here, of course, would be to limit all trading until we get a better idea where this election is actually going, what the fed is talking about.
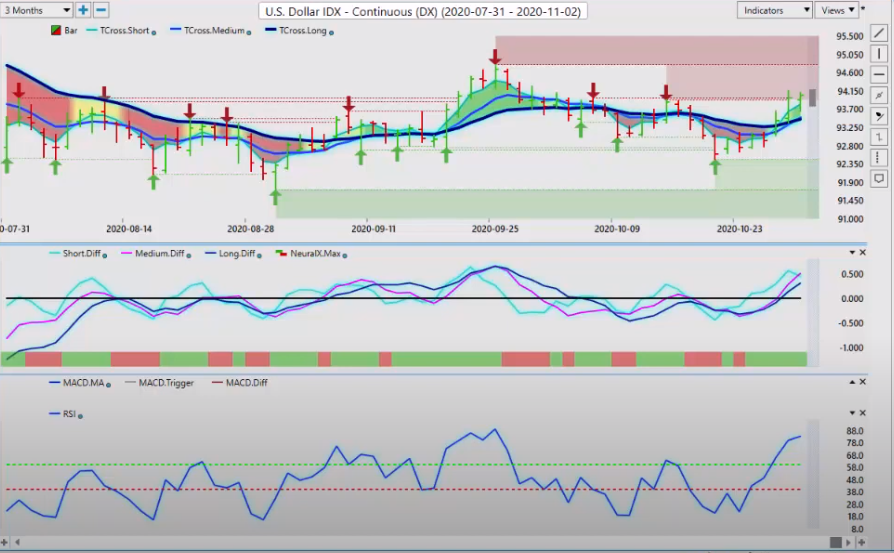
But there are certain things we can discuss. More specifically, in last week’s presentation, I outlined that it is very likely we will see the dollars start to rally towards the end of the week. That has come to fruition. Now, the reason behind that also is that we have our neural index turning green, our medium term crossing our longterm predicted difference. But we have a known cycle that I’ve noticed with the dollar is that it’s usually strong at the end of the month ain the first week of the new month, then it tends to sell off on the Tuesday after the Nonfarm payroll number.
I don’t see that anything really changed here and that there are banks and governments that need to buy dollars. So demand for dollars is usually around this particular time in the foreign exchange market. So when we look at where we’re at now with the dollar, the dollar is going to have an epic battle coming up this week, whether it’s going to sell off and gold’s going to advance or vice versa. But again, when we look at these key levels, we are still struggling around this 94 level on the dollar index, with major resistance all the way up to the high at 94.79. This is the levels that you want to watch after the payroll number. Now, if the number is good, if the number’s bad, I haven’t seen any difference. The dollar is sold off either way in most cases after that.
So again, just like this cycle that we talked about in last week’s presentation, we’re looking for a reversal of that, again, going in towards the end of this week. Now the election is definitely going to be a … It’s already shaping up to be a wildcard here. Too close for me to call. So again, there’s going to be implications. When we look at it, our predicted differences are still rising with the neural index. Our predicted RSI is 83.3. Just because something is overbought or it’s reached accumulation distribution or one of these, things that doesn’t mean it’s going to turn around, guys. Right? It’ll turn around at a point of value. So when we look at this right now, the point of value in the VantagePoint software, that’s coming in at the T Cross Long at 93.44. We would remain long the dollar as long as we’re staying above this level.
If we click on our F8 in our VantagePoint software, we can then have the predicted moving average by itself. That key level is 93.62. So if you’re looking for a point of value in buying the dollar, you can see how the market, once it broke above this blue line. We’ve come back on a daily basis, three days in a row, and tested that exact predicted moving average with the correlation to 31 other markets. I’m not so much looking for the blue line crossing the black line as I’m looking for the market to hold above this critical level.
S&P 500 Index
Now with that dollar moving higher, of course, the inner market correlation that we’ve discussed many times here and in the VantagePoint Live Training Room is again that inverse correlation between the dollar index and the S&P 500. One goes up, one goes down. So the main trigger here, as you can see, we formed resistance. We have a series of lower highs that I discussed again in last week’s market outlook. We’re looking for this level to actually hold, this point of value at the T Cross Long, which is at 3430. The very first day, we closed below that particular blue line, that was the trigger that we started to move lower.
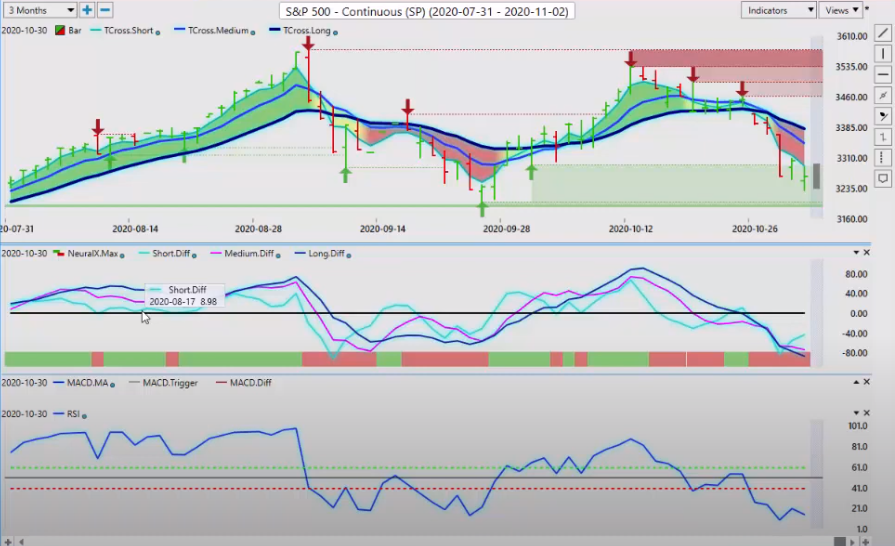
Now, again, if we click on our F8 in our software, we can see that the market trying to hold above this, but it’s just unable to do it. Monday’s close, we hit this level and down we go, taking a very hard move down. Now, my view on the S&P 500 is that the point of value for us is way up here at 3329. If you’re impartial to shorts, you want to continue shorting this thing, then this market is out of balance. You can use terms like market profile. I’m just going to use a term, very generic term of point of value. So for a point of value for buyers or sellers are going to be near this predicted moving average. So if we get above this blue line, that could trigger a reversal.
Now we also have the yearly opening price down here, that again, I’ve discussed in the VantagePoint Live Training Room and here on the presentations. But again, watch this level down here at the low of 3,200. If the buyers are going to step back in, it’s likely going to be soon. And as you can see, we’re already starting to have a couple of up days here, but we’re still making new lows. When we stop making new lows is when we could see a reversal. But again, our medium term is crossing our longterm predicted difference, warning us that we could be getting ready to move higher.
Crude Oil
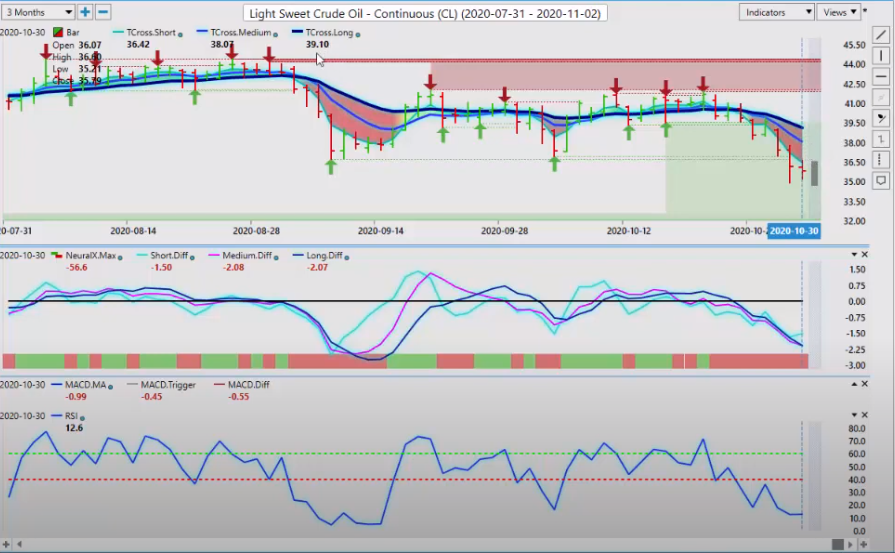
Now, of course, with oil, that’s going to tell us with oil. But again, oil could break away from its correlation to the S&P 500 based strictly on supply and demand issues. Hurricane season is over. But again, the value here of continuing to short oil with a T Cross Long at 39.10, we’d be looking for some kind of retracement from the S&P 500. And I still believe that, at least initially, oil will probably follow, if we get that retracement and the S&P 500 is doesn’t move any lower. But the inner market correlation is critical here. The predicted RSI, sitting at 12.3. So it is getting a little tired down here, to say the least. But that certainly doesn’t mean that it can’t go lower.
Bitcoin
Now, as we look at what’s growing to be one of my favorite investments, I have to say, is of course Bitcoin. I have been a strong advocate for buying this thing, ignoring anything that Warren Buffet has to say about Bitcoin. This thing, is again, up over 90% on the calendar year. Again, in 2020, just like it was in ’18 and 2019. They had good years then too. But again, I don’t know of any … Bitcoin has far outperformed the S&P 500. So if Mr. Buffett wants to continue to talk about it being a scam, well, he’s free to do that. But guys, I’m looking at the VantagePoint forecast here on Bitcoin, and they have been very, very solid.
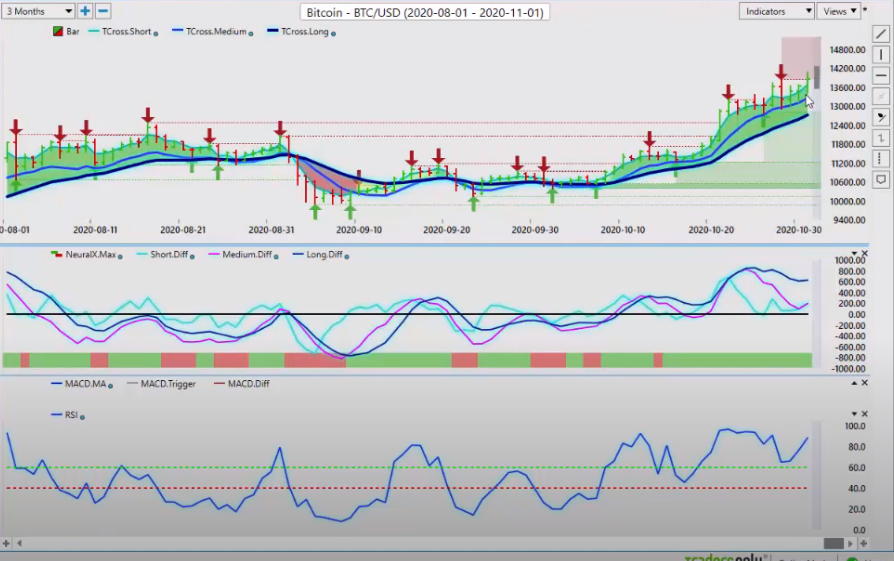
When we bring it down to our F8 by itself, this is again, that point of value. Using that, you can see how Bitcoin is hugging this blue line by itself. There’s very little confusion here in this particular chart either. We’re using that blue line, again, is a point of value to determine longs and short. You can straddle the blue line. There’s a number of different strategies that can be used with this. But for now, Bitcoin remains bullish while above 13,448. But watch out for the T Cross Long.
Again, we’re going to have a very, very volatile week and we are in a period of known dollar strength. So when we look at Bitcoin, I treat Bitcoin like I would like a FOREX pair. It’s trading against the US dollar. If we’re in a period of known dollar strength, then we could see Bitcoin pull back significantly by this coming Friday. Because again, this is an outlook, not a recap. Right? So when we think of it from that particular perspective, then if Bitcoin sells off a bit, that gives us yet another buying opportunity. So keep a very close eye on those key levels to see if they’ll hold. And if it does, in my respectful opinion, Bitcoin is very likely to move higher towards the end of the year, not lower.
Euro versus U.S. Dollar
Now, as we look at some of our main FOREX pairs, once again, the pundits have said that the euro, the best trade ever, it’s going to go to 1.25. And before you know it, we’re back at 1.16. This is the benefit of the VantagePoint software is that we can identify verified resistance owned. After the euro made this breakout point of 1.20, it is done absolutely nothing since except basically move within a tight range and ultimately moving back lower. Things are not good in Europe, guys. They’re not good at all. You’ve got potential lockdowns. They’re talking about lockdowns starting back up again. You’ve got the DAX 30’s been in trouble. Investment into Europe has been very minimal. So once again, is the euro really the number one currency? Well, that’s left to be seen. But if the dollar reverses after the payroll number, then we may have a decent buying opportunity.
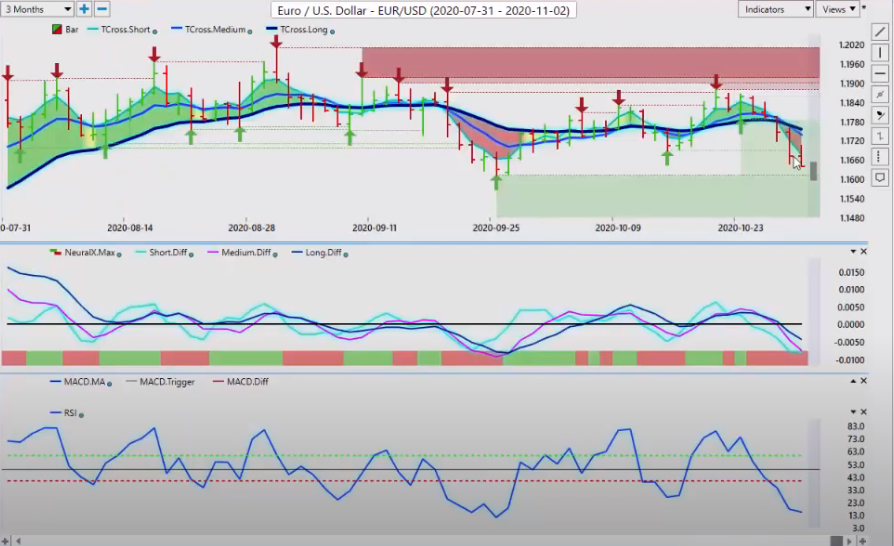
Down at this low, to start the week, 1.1613, that’s the level you want to watch. The RSI is an oversold territory at 15.1. But once again, guys, it doesn’t mean that it can’t move lower. Trading off an overbought or oversold signal is one of the most unreliable signals out there, guys. We have to look at the inner market correlations, the point of value. Right now, the point of value for me with the euro is way up here at 1.1757. I personally am not interested in shorting down here.
At the very minimum level that we would look at is again, our long predicted, our predicted moving average, 1.1723. We’re looking for the market to come back to this level, to test it, to see if we can hold below that particular blue line and close below it. If it goes above it during the day, I’m not too concerned. But if it closes above that blue line, that will be a warning sign. You can see that as we broke down back here at the beginning of the week on October the 26th, the very next day we closed below it. Then you can see on Wednesday, we test the blue line. Thursday, we test it. Friday, we didn’t test it. So it could be getting ready for a retracement. But the key thing here, guys, is of course is know your levels.
British Pound versus U.S. Dollar
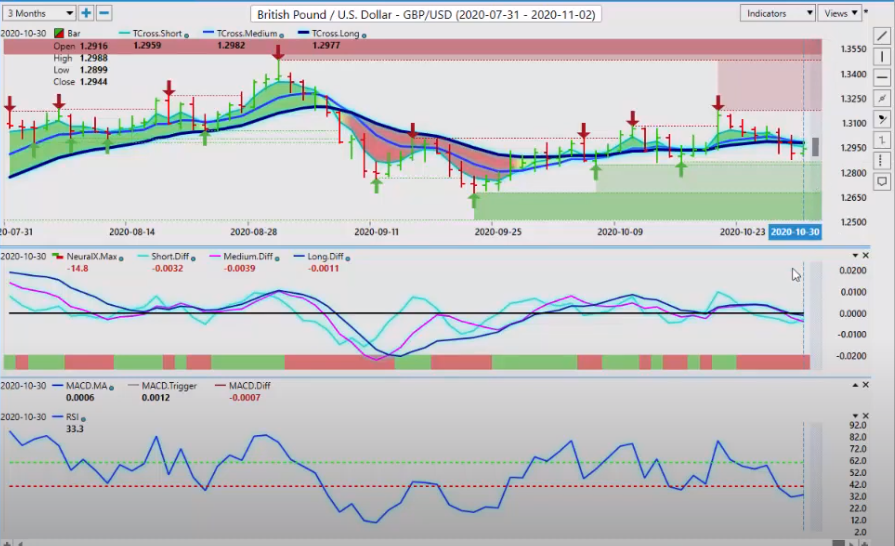
Now, the pound dollar here, once again, moving sideways. We’re all waiting on Brexit. The signal for now, right now during this period, is still suggesting that the pound dollar is going lower. We had another retracement back up here to, again, the point of value at 1.2977. We click on our F8. We hit that level to the number on Friday only to turn around and fall lower. Now our neural index is down. Our RSI is below the 50 level and below the 40 level. Both suggesting the pound has more downside ahead. But the volatility and we’re going to see what the ADP report says on Wednesday. But again, with the election in the US, the pound could benefit on dollar weakness. So we’ll continue to watch these levels. But for now, 1.2980 to start the week is the level we want to hold below if we’re going to continue to short this. And we don’t want to look at shorts until we get near that particular level.
U.S. Dollar versus Japanese Yen
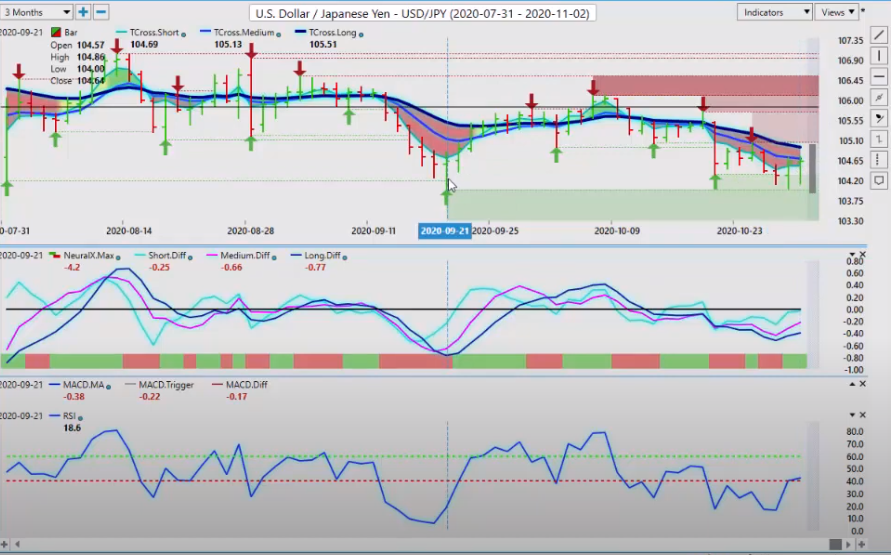
Now, as we go into the dollar/yen for this week, could be again, a very choppy week. We’re banging into this verified support low. That’s coming in at 104. I think that there’s a very strong possibility we could break down below 104 this week, but it would take the S&P 500 selling off. As you can see, little bit of dollar strength here is still not enough to push us above the T Cross Long at 104.95. When we click on our F8, we are challenging the long predicted 104.58. So as you can see, in the VantagePoint software, we have this red ominous cloud that forms over that blue line. Which is basically saying, “We’ve got to close above this and stay about this level if we have any chance.” But for now, the 105 level, keep a very close eye on that.
Now, as I’ve stated many, many times on this AI Weekly Outlook, that again it’s an outlook. Not a recap of something that’s already happened. When we discussed this last week, we talked about the S&P 500 and three main currencies, well four, but three that are very heavily affected, the Aussie, the New Zealand and the CAD. They’re all affected by whether the S&P goes up or down. So if the S&P is going up, we want to be buying these currencies. So as the S&P 500 crashed last week, you can see that the US/Canadian went significantly higher, back into these VantagePoint verified resistance zones.
Now we’ve tried … This is the immediate area that we have to be careful of, 1.3340. You can see that we poked above it and then slipped back under it. Again, when we look at predictive indicators, we watched the medium term crossing the longterm predicted difference when it’s triggered with the neural index.
U.S. Dollar versus Canadian Dollar
So to start the week, we’re still bullish here on the US/Canadian pair, providing the S&P doesn’t break back out to the upside. So that key level, T Cross Long, 1.3228, we would be buyers down to this level.
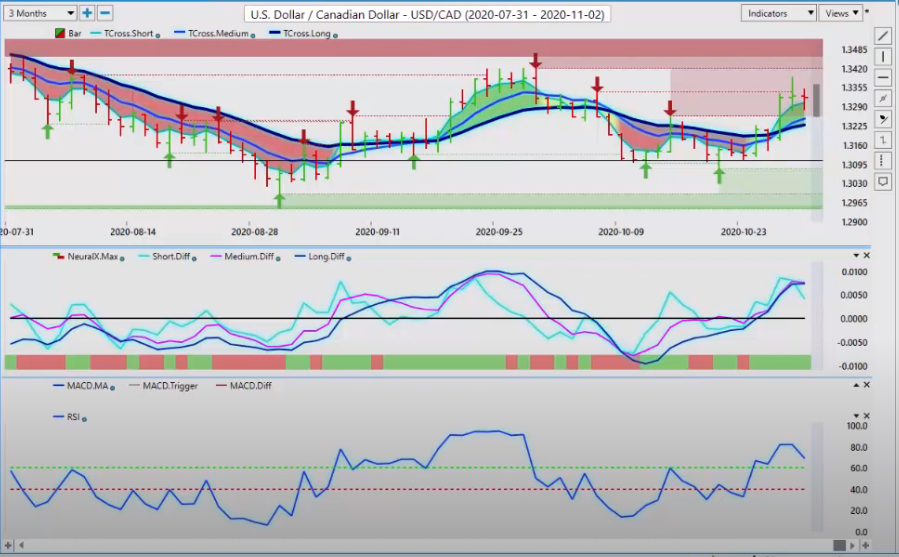
When we click on our F8, again, our F8 back over here. If we click on the F8, we can see that key VantagePoint level, that’s coming in the long predicted 1.3266. So we know where our support levels are, 1.3266 and 1.3220. We need to hold above that. Now, if the medium term crosses the longterm predicted difference and the neural index turns down and the RSI breaks down below 50, that is a very good trade set up. So we want to watch that, again, very closely to see if we can hold above our first main level.
Now for Monday’s session, we also had the VantagePoint predicted low at 1.3259. So all of our support is sitting just about 1.3220. That’s the area you want to watch for potential longs.
Australian Dollar versus U.S. Dollar
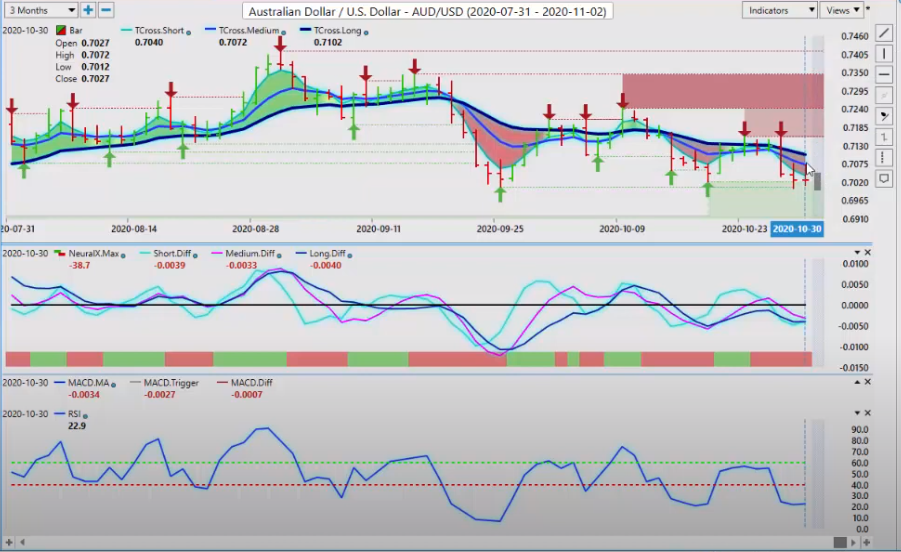
Now with Aussie/US and New Zealand/US both of these pairs again are going to be affected very clearly by the S&P 500. So again, when we have our tools, like we have Waves, we have Fibonaccis, we have Stochastics, [Mac Ds 00:00:14:39], all of these wild and wacky accumulation distribution. But the inner market correlation will be the driving factors. So we’re measuring that by the S&P 500 and using these key pivot levels from VantagePoint.
0.7102 is a critical level. Now, if we click on our F8, once again, you can see that we’ve been challenging this blue line for the last two sessions. That level coming in at 0.7061. So if it breaks above 0.7061 and closes above that level, we are likely going higher. But again, it will be dependent on the S&P 500.
New Zealand Dollar versus U.S. Dollar
You’ll be looking at the exact same signal on New Zealand. That T Cross Long, 0.6640.
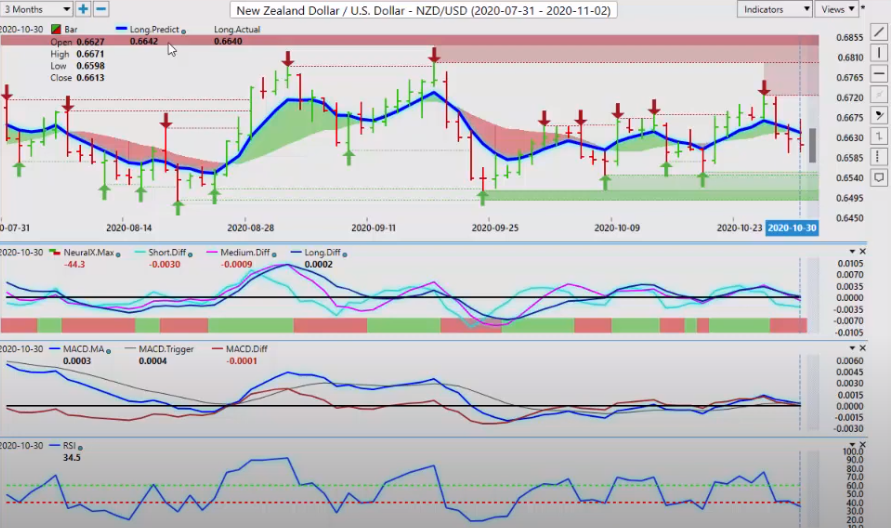
When we click on our F8, we can clearly see the pivot area of that blue line, 0.6642. If We break above that the S&P 500 extends its gains. These two pairs will recover and the dollar will come under pressure. That’s what we would be looking for when we’re buying these pairs. But again, traders tend to get confused by adding a large number of indicators onto their charts. Again, the more moving parts you have, the more likely something is going to break down. So keep that in mind. Once again here guys, we have a very, very volatile week ahead of us. So my recommendation, as always, is to know your levels and to limit trade.
With that said, guys, this is the VantagePoint AI Market Outlook for the week of November the 2nd, 2020.
Are you using A.I. yet?


