


Hot Stocks Outlook for the Week of
January 29th, 2021
The Hot Stocks Outlook uses VantagePoint’s market forecasts that are up to 87.4% accurate, demonstrating how traders can improve their timing and direction. In this week’s video, VantagePoint Software reviews forecasts for BJ’s Wholesale Club Holdings(BJ), B&G Foods(BGS), Campbell Soup(CPB), Williams-Sonoma(WSM), Dick’s Sporting Goods (DKS) , LasVegas Sands (LVS) and Walt Disney (DIS)
Register for a Free Live Training
This Week’s Hot Stocks Outlook
Hello again traders and welcome back to the Hot Stocks Outlook for January 29th, 2021. Hope you’re all having a excellent week in the financial markets and as always a lot to cover in this week’s outlook, which has really been one of the most exciting weeks in the financial markets. We have a lot of very strong, compelling narratives happening in different areas of the market and it’s opening up tremendous trading opportunities. So we’re going to start here. We’ve got BJ Wholesale. We also got BG Foods and Campbell Soup, a lot going on in the area of food. We’ve also got Dick’s Sporting Goods, Williams-Sonoma so some retail and a couple of entertainment stocks here with Las Vegas Sands and also Walt Disney here.
BJ’s Wholesale Club Holdings(BJ)
So starting out here with BJ Wholesale and this is a really great example of how this technology works and can really direct you to the appropriate places in the market to make a lot of money. Now, right up against… These are daily bars. So each one of these candles represents a full and complete trading day. And you’ll notice that there’s a black line and also a blue line right up against that price data. Now the black line that you see there, that is a simple moving average, very common technical indicator. But it acts really as a measure of where market prices have been. Because it’s always looking in the past and really gets plotted by that most recent close price.
So we use it as a measure of where things have been, but what we want to compare that value to, or that black line, is the value of this blue line. And so for that number to be calculated each and every trading day, Vantagepoint is performing what’s called intermarket analysis and utilizing the technology of artificial neural networks to do that. So what does that mean? Well, that means that the software has figured out what markets are known to drive and influence this target market.
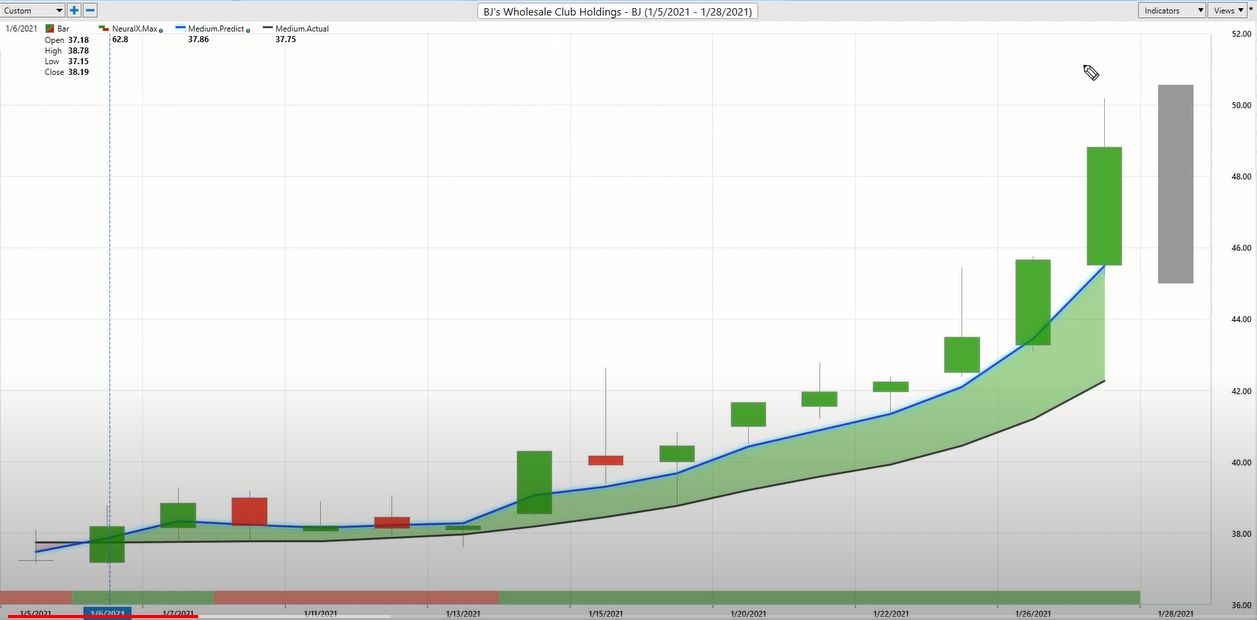
And so what it’s able to do is, it’s looking at ETF groups, it’s looking at individual stocks, it’s looking at things like the S&P 500, global currencies, global interest rates, futures markets, commodities. And looking at those relationships and actually utilizing that information to generate future price predictions. So some things can have positive relationships or correlations, some can have inverse correlations. There can be leading and lagging relationships. And that’s where the technology comes in and is able to analyze that data appropriately. And so what it’s able to do is actually generate future price predictions, so things that have not yet occurred, and use that information to actually build into the value of this blue line. So turning what was a lagging average that just gets dragged around by the past, into a forward-looking predictive tool.
Now to continue on here though is, you look at the bottom of the chart, we have this green and red bar, and this gets updated after each and every trading day. And this is also derived via that neural network process, but you have to train artificial intelligence, you have to train it what to do. What sort of timescale is it looking at? What problem is it trying to solve? Well in the case of the neural index, this is a very short term forecast of strength or weakness over the next 48 hours. Or you can think of it just as a couple of trading days. And lastly, you have another set of these neural networks really driven to find what is the next day’s predicted high and predicted low. So sort of separate technologies there, pointing out each one of those values so that you have good intraday levels to go ahead and place limit orders, profit targets, really however your trading style works is going to help you really pinpoint those entries.
But again, once you recognize those shift changes, as far as the overall trend direction, that average price are expected to move higher. Well, you want to look towards those predicted lows and we can actually see how accurate all of those predictions are against the then actual price data. So what happens is, this is the prediction you see moving forward, and that will fill in with an actual candle. And that’s what you’re looking at back here. So you can understand that, okay well, you’ve got these predicted ranges so that, hey look, let me try to buy at the lower part of the range. Ideally close towards this predicted low and get involved with the market. You’ll also notice that the neural index here, forecasting look, there’s some short-term weakness. Things aren’t in an uptrend, expect some lower lows, expect to trade near those predicted lows.
But the overall trend is up, that blue line’s still above the black line. And that highlights that this is a good opportunity. Stay long, make sure that when you get into a market you don’t get out of it too early before all the profits come through. So here we have a 27% rally in the past 14 trading days, I believe. 500 shares here has you have about $5,300. Now, this is really exciting. We’ve seen a lot of the food companies do extremely well. And what you tend to notice here with vantage point is all of these forecasts coming through in similar stocks at the same time. And that’s where it makes it very clear to understand which stocks are doing well, which stocks are doing poorly, where should I focus my attention in the marketplace?
B&G Foods(BGS)
So here we have BG Foods. You see this crossover to the upside, that neural index just as bullish as it can get over this entire time period.
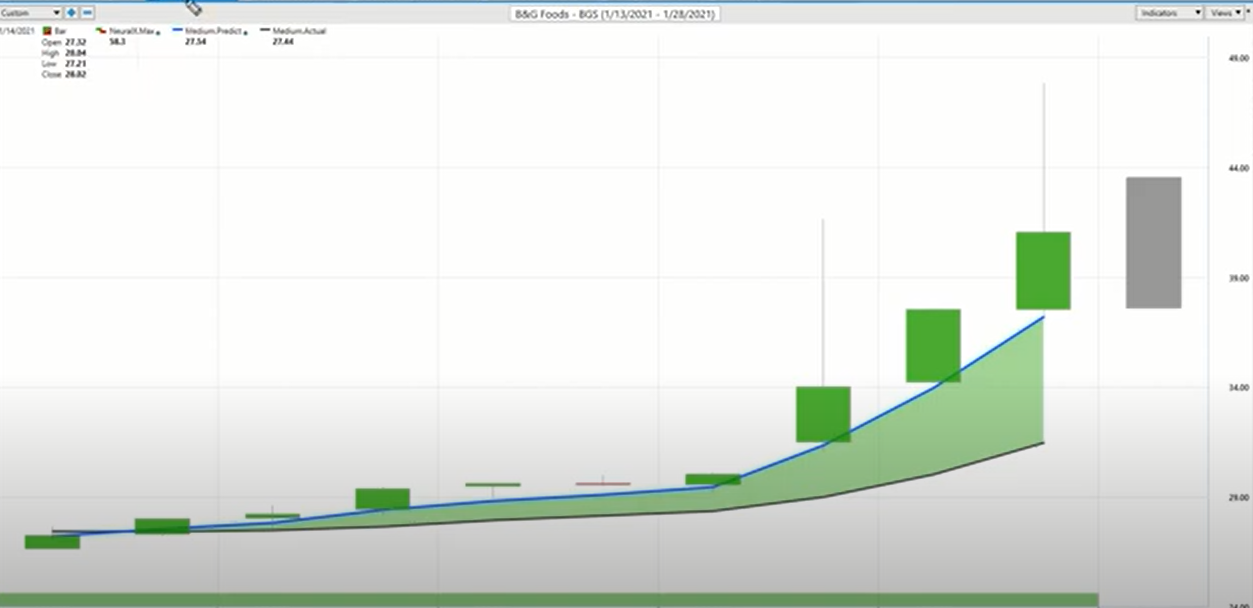
And of course you can use those predicted highs and lows to say, okay well, where do I want to get involved? Well certainly at those predicted lows. And then once things really start breaking out, you better have gotten a position ahead of time because once these things really start moving, it’s not easy to jump onto something after. Especially you’ve got these gaps on the chart, but that’s where there’s a lot of profit potential, is when that market is really accelerating to the upside, gaping up. Here’s a 50% rally in eight trading days. Again, just 500 shares there will have you up about $6,700.
Campbell Soup(CPB)
Here we have Campbell Soup. So again, to that narrative of food companies, we also saw General Mills, a lot of this stuff, the same narrative here. Blue line crossing to the black line. And what we can do is actually run in an IntelliScan. And that’s going to actually find these fresh crossovers and you can sort all that by market type or sector.
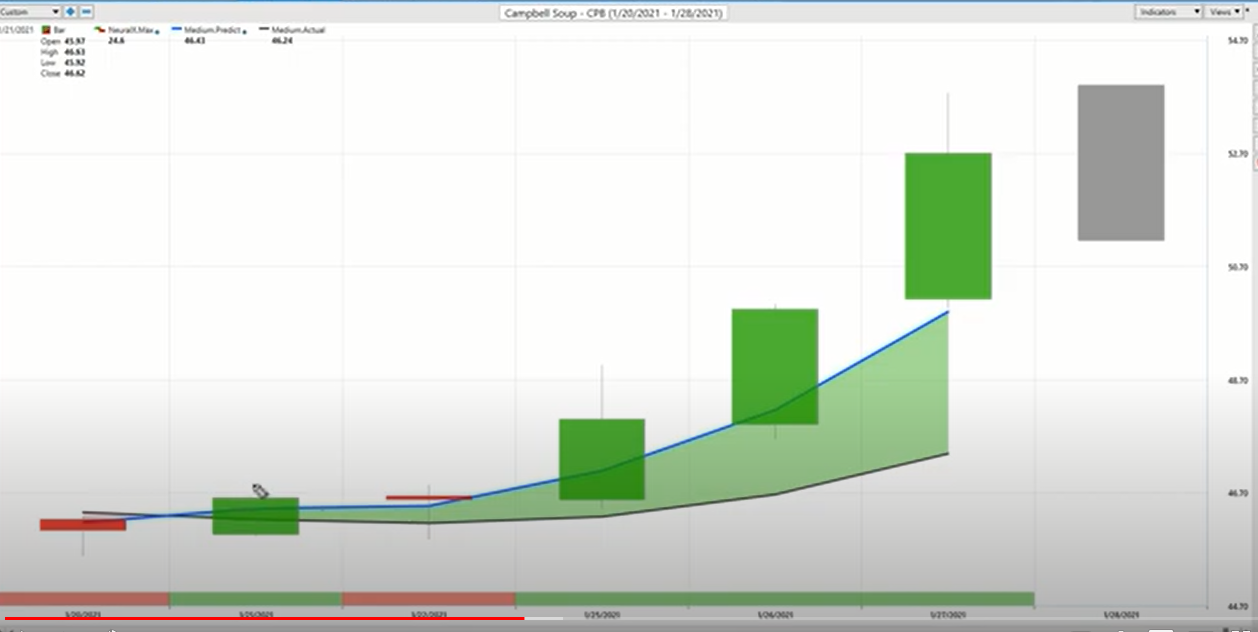
So you can look at, let’s look at all the basic material stocks together. Let’s look at all the energy stocks and really be able to build that compelling case for your trading plan going into the week. But also again, have that daily plan of understanding look, if I’m going to buy today, where do I want to get in? And this is really critical to have these levels. Because when you set limit orders, you see that the market often does not spend much time down here. There’s not a lot of volume filled there and you need to have your orders ready to go before the market opens so that you can make sure you get a really nice fill. Don’t have to run a huge stop-loss, but still benefit as the market accelerates to the upside here. So you’ll see in three days, pretty much this entire move about 15%, 500 shares there has you have about $3,300.
Dick’s Sporting Goods (DKS)
Dick’s Sporting Goods. A market we looked at a couple of weeks ago here. But just like to update these things, to really highlight that look, you can recognize a trade is starting, but the big thing is not whether you get in back here, it’s how you manage it over the course of the trade. That’s going to determine if you’re pulling out a lot of money out of that move. And so once again, we can see these areas where the neural index gets a bearish and you get a little bit of sideways and weakness there. I always like to look at this as an opportunity that says, look, expect average prices to move below this very accurate predicted moving average. If that’s an accurate forward-looking measure of average prices in the future, well we can always trade above and below an average. So expect over that 48 hours that we get some of those moves below the average.
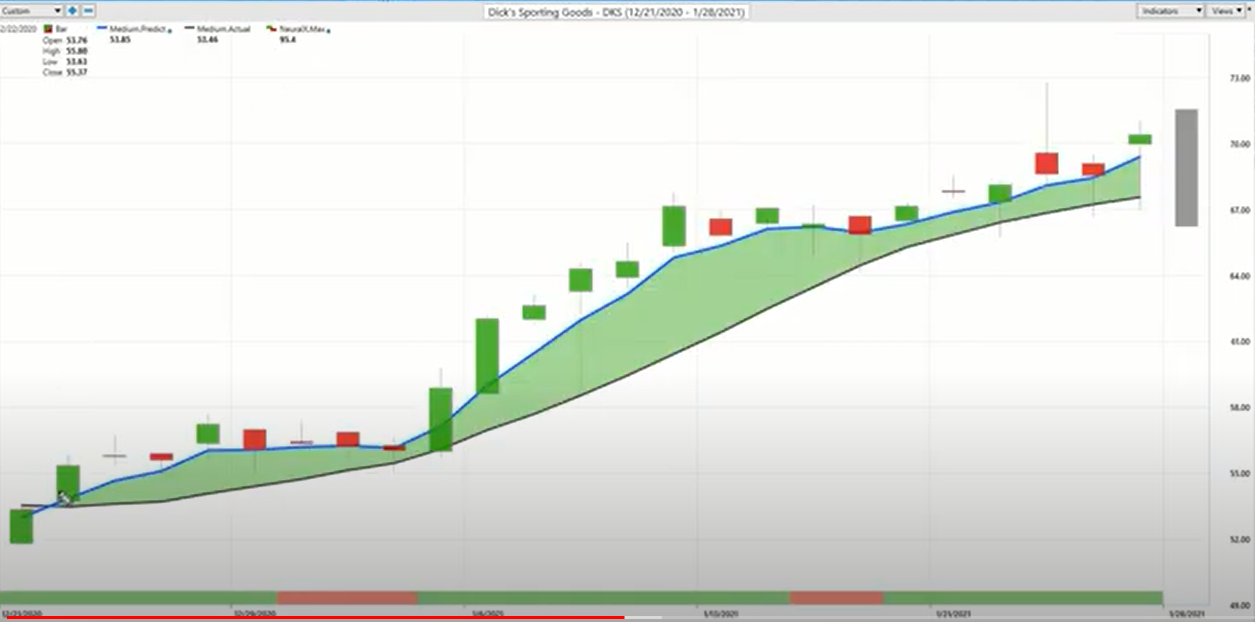
And of course you then can pinpoint your entry price with the help of those intraday predicted high and low levels delivered from that neural network technology. And you see here on those dips, really nice entries where the market’s dipping down, quickly moving higher and accelerating to the upside here. We’ve got about one, two, three, four, five, six, seven, eight. So imagine the situation where you’re starting your position back here early when that trend begins, but then able to add to that position along the way, especially with profits you’ve made over many of these moves, can allow you to build a larger position and make even more money than the static way of looking at this. Where it’s like, okay, well if you had 500 shares back here, you’re up about 26% over the last 23 trading days, excellent move, over about $7,000 profit. But you may be able to buy a thousand shares up here with some of those profits as that trend looks to continue.
Williams-Sonoma(WSM)
Here’s Williams-Sonoma, crossover to the upside here very clearly, neural index pretty much bullish. You have one day here where you come out of it, but this indicator overall, over all the markets that you trade, accurate essentially four to five times up to about 87, 88% accurate. And then you combine that with these other tools to really pinpoint entry price and all these things. And it’s going to make a huge difference as far as executing that trading strategy as efficiently as possible. So again, here we can see these are the predicted lows coming through. You see often in the early part of this move, what’s happening here is the predicted moving averages are allowing you to recognize a trend reversal earlier and recognize, okay here’s the opportunity to get involved. And when you’re early, that can allow you to get an entry in when prices are just sort of meandering around. Where the market really hasn’t realized, oh, there’s a real opportunity here and shares are drastically moving higher.
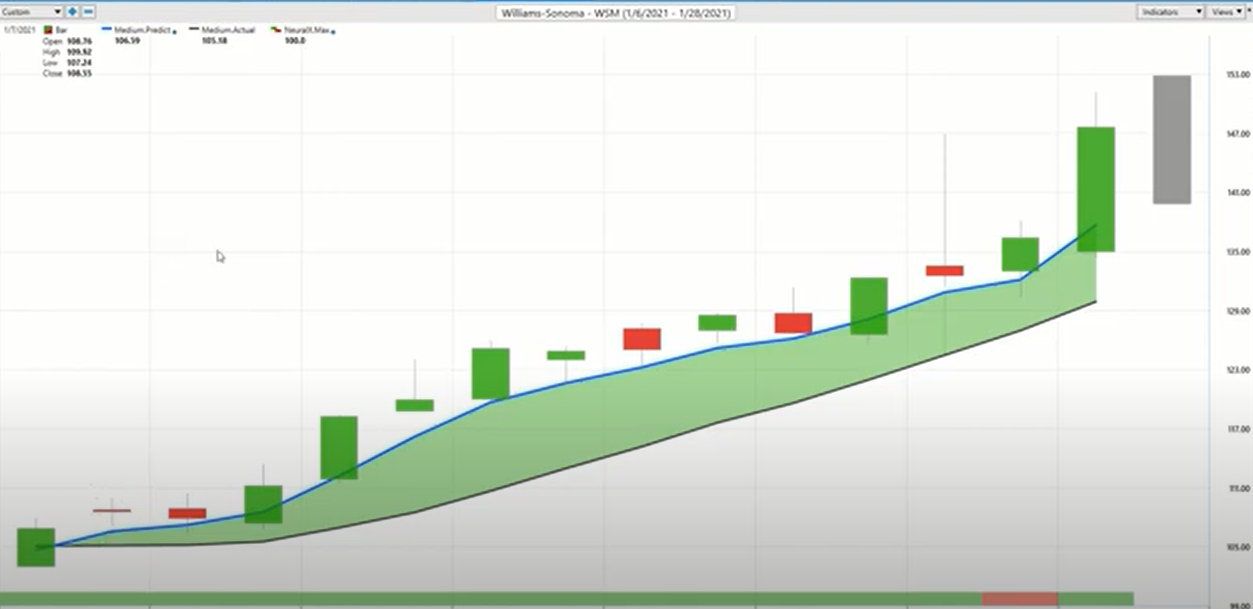
And that often again, allows you to get that early entry position. You see these two days, even after this trading day here, predicted highs and lows sliding lower, saying hey, expect things down here. And then things really rapidly accelerating to the upside. But the great thing again about this technology is that it’s adaptive. So when the market’s closing here and volatility is picking up, it understands, hey let’s take that into account. Let’s update these predicted ranges by looking again at those intermarket relationships to help really pinpoint those levels in the marketplace. So here we have again, a very nice move to the upside, 36% rally in the last 13 trading days, again 500 shares there has you about $20,000 to the upside.
It’s the same with options. Whether you want to know, where should I start buying those calls or put contracts. And you can of course manage that with actual shares as well.
LasVegas Sands (LVS)
Here’s Las Vegas Sands. So just wanted to highlight, some of these things not doing well. And we’ve highlighted things like FedEx and some areas that you absolutely want to avoid. But when you’ve got these things really working well, but you also understand where you might want to set up some hedges and areas to actually short the marketplace, that’s going to be a very powerful tool for regardless of what occurs in the market. If we get a lot of volatility in the S&P 500, you’re going to have something that’s really, really working for you. But here in Las Vegas Sands, we see we have this crossover to the downside. And very clearly you saw that with Wynn Resorts, a lot of these hotel stocks, you see that, hey there’s a problem going on here. It’s almost the opposite of the food stocks, where you see a lot of really good opportunities opening up.
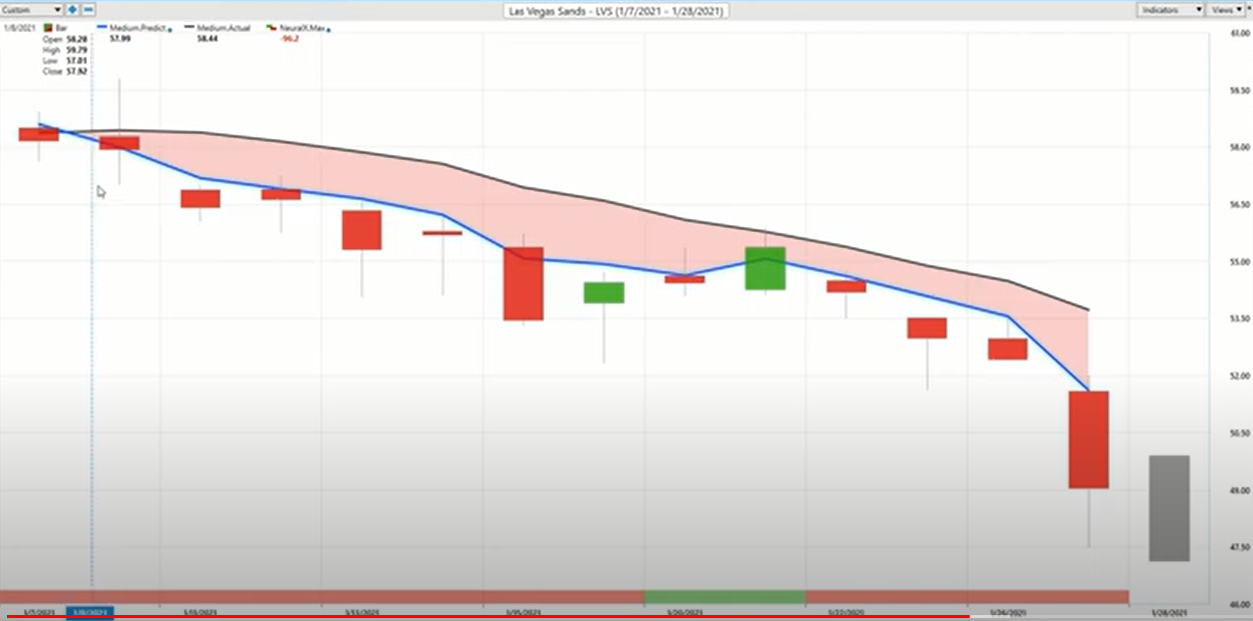
This really highlighting that, hey there are some dangers in the market. If you want to trade here at all, make sure you’re short taking profit if you’ve been long in the market, but very clearly there, that market not doing well over the past few weeks here. And we can see this market overall down about 14% in the last 12 trading days.
Walt Disney (DIS)
Lastly Disney here. This was a company doing extremely well. But this is the benefit of the software is understanding that, okay well, here’s the time where you want to come in and buy Disney. There’s where you get that opportunity for trend reversal. But you want to understand very clearly when to cut out that behavior. So if you’re in a buying campaign over this price period, well then make sure you use those predicted highs and lows. And where are you going to be buying?
Well, you’re going to be buying down at these predicted lows, only long because that blue line is pretty solidly above the black line over this entire duration here. You get a little bit of a gap up out of the area here, but you see those predicted levels doing a good job, little gap down here, immediately trading to the upside. And then here you see things start to shift. So we run a little sideways here. Let’s see exactly where that crossover to the downside is. We see right here making it very, very clear that you’ve got that neural index a little bearish over the time period. So expect a little bit of weakness, but once you get here very clear. Look, take profit on those longs if you’ve got any of them left and look to go ahead and short the market again from these predicted high levels, are going to guide you over that time period.
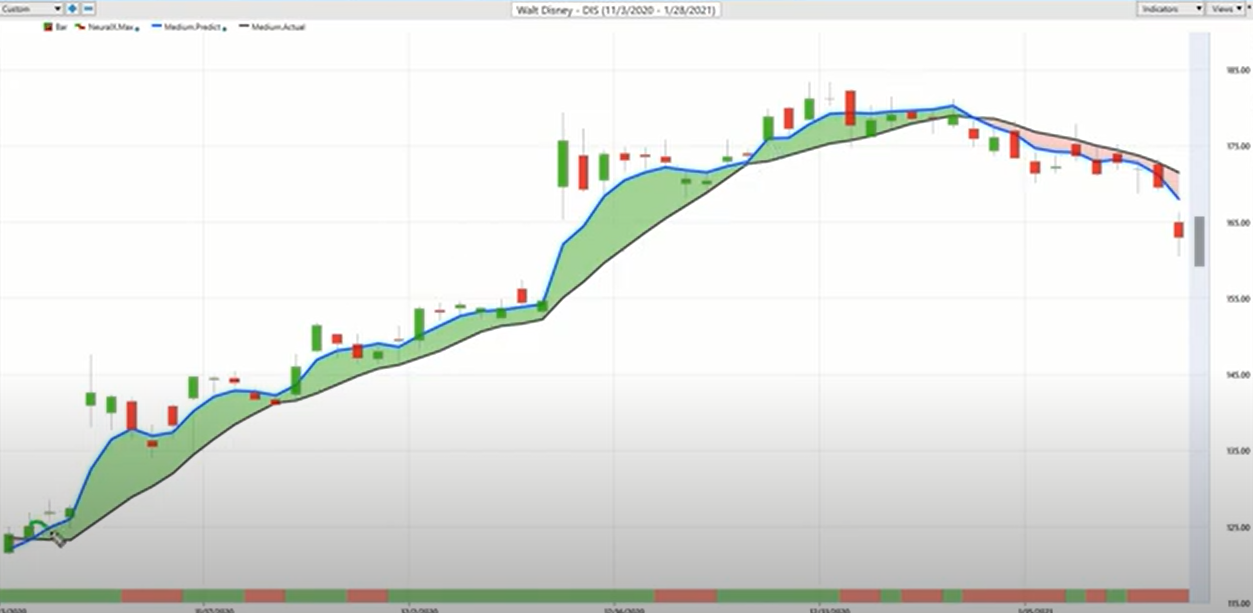
So it’s not about, again just taking that position, but every day walking forward with it and really making the most of it. Adapting with what is currently going on in the markets and taking in that new information via that neural network approach and adapting to it so that you understand which markets you should really hold on to and focus in on and things you just need to avoid. And maybe even get out of the way if you’d been long over a really nice period like this in Walt Disney. So we see here, shares here up over the longer haul here, up about 41% and very quickly losing about 8% there and things accelerating there to the downside.
So a little longer today, I know had a lot of markets I wanted to highlight. But it’s been just an extremely interesting, exciting period in the marketplace. And especially when you have a tool like VantagePoint, it makes it really easy to hone in on some of these important areas of the market, build that narrative for where you should be focusing and trading in the market and then let it rip right? So once again, this has been our hot stocks outlook for January 29th, 2021. Thank you all for watching, best of luck and bye for now.


