Register for a Free Live Training
The Hot Stocks Outlook uses VantagePoint’s market forecasts that are up to 87.4% accurate, demonstrating how traders can improve their timing and direction. In this week’s video, VantagePoint Software reviews forecasts for Franco-Nevada ($FNV), Transocean ($RIG), Reliance Steel and Aluminum ($RS), Abercrombie and Fitch ($ANF), Darden Restaurants ($DRI), Melco Resorts and Entertainment $MLCO, and Arcimoto ($FUV)
Hello again, traders and welcome back to the Hot Stocks Outlook For March 11th, 2022. Hope you all are having a excellent week out there in the financial markets, and like always plenty to cover here in today’s hot stocks outlook. We’re going to go ahead and revisit a lot of the oil, metal and mining stock companies.
So we got Transocean, Franco-Nevada, Reliance Steel & Aluminum. And what I really want to do is highlight the difference in how we can recognize sectors that are doing well. And we’ve been talking about these basic material stocks, week after week, after week, and that’s been a great area to focus your attention in the marketplace. But then there’s these other stocks, which if you could really name them anything, they’re more of the softer stocks, right? We’ve got Abercrombie & Fitch, so a retailer, some restaurant stocks and a resort stock here. And we can see the differences as far as where’s their strength in the market, where should our focus and capital go, and where should we maybe even hedge?
Maybe take some short positions to hedge those longs in the market. And lastly here, we’ll look at Arcimoto, which is actually a little electric vehicle company stock, but really highlights the benefits of these two rules on an individual market basis when you go in and make those trades.
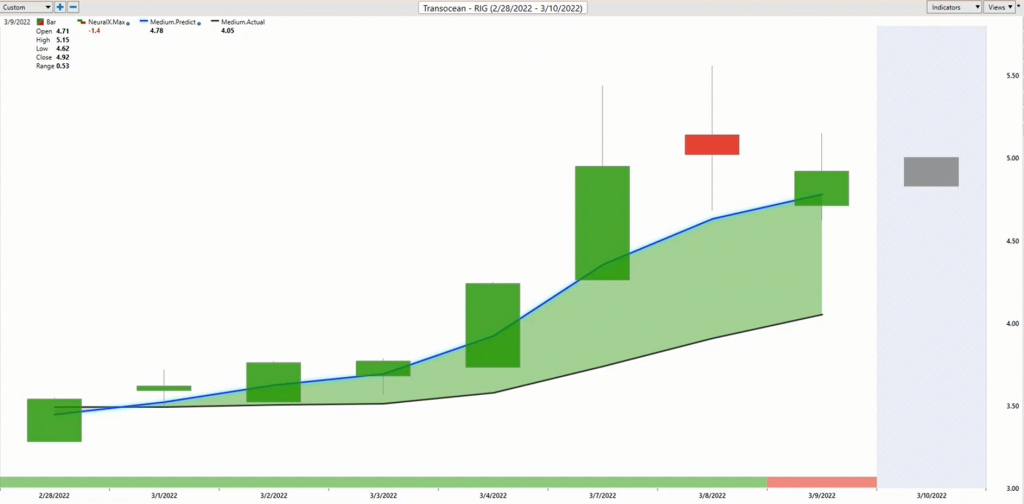
So starting out here, what we have is Transocean. So a symbol ($RIG). And what we have here is daily price action, right? So each one of these candles is representing a complete trading day. And right up against that daily price action, you’ll have a blue line and also a black line. Now, the black line that you’re seeing there, that is actually a regular simple moving average. So that’s a very common technical indicator. And in this case, what it’s doing is just looking back at the previous 10 close prices, and then it adds those all together, divides by 10, and it acts to smooth out the existing price action and let us know where a market has been over a given period of time.
And that’s why we refer to it as the actual simple moving average. But what we’re able to do is compare where those prices have been to where are prices expected to go next? And so what traders are able to do is actually compare that black, simple, moving average to this blue value. And so for that number to get plotted and calculated against the chart each and every trading day, this is where vantage points technology of artificial neural networks come in. Now, it doesn’t seem very hard to figure out that oil is having an impact on the stock market. And so this is why we’ve been looking at mining companies, oil companies, but when specifically trying to forecast for future prices in Transocean, this is where there’s known to be a specific set of markets that are known to drive and influence future price. So that’ll be obvious things like oil and the S&P 500 and the NASDAQ and global interest rates and the dollar index. But it’s able to find subtle relationships that are happening between ETF groups, that are happening between individual stocks within the sector, but also within other sectors.
And it’s able to of synthesize all of that information and actually generate a true price prediction of where things are headed next. And so it’s that price prediction generated via the artificial intelligence technology here, that’s taking that data and building it into the value of these indicators. Taking what was lagging indicators that really just get pulled around by the most recent close, into forward looking predictive tools. So whenever we see that blue line crossing above the black line, it’s really just suggesting that look, the neural networks are picking up and saying, average prices are going to start moving higher, and therefore you’d want to go long, take long positions. Well, here you have a 38% rally in the past seven trading days. And this is an area of focus, as far as the portfolio and understanding that look, things are being driven here. We have these forecasts coming through. We want to look for strength, but here’s where it really comes in as far as the short term trader getting the benefit of these other predictive indicators.
So if you look at the very bottom of the chart, you’ll see that there is a bar that goes from green and it can go back to red. And that’s a very short term, essentially a 48 hour forecast of short term strength or weakness in the market. So that same technology is looking at those inner market relationship and it’s forecasting future price, but tuned to solve a different problem here, just very short term strength or weakness, so the trader can be prepared ahead of time. And to round out the entirety of this forecast. If you look at the very right hand side of the chart, we have this shadow candle that we look at every single week and what this is, is an actually prediction of a predicted high and a predicted low value for the next trading day. So what you have to understand is you have this technology solving a lot of problems for you. So those neural networks are picking up on what is the overall trend direction from that predicted moving average?
It’ll give you a two day forecast for strength or weakness in the market. In addition, there’s separate neural networks, they’re going to pick up that predicted high for the next trading day. And another one that helps spot that predicted low. And what it does is it really takes these combination of tools and rounds out a forecast.
So in the case of Transocean, well, we have a blue line above the black line, neural index bullish, and then this roadmap going forward that says, “Well, look down towards these predicted lows to potentially take long positions.” And so again, we’ve seen in that, 35%, 40% rally to the upside, tremendous move here, but this has been going on for a long time. And so it’s not like we don’t know where to focus our attention in capital.
We bring in Franco-Nevada again. So just over the past week here, we see we’ve got another huge rally here, but this has gone on week after week, after week, we actually saw nickel prices go up almost 100%.
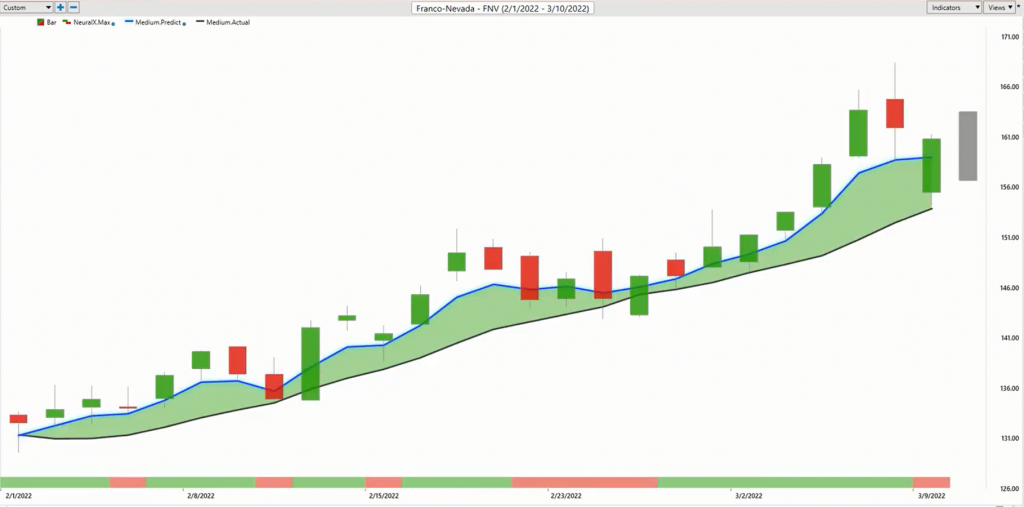
And there’s some issues there in the metal and mining space. You have a 20% rally just in the past 25 trading days. But looking more closely just here at the past week, we have our predicted highs and lows coming in and you see here actually beginning filled at the open there, right? If you gap down, market moves up, but more importantly, these things being recognized months ago, that this is an area of focus. We should look towards these predicted lows to accumulate a position. And as long as that blue line stays above the black line, well, we are in an up trend and can benefit off of these market relationships driving things.
Reliance Steel and Aluminum ($RS)
Here’s Reliance Steel & Aluminum. We looked at this last week as well. Really tremendous move here out of these metal and mining companies. 21% rally in about 26 trading days.
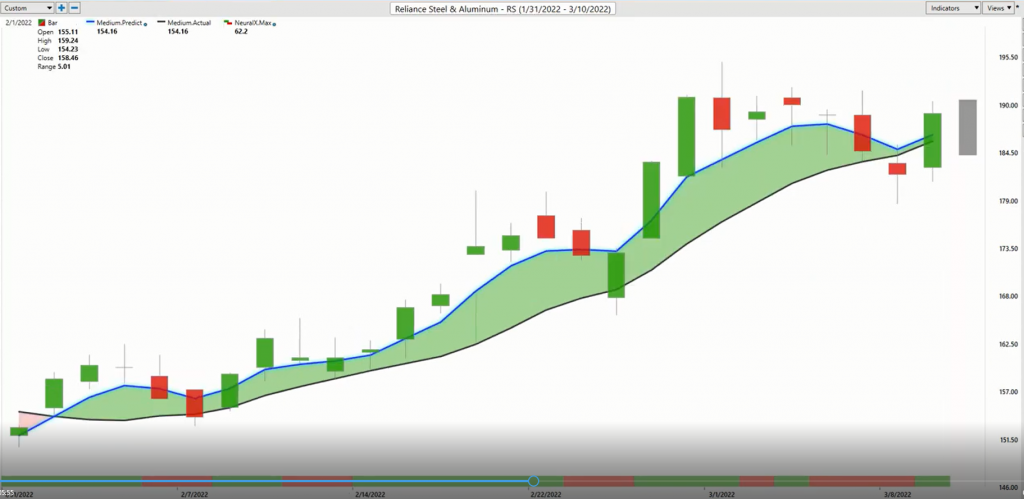
But more importantly, just seeing that well, look at these short term forecasts from things like the predicted neural index at the bottom of the chart? You just look at the last week, you see here that you have that neural index going bearish. How I like to think of that is well, expect prices to hang out down here. Well, neural index goes bearish the next day, well expect prices to probably move above that predicted moving average. And you see you’re getting this choppiness as far as short term price action, but it’s helping you be prepared for these lower lows that are coming through, but not to get distracted by, hey, that blue line is still above the black line, and you want to maintain that longer term position, but make those adjustments with the shorter term predicted highs and lows to help you along the way. So again, another 20% move here and here’s where things are different.
And so if you’re looking for areas to hedge the portfolio, maybe hedge some commodity trades, or you’ve taken the long side of things, well, there’s some weakness here and some of the retail and traditional sort of retail consumer stocks here, right?
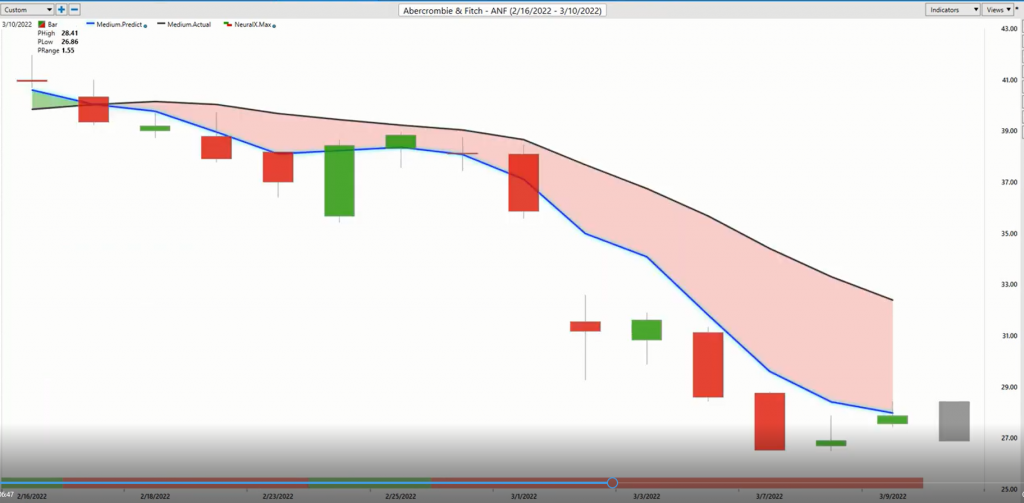
So here’s Abercrombie & Fitch. We see this blue line crossing below the black line. And again, the forecast here saying, “Look for some strength over the subsequent 48 hours of trading, but very clearly the trend is still to the downside.” So again, let’s look at those predicted highs and lows, and this is why this is important. It’s not a static forecast we’re looking at here, is every single day, this is updating that predicted high and low range. And so you’re seeing how accurate all of these levels are before the trading day actually occurs. When you have periods like this, just this tremendous amount of weakness as far as trend the neural index, getting those closes and sure enough, the bigger move is breaking out to the downside.
But it’s not hard to figure this out as far as where do you not want to be taking long positions in the market, right? Where can you hedge potentially those longs on energies and metal companies? Well, here’s a 30% drop in shares of Abercrombie & Fitch. So it’s a great time to be hedging that portfolio, taking longs and shorts, and really benefiting off of the volatility that we’re seeing in the marketplace.
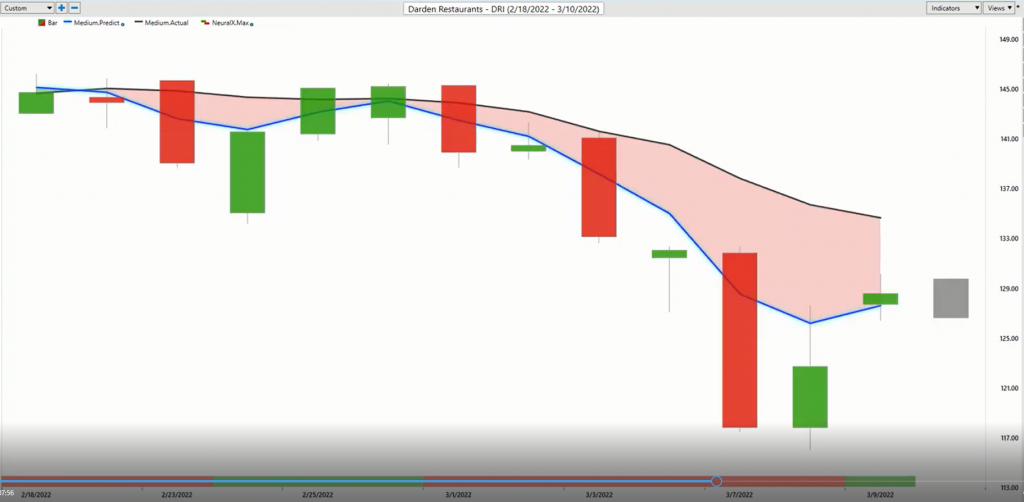
Here’s Darden Restaurants, you see this crossover to the downside here. We can, again, benefit off of those short term forecasts. So every single day you have these levels ahead of time to help guide you before the next trading day, right? So you see, even after this trading day here occurs, the software is telling you, expect the predicted range to move higher, right? Expect the short term, these prices to move up near these predicted highs, so you’re ready for that, and can actually reestablish positions at better prices often. So Darden Restaurants have gotten a nice decline here. That overall trend still downside about 11%, almost 12% rally to about a decline there.
Melco Resorts and Entertainment $MLCO
And here’s Melco Resorts.
So I mean, just very similar, you’ve got retail, restaurants, resorts. It’s the same thing everywhere you look that this is clearly not an area to take long positions, but an excellent area to potentially hedge that portfolio. So again, you’ve got that adaptive forecast. I bring things like this all the time where you see that you can only get one predicted high end predicted low level each day, right? And sometimes you’re going to get that volatility picking up, especially after you come off a reversal point. And you see here what happens is you have a predicted high here while the market just sort of lingers down here in trades and well, what happens? The next trading day is where it pops up to that level that you’ve, again, already identified. You’re prepared to short from that level on this previous trading day and continue on and say, “Look, everything is still to the downside.
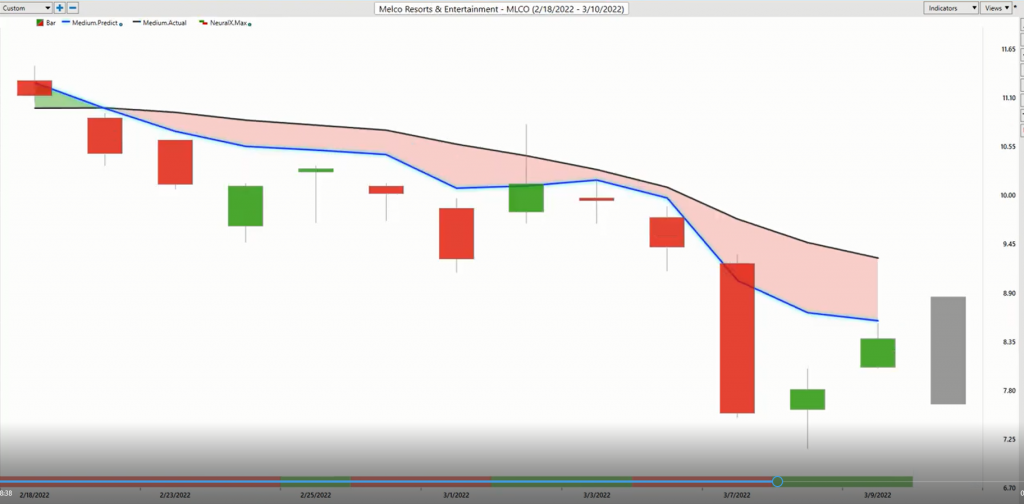
Looking embarrassed. The overall trend is still weak.” And you can really assess, “Okay, I see what’s going on here. We know what’s going on in the overall sector,” but not getting distracted by sometimes when you come back and reach that previous predicted higher level, here about a 25% decline. And lastly here, I just wanted to bring in Arcimoto. And the point here is really to highlight the difference in individual forecast. So the vantage point tool’s going to really help you identify those big trends that are breaking out metal, mining, commodities, what’s going on there. But then when we break it down to the individual trade, right?
Having to put the position on and manage that well, here’s Arcimoto. So this is a little penny stock as far as a electric vehicle company. And we had a lot of stocks turn higher over this time period. And as far as the trade management for the past couple of weeks, what we’ve seen, certainly there’s some weakness in the market. We’ve seen weakness in the index, but as far as these forecasts go, it’s saying, “Look, the overall trend is up.
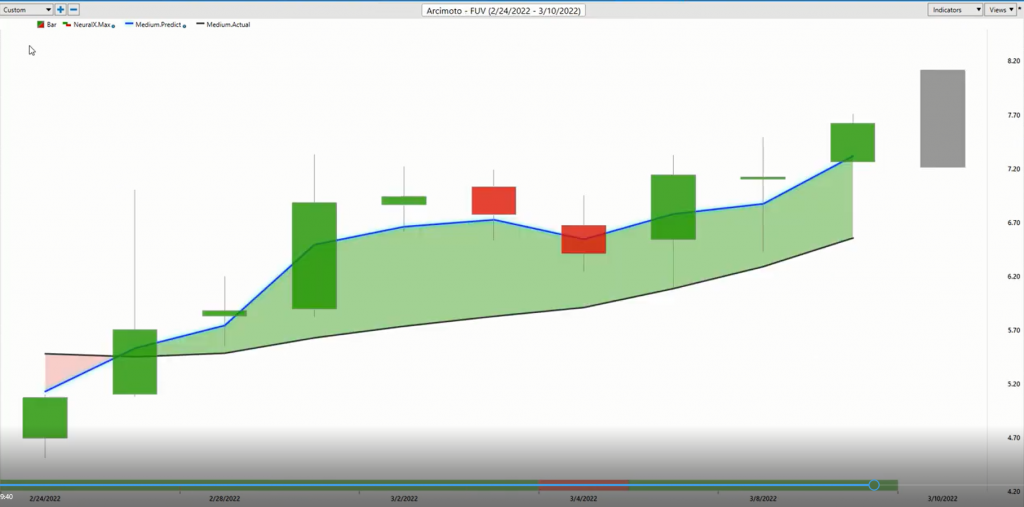
Look down towards these predicted levels here.” And when you have a stock, that’s cheap, buying here. You’ve got excellent time to take some profit on some of these moves as the market moves higher, but lock in those really nice entries early on in the trade. When you first recognize that, “Hey, there is a shift here,” you can get that really great entry and then manage it with the help of these subsequent forecasts. So again, we see things not necessarily breaking out, but certainly not moving lower here. And when you have a stock that cheap, you get a 31% rally just on a couple buck move higher. But this is what it’s all about is identifying these clear areas of strengths, where you want to coordinate that portfolio to get those longs on whether it’s options, buying the stock, whatever it needs to be, and then understanding where to maybe even hedge the portfolio, maybe even take shorts in combination with some of those longs, and really make money on both sides of the market.
But what it comes down to is that managing of each individual opportunity and responding to those predicted highs and lows, and really improving each position each trading day that you’re involved. So once again, we’ll go ahead and leave it there. This has been the Hot Stocks Outlook For March 11th, 2022. Thank you all for watching. Best of luck. Thanks again, and bye for now.