Register for a Free Live Training
The Hot Stocks Outlook uses VantagePoint’s market forecasts that are up to 87.4% accurate, demonstrating how traders can improve their timing and direction. In this week’s video, VantagePoint Software reviews forecasts for Allegheny Technologies ($ATI), Allison Transmission Holdings ($ALSN), CarMax ($KMX), L3Harris Technologies ($LHX), Nike($NKE), Texas Roadhouse ($TXRH)
Hello again, traders, and welcome back to the Hot Stocks Outlook for January 21st 2022. Hope y’all are having a great week out in the financial markets and like every week, a lot to cover in today’s outlook. So I thought it’d really be a good week to just very plainly look at the vantage point predictive indicators. Over the past couple weeks, we looked at energy, technology stocks, seeing some of these moves in these individual stocks, and now it’s a good time we can take a look at Allegheny Technologies as being a aluminum and steel stock. We’ve got Allison Transmission, CarMax, which we covered a couple weeks ago, L3Harris, Nike, and lastly, Texas Roadhouse. And it’s good to just look at everything quite plainly because we’ve had a lot of volatility in markets. Some shares doing very well, some sectors doing well, other things doing poorly, but the important thing is through those weeks and months where the markets are trending and moving around that you’re consistently making good trading decisions and updating your behavior based on what’s likely to occur in the markets.
So when we look at these forecasts here for shares of Allegheny Technology, what we have here is daily price action. So each one of those candles is representing a full and complete trading day and right up against all that daily price action, you see that there is a black line and also a blue line there. Now the black line that you’re seeing is what we refer to as the actual simple-moving average, and that’s what it is, it’s a simple moving average, very common technical indicator. In this case, what it does is it takes the last 10 closed prices, adds those altogether, and divides by 10. Now, that’s a very good tool to smooth out the existing price action and let us know where the market has been over a given period of time but traders need to be ahead of the move, and especially these past couple weeks, you’ve seen that markets start moving around and you really want to have those positions ahead of time so you know what to do next before things really start to accelerate.
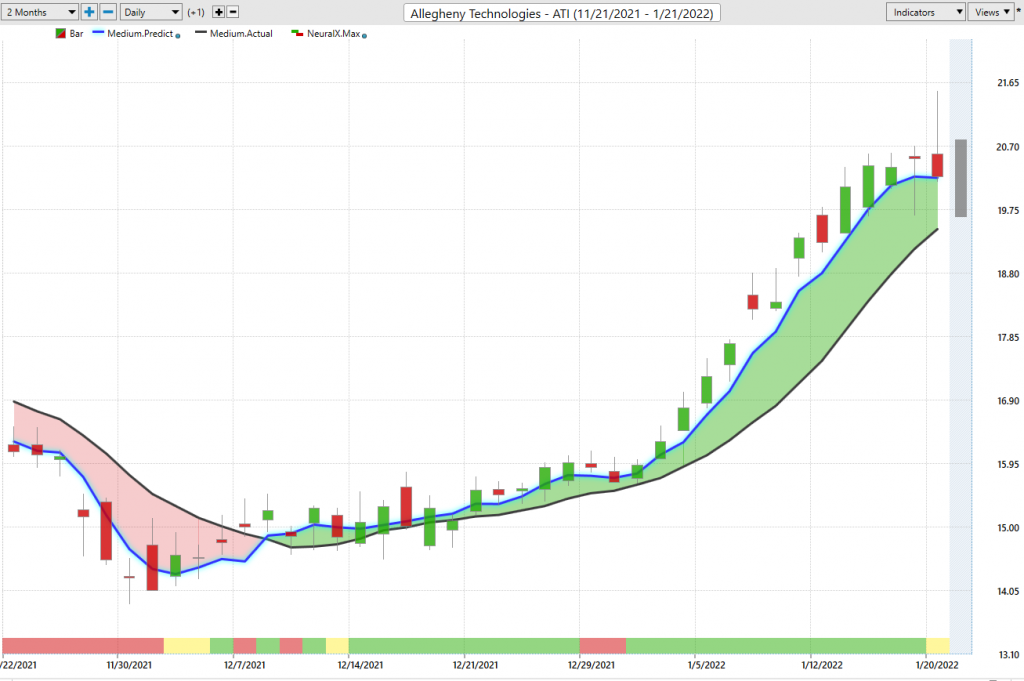
So here in shares of ATI, what we have is that blue line crossing above the black line, and it’s very important to understand the difference between these two values. So the black line, that is that simple moving average, very common lagging technical indicator, but for this predicted moving average, this blue line to be plotted against the chart, that’s where Vantage Point’s technology of artificial neural networks is coming into play. And it’s specifically doing what you would call intermarket analysis in that it’s utilizing that technology to understand the relationships between markets and use those clues to actually forecast future price.
So that means that when, specifically this stock, it’s going to look at things like ETF groups, probably steel, aluminum, mining ETFs. It’s going to look at individual stocks within the basic material sector, but it’s also going to look at the broader market, the NASDAQ, S&P 500. It’s going to look at global currencies, global interest rates, global commodities like gold, silver, copper, industrial and precious metals. And it’s deriving those clues from those intermarket relationships and actually using that information to generate highly accurate predictions of where things are headed going next. So rather than having a moving average that’s just going to get dragged around by what most recently occurred in the price data the day before, you have a forward-looking predictive tool that’s anticipating what’s going to occur next. And so whenever that average moves above the black line, or that lagging moving average, suggesting average price are going to start moving higher.
But that’s not the entirety of the Vantage Point forecast, right? If you look at the bottom of the chart, you’ll see you have this bar that goes from green to red. Again, this gets updated at the very right hand side of the chart. And if you look at the very top right hand side of the chart, you’ll see that there’s a shadow candle here, which is essentially a prediction for a predicted high and predicted low. So intraday levels for the next trading day that you have long before the trading day occurs, several hours before the market opens at 9:30 Eastern time.
So we can see here that shares have moved up about 36% over the past 29 trading days, and that’s all well and good, but you may need to be managing that opportunity. And this is where we can actually look and see how accurate those very short-term predictions of the daily predicted high and predicted low, as well as this indicator at the bottom, this green or red bar is a very short-term indicator. It’s only looking ahead two days at a time, or 48 hours. So when you see it getting red in this context, I would just look at it as, “Well, there’s likely to be some weakness over the next 48 hours, but what’s the bigger picture here, right? Where’s that blue line as far as its relationship and the overall trend?”
So we can, or I can here, I’ll hit F5 on my keyboard like we typically do each week and we can see how accurate each one of those daily predictions was against the actual trading day that occurred. So what’s going to happen is you’re going to get a real trading candle’s going to fill in right up against those bars, let us know how accurate that forecast was. And what you can see is that when you’re making these trading decisions in the market and say, “Okay, well, if this market’s moving higher, where do I want to look to accumulate a position? And also, where do I want to not have stock sitting because I should expect the market to trade at those levels?”
So you see a lot of these entries early on, also the predicted high is doing a good job of letting you know where to take short-term profits, but the overall trend is still very much to the upside, and if you want to be a part of that 20+ percent move that you’re seeing in the market, that’s all good, but there’s plenty of opportunities to take these chunks out of the market, accumulate potentially even larger positions because you keep taking money and putting profits in your pocket that can help finance sticking around and making sure that you’re around for when the trend really starts to accelerate.
So, we’ve been doing this week to week. I mean we’ll get to CarMax, which we looked at a couple of weeks ago, but here’s another example in Allison Transmission. Blue line over black line, again a lot of volatility over the past couple weeks in many markets, but here in Allison Transmission, very straightforward. Blue line well over the black line. You see the Neural Index does get bearish here, again warning of subsequent 48 hours of price action weakness, but even among those 48 hour windows, you have things like the intraday predictions of predicted highs and lows. And you see over this period where that weakness comes in, you’ve got a predicted low. Well, each day it’s waiting down here, but you see eventually hits that level. The next day, you actually move a little bit lower and you see the trading range lets you know that, lets you know, “Look, expect the lows to come down to this predicted low. The next day you should expect lows to move down to here.”
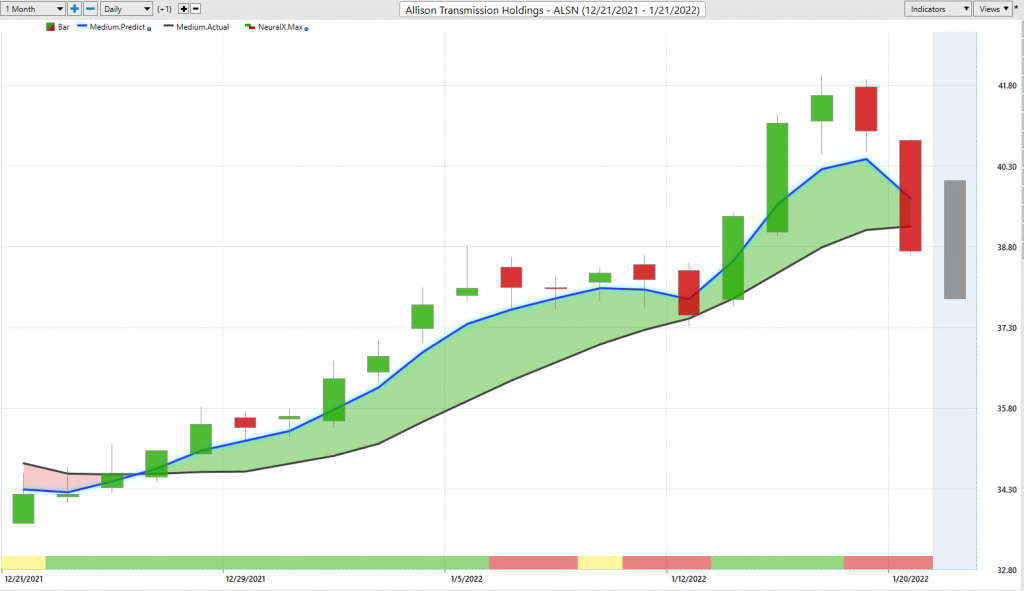
But you want to stay long as far as the overall trend, what sort of strategies you may want to construct as far as how you utilize these tools, but as far as trend goes in the short-term forecast, very straightforward here. The overall trend is up, here comes some weakness, use your Vantage Point predicted levels, but want to stay on the long side, right? In the direction of that bigger trend. So you see about an 18 and a half percent rally there just in the past 17 trading days. And again, we can get a good look at, okay, these predicted highs and lows over the course of that, well coming in doing their job really every single day. When things start to accelerate and break out, you’ll have that, but that’s fine when things are breaking out in the direction of really the expectation of trend, that’s not really a problem. You see, even as volatility comes in here, little bit of gap down and immediately trending and moving higher, range expanding here and letting you know, be prepared for things to trade down to these lows, down around the 40s.
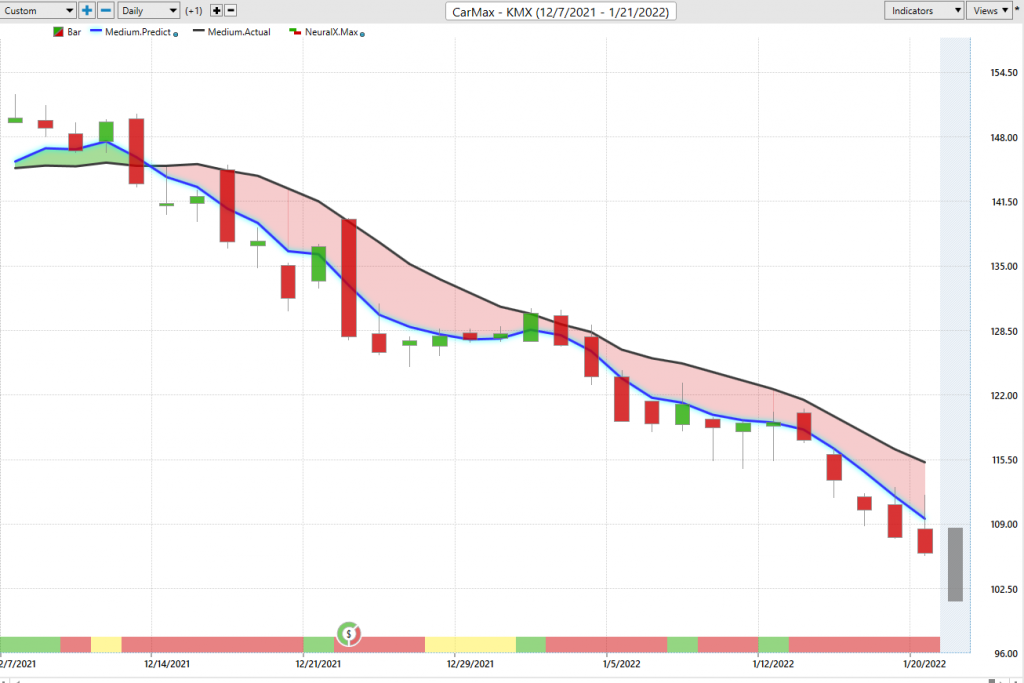
So, you get that consistently updated guidance to let you know, “Okay, well if things have shifted, if CarMax is going to reverse and go into a big up trend, well, these tools are going to update, right?” You’re going to have your neural index will likely get bullish, you’ll have your predicted range start to move higher, and eventually you’ll see that blue line cross above the black line if the market was expected to move higher. But here’s CarMax’s stock we looked at last week and again, one of these stocks that has been on the radar for weakness. So if you’re looking for areas to, where should I use my Vantage Point predicted levels? Well, if you’re looking ahead to the portfolio or look to trade shorts, well you can see more recently there’s a daily level hitting the predicted high, immediately going much lower, and still those trends looking very much to the bearish side, at least so far here.
So we can look at the overall move here, about a 26% decline there in shares of CarMax. That’s just over the past 23 trading days. So it’s very clear that, okay, energy stocks, yeah, let’s go ahead, get long energies, that’s fine. Maybe some aluminum stocks, Allison Transmission. Do you want to be buying CarMax? Do you want to be buying Carvana? There’s some areas in the market that clearly there’s some warning signs and say, “Wait till Vantage Point shows these things reversing and then that would make a lot more sense as far getting that bullish exposure.”
Here’s L3Harris, again another one of these examples of very strong crossover, blue line over black line, really going all the way back for the entire month here. All through January, this has been very strong. But I want to highlight things like this, right? So the neural index gets bearish here, subsequent weakness over the next 48 hours, when you’re prepared for that because you have the tools that really say, “Okay, well just get ahead of this,” understand that you may have that longer term game plan, but in the very short term, you can use that guidance from these predicted levels.
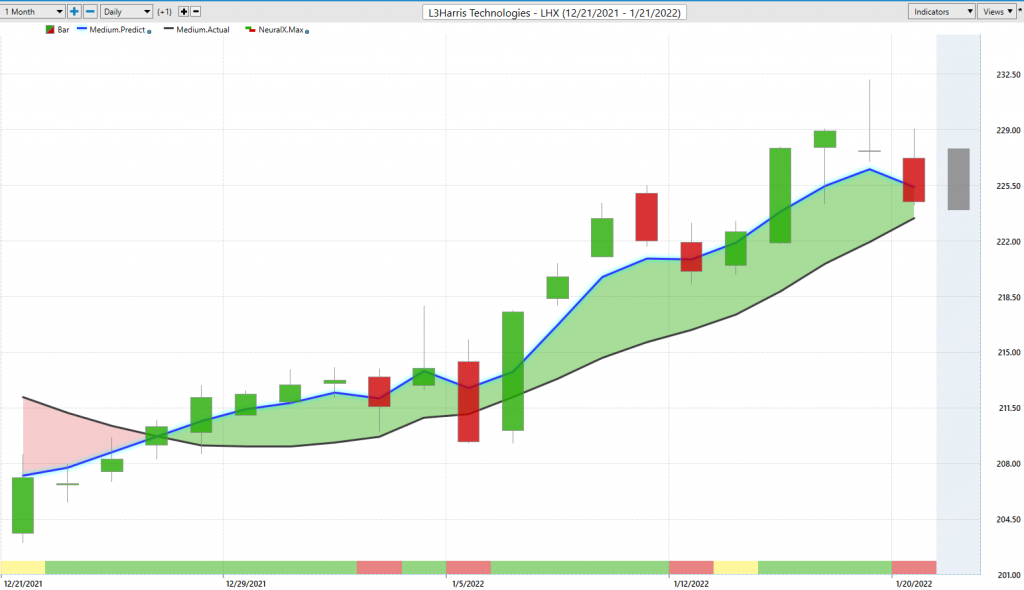
So I keep bringing things like this through where you see, here’s a predicted low here, all the price action moves higher and then the next trading day, you’re just getting some sort of volatility as far as, probably spread’s getting wide there and things moving around and some illiquid market conditions, but if you have an order waiting down at these predicted lows, especially expecting the market to trade down at these predicted lows and knowing you want to be long, you’re going to be in good shape to maintain that position and be on the right side of things as things eventually progress higher. So, not as large of a move here, but a 7%, 8% rallying just the past 16 trading days. But again just highlighting things like this, neural index goes bearish, well expect that volatility, but it doesn’t change the bigger picture of how you might want to use these tools for those longer term conditions and longer term expectations of trend.
Here’s Nike. So just going back and forth, there’s stuff going up, stuff going down, and generally the software doing a very good job at highlighting those areas. Here’s shares of Nike over the past couple of weeks here, since the beginning of January, about as week as a forecast gets. And you see getting this crossover so that your scan would bring that through if you’re setting it up for those conditions. And next day, looking new hit predicted highs and lows, right? Look towards these predicted highs for the market to move lower, and that’s exactly what you’ve gotten, the shares go from about 166 down to the low 140s here. So it’s just very clear here to figure out in this environment, where would you want to take long positions? Where would you want to short?
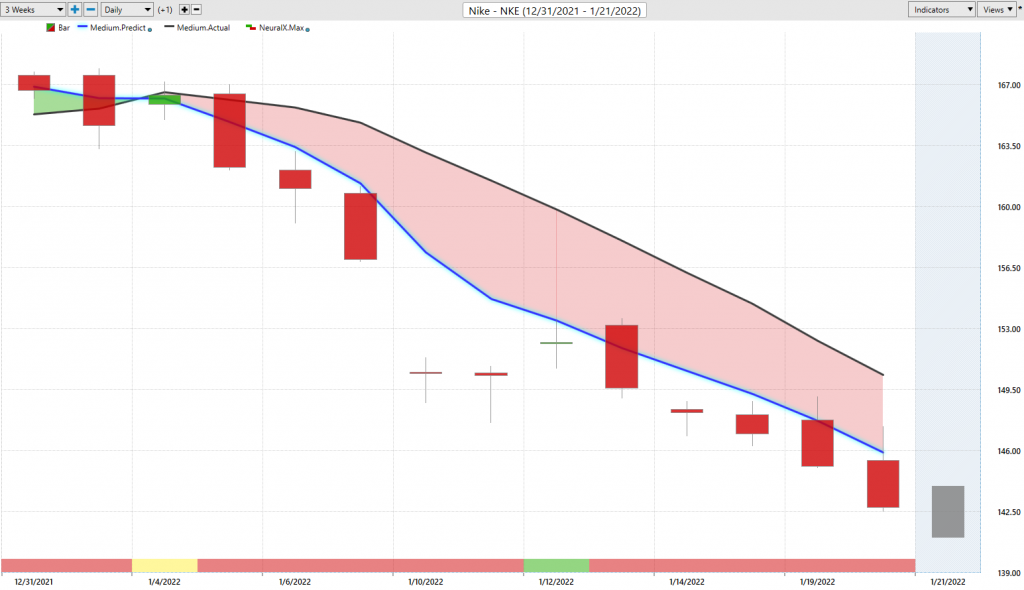
But more importantly, how are you really managing and potentially adjusting those positions day to day to get the best part of it, to really limit the risk but still open yourself up to areas where there’s some weakness, like Nike, CarMax here, but some other areas where there’s potentially strength, like even those energy names where we’ve certainly seen the commodity oil doing well and the energy stocks doing well and very much clearer roadmap of how to get some bullish exposure successfully here?
Here’s Texas Roadhouse, so there’s been some restaurant stocks moving higher [inaudible 00:11:17] since December was in a nice uptrend, but you start to see some issues in this sector now in January. So you see Texas Roadhouse cross over the downside here. Here you see this neural index getting bullish. You get a gap up and that’s expected, right? In stocks, you’re going to have things open up, the spreads be kind of wide in the morning and things gap around, but when you have a predictive neural network driven tool, you’ve got a pretty good tool that’s going to say, “Okay, well what levels should you really be anticipating here and still expecting that the bigger move is to the downside?” So yeah, neural index is bullish here. Yeah, you get a gap up there, but the direction is very clearly and strongly to the downside, from at least how all these tools would forecast things.
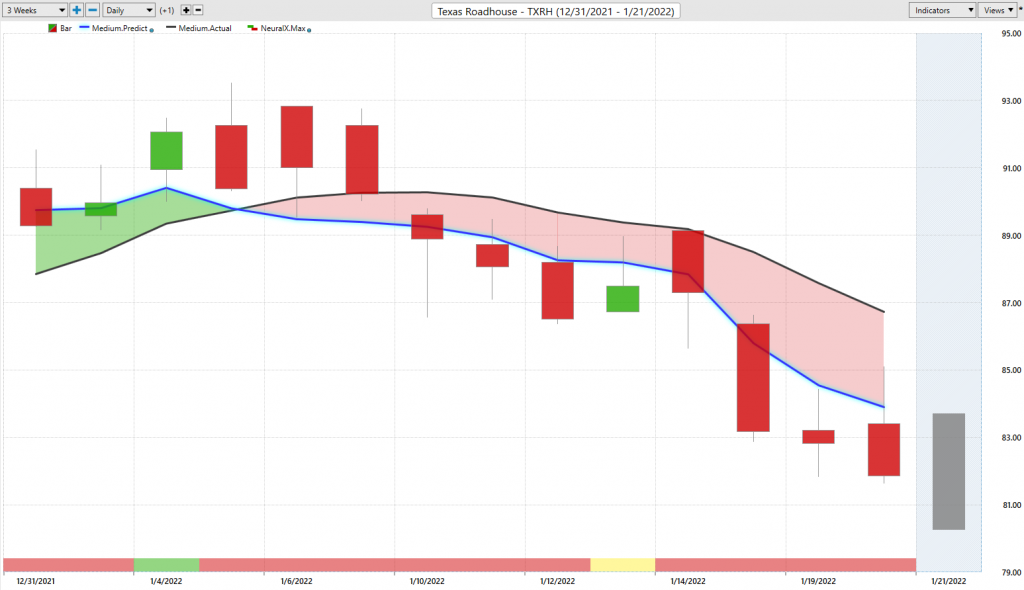
So again, not a huge move here, but in the case of a very short-term move as far as just the past couple days, gap up, moving lower, share’s off about 10% since those crossovers have come through in Texas Roadhouse. So again, as far as highlighting areas of the market where there’s some weakness, where you might want to avoid, but also where there’s some potential strength and it gets very easy to really identify this when you have the help of these scans pinpointing, “Hey, what is trending? Where are those trends strong? And where might you want to exploit many of those opportunities?” And you see where some of those forecasts have been the absolute strongest, you have the market continuing to trend higher and really some momentum picking up here.
So once again, we’ll go ahead and leave it there, but this has been our Hot Stocks Outlook for January 21st 2022. Thank you all for watching. Best of luck and bye for now.