The Hot Stocks Outlook uses VantagePoint’s market forecasts that are up to 87.4% accurate, demonstrating how traders can improve their timing and direction. In this week’s video, VantagePoint Software reviews forecasts for Baker Hughes ($BKR), Boston Scientific($BSX), Copart ($CPRT), Intel ($INTC), and Darden Restaurants ($DRI).
Register for a Free Live Training
Hello again traders, and welcome back to the hot stocks outlook for May 14th, 2021. Hope you are having an excellent week out there in the financial markets, and as always plenty to cover in today’s outlook.
So we’ll start out here with a great example here in Baker Hughes of really how all of these predictive indicators work, but we’ll move on, take a look at Boston scientific. We’ve got Copart Intel, which we looked at last week, and lastly, Darden restaurants here.
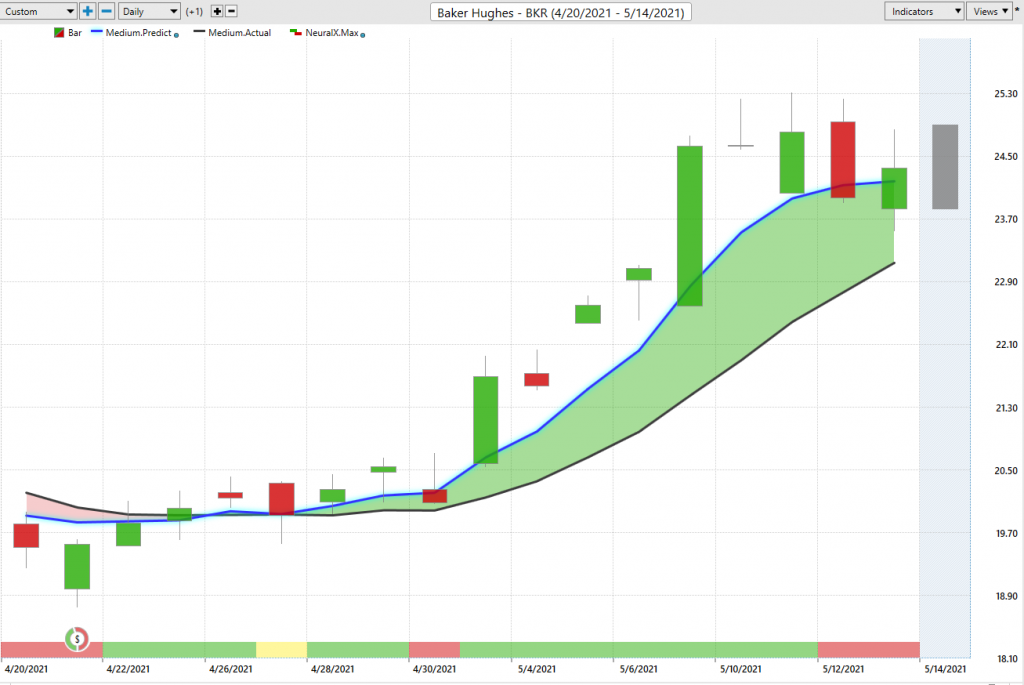
So let’s start out with shares of Baker Hughes and a really good example of really how all of the predictive indicators work in this example here for Baker Hughes. So what you’re going to see here is that each one of these charts and forecasts that are generated utilize end of day data, and each one of these candles represents a full and complete trading day. So all of this works off of end of day data, and you’ll see that rate up against that daily price action there is a black line there and also a blue line. Now, the black line that you’re seeing there that is actually a regular simple moving average. We refer to it as the actual simple moving average. And what that does is it acts as a good measure of where market prices have already been because it takes the past 10 close prices, adds them all together, divided by that, that number, and it’s going to smooth out the price action and let us know where things have been over a given period of time.
But obviously traders need to understand where things are going before they move, and be ahead of any sort of market move that’s going to happen. And so what we’re able to do is actually compare that black line, or what we can refer to is actually a lagging moving average, because it’s really just pulling price data from the past, and what we’re able to do is compare it to this blue value that’s generated via the technology found within Vantage Point. So to plot that value against this chart each and every trading day, Vantage Point is utilizing its technology of artificial intelligence, specifically artificial neural networks, to do what’s called intermarket analysis and generate predictions for future price. So what that means is specifically for the market you’re trading, in this case Baker Hughes, an oil services provider and pipeline company, well it’s going to look at the markets that it knows is driving future prices. Now, that can be things like the futures in commodity markets for oil. That can be oil service sector ETFs. That can be things like individual stocks. It’s going to be things like global currencies. Things like the RBOB refined contracts. Things like natural gas.
And so it’s able to look at these global market relationships, understanding how they’ve historically affected future price, and it uses that information, which it’s learning these relationships over time with that artificial intelligence, and it’s actually generating future price predictions. So actual predictions that haven’t yet occurred as far as where is this market likely to move. And it’s utilizing that data, that actual prediction, to build into the construction of these indicators, turning what was a lagging indicator. That’s just going to be pulled around by past price data, into a technology that’s actually creating a predictive forward looking tool. So whenever that blue line crosses above the black line, it’s suggesting average prices are going to start moving higher and you therefore would want to take long positions, naturally.
Now, at the very bottom of the chart though, you’ll see there’s another bar here that goes from green to red and it can flip back and forth. And this is also indicator derived to via that artificial intelligence and neural network process, but it’s tuned to only look ahead 48 hours at a time. So every new forecast is looking ahead 48 hours, or two candles, and you get that binary output of short-term strength or short-term weakness. And this is accurate up to about 86% accurate across all markets, sometimes even more so. And this is over really all markets, all conditions, getting a very high level of accuracy out of that indicator, utilizing that predictive data. Now to round this all out and round out the forecast, you actually have a prediction that’s provided before each and every trading day of the actual next day predicted range. So you can think of this as we’ve got the overall trend direction from vantage point, we’ve got a short-term strength or weakness from the predicted neural index, and we’ve also got intraday, predicted highs and predicted low levels, to help traders make better trading decisions in line with their trading style and process.
And so it gets very straightforward and simple for the vantage point trader who says, “Look, I know I want to be long in this market. Therefore, I want to use the vantage point tools to help me manage this position.” And as long as that blue line remains above the black line, we would expect the market to trend and the average prices to move higher. And so you’re going to see that you have all of these levels before the trading day occurs. So you can have limit orders waiting down at things like these predicted lows, in the case of wanting to get long, to participate in that uptrend. So this just being one example of one stock, we’ve actually seen a lot of volatility in stocks. This is a really good example of something recently that has gone into an uptrend. And then you get the benefit of those short-term forecasting tools to help you manage that opportunity, and you see about a 22 and was 23% move here in the last 12 trading days. But this is not indicative of the broader markets. And this is really the big thing that using a tool like Vantage Point and get ahead of that really big spat of market weakness that we just saw, and really make sure none of this catches you by surprise.
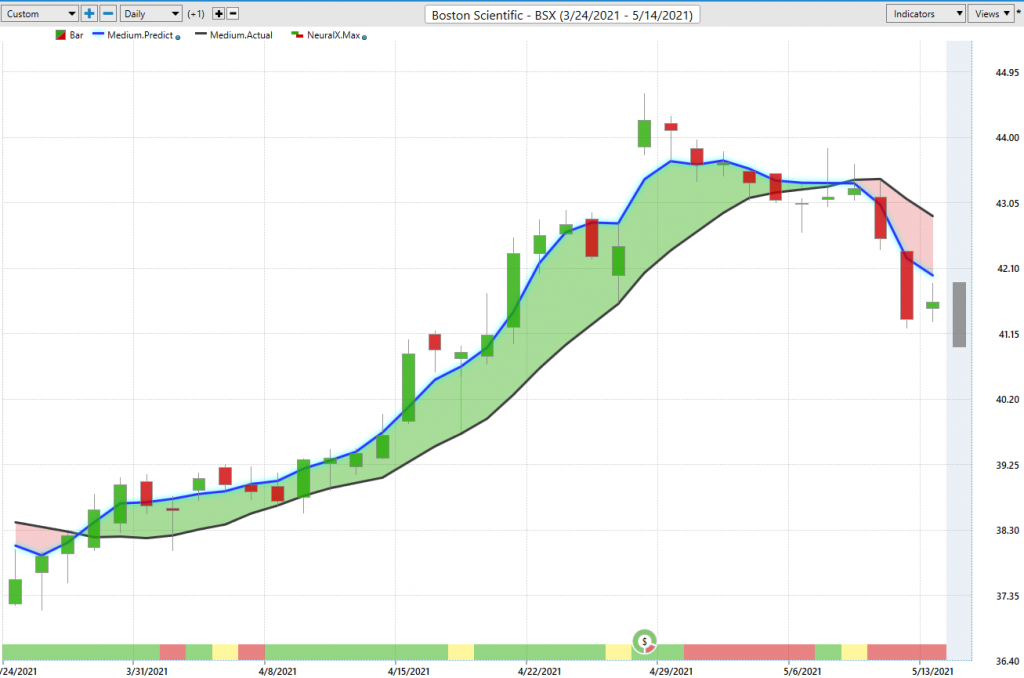
So here’s Boston Scientific, and you see very similar situation where very clearly here’s the bullish period in Boston scientific, all the way until we get this crossover here. It’s very clear that look, as a trader, regardless of timeframe, style, instrument you might be using, what do you want to be doing? You want to be looking towards the predicted lows intraday to be a buyer, and then match all this up with your timeframe. If you’re looking for a bigger longer-term move, you can trail your stops up with the market, but understanding that you’ve got really great entries here at the beginning of the move, you start to break out. You can always take some profits along the way, some more areas to add onto the market. And you see here we sort of run sideways, but you notice that the neural index is going bear.
So it’s telling you look for short-term weakness over the subsequent 48 hour periods, but eventually you get to the point where it just says, “Look, you have this crossover to the downside. The blue line has moved below the black line.” You actually as a short-term trader had a ton of this weakness coming in from the neural index. So it’s telling you, look at the very least if you still want to be long. Look for these cheaper prices, and then very clearly at this point saying, “Look, don’t get involved here. The trend is now down.” And we saw this all across the markets. This is not something that is terribly surprising as far as seeing this weakness really start to come through.
And this is where it’s been interesting to see things like Franco Nevada doing really well in a period like this. The gold mining stock’s doing really well. Some stocks doing extremely poorly over this recent period. And now we’re just seeing extreme volatility, where you’ve gotten the opportunity to get those positions on and really benefit from this volatility. But things certainly are moving around quite a bit. And it’s a great time to get those positions on, trail your stops, and participate as you see huge gaps on the charts now, these most recent examples, but here you see again, Copart. Crossover to the upside, really strong environment for the market over this time period, especially the S&P 500. We had a little bit more weakness from the smaller stocks in the Russell, but really strong uptrend here. We can look at those predicted highs and lows over that period. Very clearly giving you some great guidance that says, “Look, if you want to be a buyer here, where do you want to come in? Execute that trading strategy.” But you see you get those little dashes of weakness here, but some more persistent weakness coming in from your neural index.
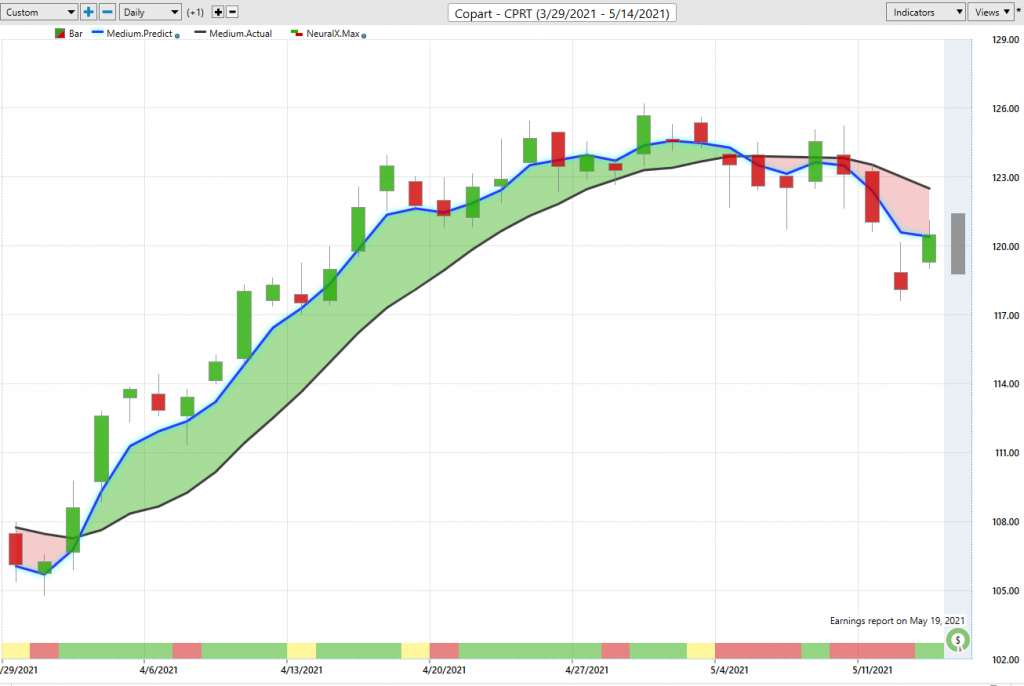
And then the big thing that you’re really waiting on is saying, “Look, if there’s been a trend shift, you know you do not want to be long in this market anymore.” And therefore, cover your positions, take your profit on these profitable moves from the previous couple of months. But very clearly you only want to short take profits on your longs from this point on. And you see that this is sending those signals really ahead of time that says, “Look, it’s last week where we have this big collapse in equity prices. You don’t want to get involved in that.” And you see on the downside, these things can get a little harder to trade. You get this big upswing in the market. And the software does a really good job of adapting with these predicted highs and lows. So you prepare for this market to swing up to these predicted highs, but very clearly you come in and you see how you’re way ahead of that potential weakness coming into the market. So you actually benefit because you’re getting those short positions on potentially early and really benefit as things accelerate. So as this range is now huge in some of these stocks, you have the ability to really decide, “Hey, do I want to stick around here for the longer term trend? I can use Vantage Point to help me with the guidance moving forward, or get out of the way.
Now here’s Intel, which we looked at last week. And this is a good example of seeing that weakness emerge in S&P 500 futures in the indexes, seeing these stocks that had done really well start to roll over, but we already know areas in the market that are weak. And so we already had Intel, which we looked at last week and said, “Here’s an area where there’s some definite weakness in the market, we’re in a downtrend.” And therefore, if you’re looking for areas to short, or maybe you have some longs in the portfolio and you want to hedge that portfolio, get some shorts counteract and seeing some of that weakness potentially on the longs come through. Well, perfect place right here in Intel, we can go back and obviously getting really great entries and get downs and early things start to accelerate. But this past week, as the markets have really started to deteriorated, where are those markets on your checklist where you already know that are susceptible to weakness?
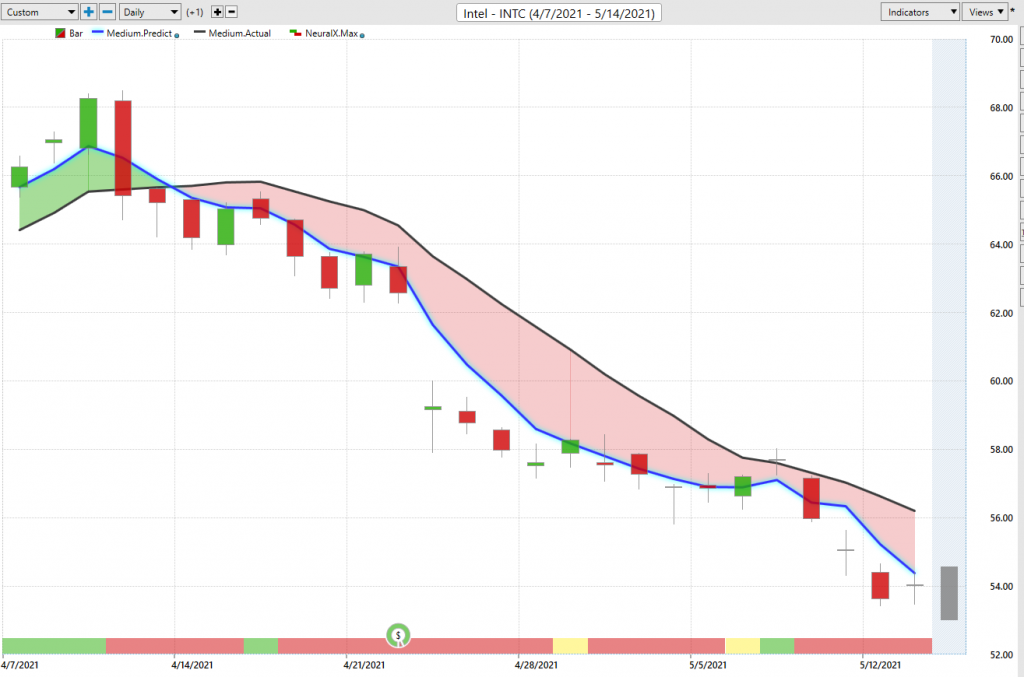
And this is something where, when you see that weakness coming through … Hey, even just last week, look at this. Here’s where we make the video on the weekly stocks outlook, here’s where you’re shorting, and here’s where you come in the next week and really benefiting from seeing that weakness. And now we’re just seeing a ton of volatility coming into a lot of markets. Dollar index, gold, equity prices. And so this is where if you are able to identify those positions early, great. You can trail stops and really benefit from a period like this. It’s really hard as a real short-term trader to jump in and try to participate when the ranges are getting so extreme and the volatility’s so high.
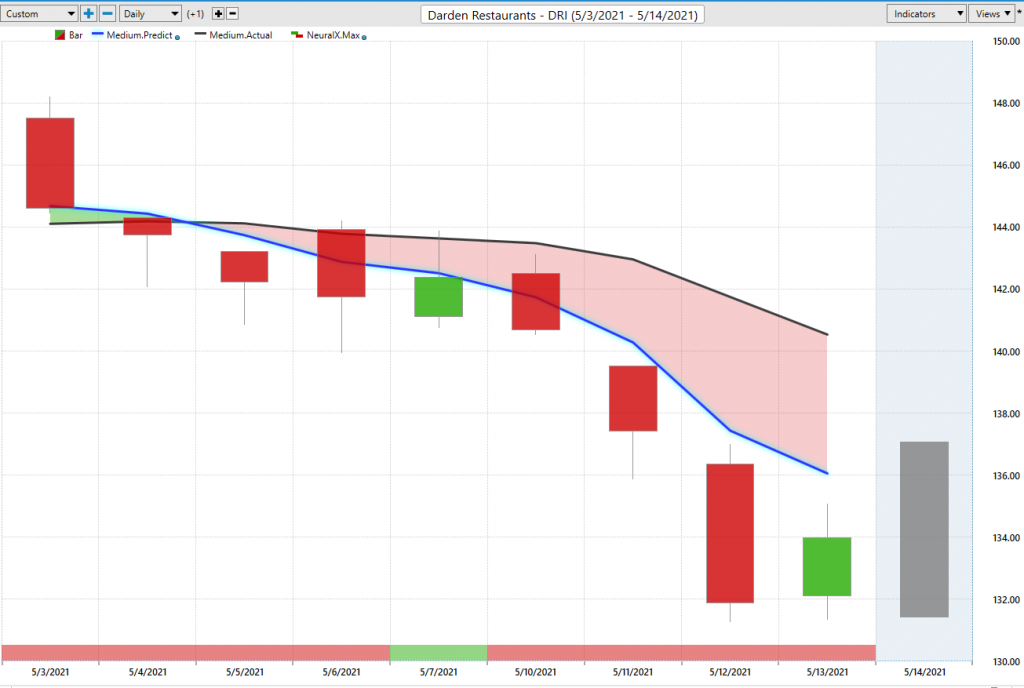
Here’s Darden restaurants here. Much more recent opportunity. Again, seeing this weakness start to come through. So as we run these scans with the help of the Inteliscan can feature in Vantage Point, we can actually see when these fresh crossovers are coming through and detect what sectors and areas of the market that they’re happening in. So we can really exploit specific weakness sector wide and find an individual stock to do that. But here’s more recent running that scan and seeing more recent crossovers to the downside in combination with some of the bullish stocks that had rolled over. But very clearly Darden being one of these areas where, let’s come in with the help of the Vantage Point forecast, and you see just how effective this is. A crossover way back here to saying, “Look towards these predicted highs in today.” You can’t do much better than that as far as trying to get short and getting the best intraday price possible. And then again, benefiting as the volatility comes into the market this week, but really the benefit this week really wanting to get some of those positions on last week. And that’s where this is really going to help you get ahead of some of these moves, and really benefit as we see things really start to heat up out there in equities, futures, commodities, ETFs, pretty much everywhere, seeing things start to move.
So once again, thank you all for watching. I hope you all have had a great trading week, and are really prepared again for these sort of moves coming in. Hopefully making a lot of money in an environment like this, and avoiding at least on the bullish side, some of these areas which have clearly shown that this is not the time, get defensive and that will eventually open up great opportunities to the upside as well. So this is always a good thing when things pull back. It just creates more opportunity in the future. So once again, this has been our hot stocks outlook for May 14th, 2021. Thank you for watching, best of luck out there. Thanks again, and bye for now.