


Register for a Free Live Training
The Hot Stocks Outlook uses VantagePoint’s market forecasts that are up to 87.4% accurate, demonstrating how traders can improve their timing and direction. In this week’s video, VantagePoint Software reviews forecasts for Garmin ($GRMN), TESLA ($TSLA), Lennar Homes ($LEN), Wallgreens Boots Alliance ($WBA), Enphase Energy ($ENPH), Quest Diagnostics ($DGX), U.S. Bancorp ($USB), and Walt Disney ($DIS)
Hello again, traders, and welcome back to the Hot Stocks Outlook for January 13th, 2023. Hope y’all are having a excellent week out there in the financial markets. As always, we have a ton to cover, and I have a lot of charts open up here that we can take a look at. So we’ll go ahead and get through this. We’ve got Garmin, we’ve got Tesla, Lennar, Walgreens, Enphase, Quest, US Bancorp, and Walt Disney. So I want to go through all this because it’s such an important time in the marketplace, and as we go through these charts, it’s definitely good to understand the nuances of these predictive indicators, but definitely go ahead and click on the link in the description below and get that live demonstration so you can learn more of the specifics of how these predictive tools can help you specifically with your trading decisions and that decision-making process.
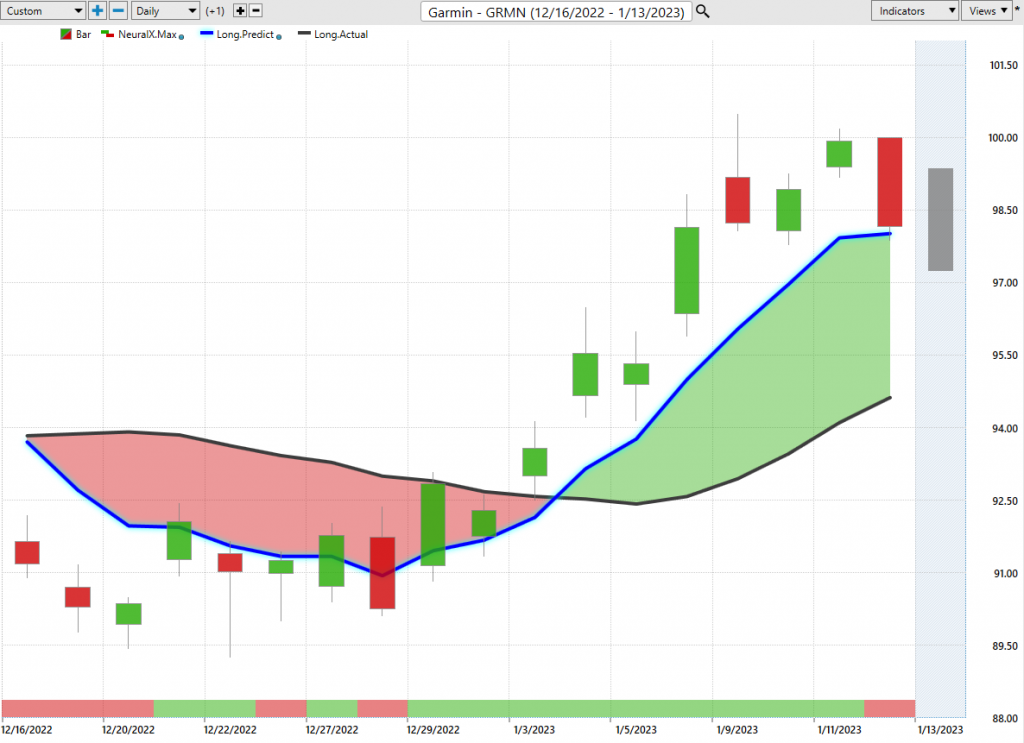
So what we have here to start out is shares of Garmin. And I actually want to highlight this because it does wrap up the broader marketed an interesting way. And you’re going to see a very similar pattern on many of these charts here. But here we have Garmin and what we have is daily price action. So that’s important to understand that each one of these candles is a full and complete trading day. And right up against that daily price action, what we always have is the black line there and a blue line. Now, the black line that you’re seeing there is a simple moving average. So that’s nothing special. It’s a very common technical indicator, and in this case, it’s a 10-day simple moving average. So it takes the last 10 close prices, it’ll add those all together and divide by that number. And so that smooths out the existing price action, but it’s really just reconfiguring past prices, and it really just lets us know where the market has already been over a given period of time.
But what VantagePoint traders have is this blue value, and for that number to get plotted and calculated for the trader every evening. This is where the technology of artificial neural networks are coming into play. It’s not just a moving average, it’s getting plotted against the chart based on past prices. It’s actually utilizing artificial neural networks to perform what’s called intermarket analysis. So artificial intelligence neural networks are good at taking in huge amounts of data. So what is that data set? Well, that’s where the intermarket analysis comes in. It’s looking at markets that are known to drive an influence the future price of the target marketing question. And so we look at this every week, and this will always be things like the big macro markets like the dollar index, or the S&P 500, or those broader indices, but it’s able to identify those very important subtle market relationships, whether they be in ETF groups or individual stocks, or currencies, or commodity markets like the wheat futures or gold, whatever’s relevant to that particular market.
And so it uses that process to actually generate predictive prices, right? Prices that have not yet occurred and it’s those price predictions generated via the technology that are used to construct these predictive indicators. So rather than having a rear word looking tool that just reconfigures past prices, now you have a forward looking predictive tool that’s going to help lead the market and help you recognize many of these very important shifts with the help of these predicted moving averages. So what we’ve had here with Garmin is we can see that blue line crossing above the black line and suggesting average prices you should expect to start moving higher.
And so we’ve seen in the past week, especially last Friday, we had a huge move and we rallied all the way through. So there’s some areas in the market where that can be exploited, right? There’s a very strong trend going in here, the blue line or the neural index at the bottom of the chart you see very bullish. So let’s go over that and explain how that works. Now, you see this bar at the very bottom of the chart. You see red here goes to green and it stayed green until very, very recently. And so this is another indicator doing that same process of using that inner market data to generate future predictive prices, but it’s tuned to solve a different problem for the trader where a predictive moving averages can help us identify important trend reversals in the market. The neural index can help us spot short-term strength or weakness in the marketplace.
And so you see as that neural index is in that green configuration, with the overall trend, you get that momentum picking up and that’s where you see that acceleration of that 7% before we got that red day in the neural index, you’re up probably about 9% or so on that move. But what you need to understand is we can use that to really throttle the position so you get that big rally, and then we can combine that with the other predictive tools that are, again, using that inner market data but tuned to solve a different problem. In this case, very short-term intermarket prices. And we do this every week. We look back at, “Okay, well, what are those predictions against the actual market data?” And we can see how accurate all of these predictions are.
So you have to imagine, okay, well, if you look at last week and say, “Okay, there’s strength in the market, where can I look to go ahead and exploit that bullishness in the market?” Well, Garmin’s one of these areas where you see we’re getting up and hitting that predicted high, but I brought this chart through to highlight… You had some really nice entries along the way, but this is what you should be concerned about is there’s some susceptibility here. And while we’ve seen this really nice shift in the market, things are quite mixed and I really want traders to just understand that. And this is where tools like the IntelliScan and things within VantagePoint can help you see just how strong the market is and the best places to exploit this.
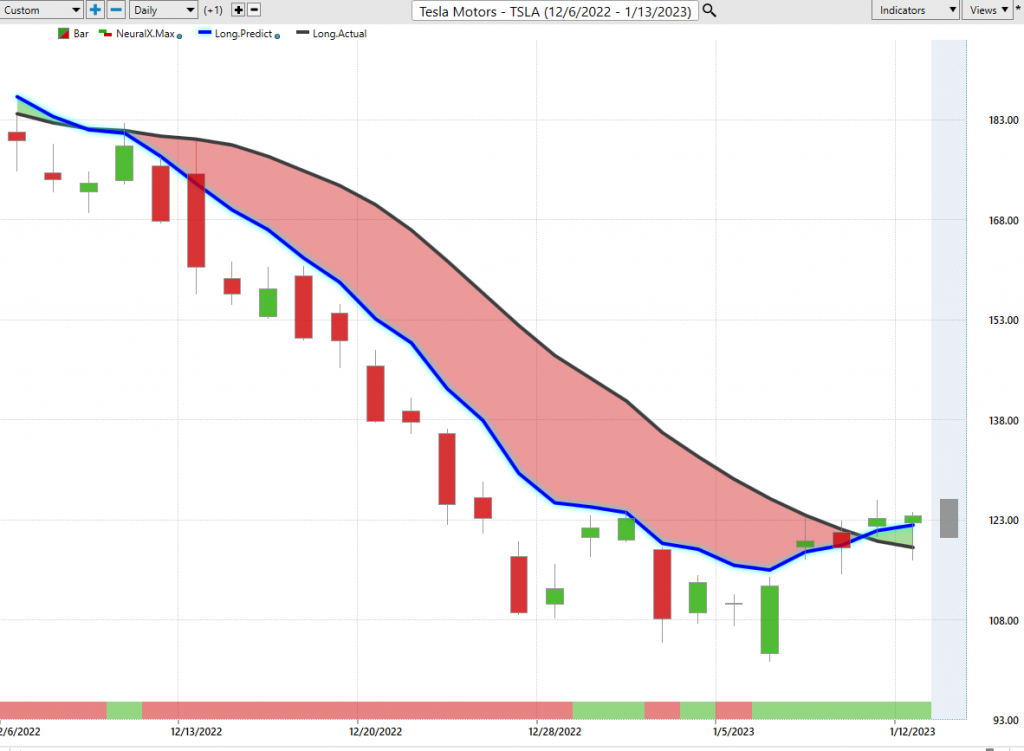
So Tesla, we keep coming back to week after week and highlighting that things are extremely bearish here, but more recently we see we get this crossover to the upside. If we look at those predicted highs and lows, you see, well, what stands out as far as this week as certainly a price level that you should either cover or if you want to get long look to go long from. Well, that’s what’s going to scream at you looking go ahead and look to cover if you’re still short. But when it gets to that argument of where to be long, I would look for stronger areas. So certainly you are getting some crossovers and if you get a good entry, you can trail your stops and try to keep participating, but there’s some better opportunities out there, and you can actually utilize the software to determine, “Okay, well, where is there a lot more strength to exploit that will certainly give you a lot more cushion if we start to see things start to turn?”
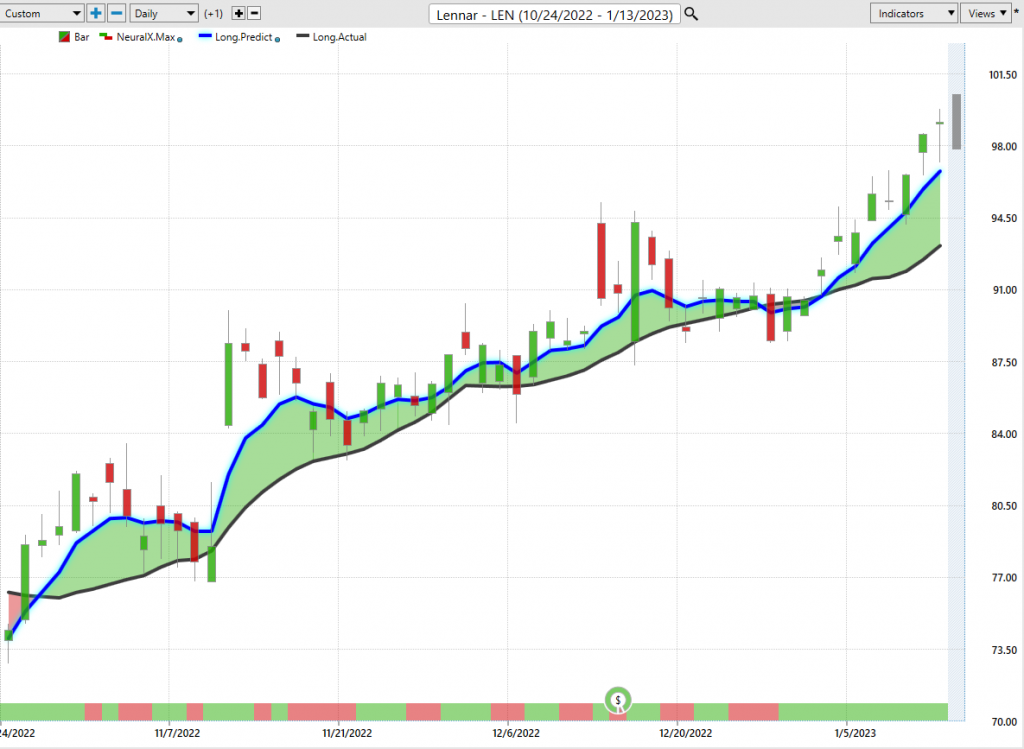
So here in Lennar you see that blue line crossing above the black line, and again, just this past week of trading here, if you have a order waiting at the predicted low, you get filled at the open, again here, filled at the open, and you see how the predicted highs on the top end work very good for short-term profit targets. You’ll also see in this case that neural index is still quite bullish, but the entries here are already… You’re getting about $8 per share from these entries just a couple of weeks ago. The point being that as you’re looking at those markets like Tesla, right? It’s still in a bearish trend over this period. So you don’t want to be getting along Tesla, you want to identify those areas that are either already in strong uptrend going into the week or get into these things as they begin would be ideal. So even if you are trading Tesla, you can get in early at very good prices and see how things progress moving forward.
Wallgreens Boots Alliance ($WBA)
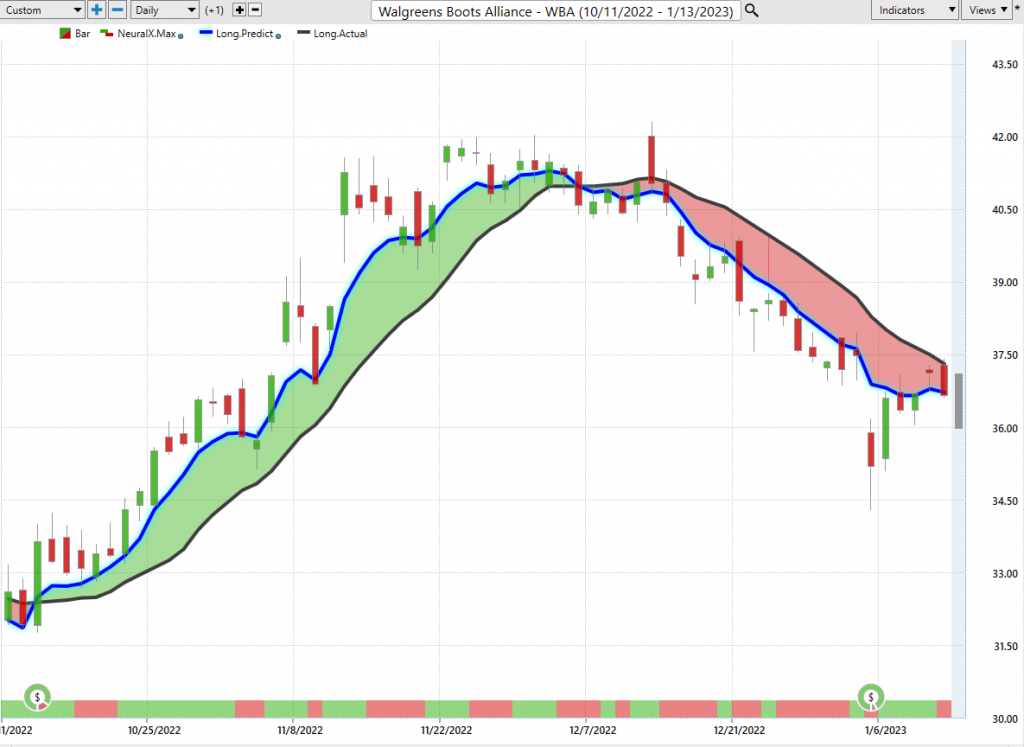
Here’s Walgreens, and again, I just want to highlight some of these areas where things are still very weak, and I’m bringing this through to highlight that some things didn’t reverse. So you got this little mini reversal, we got a huge rally around 4,000 in the S&P 500. Where here’s Walgreens, you see off about 11 and a half percent over the past 27 trading days. But this is an example of these areas where there’s a little bit of strength came in, but you’re not seeing crossovers here. And I would be very suspicious to some of these markets just are really still in downtrend. And so I just think that strength that we’ve seen is very particular to certain areas of the market, and certainly, like I said, it’s a good chance to get some long zen, be really defensive with your stops, but really have that hedged portfolio.
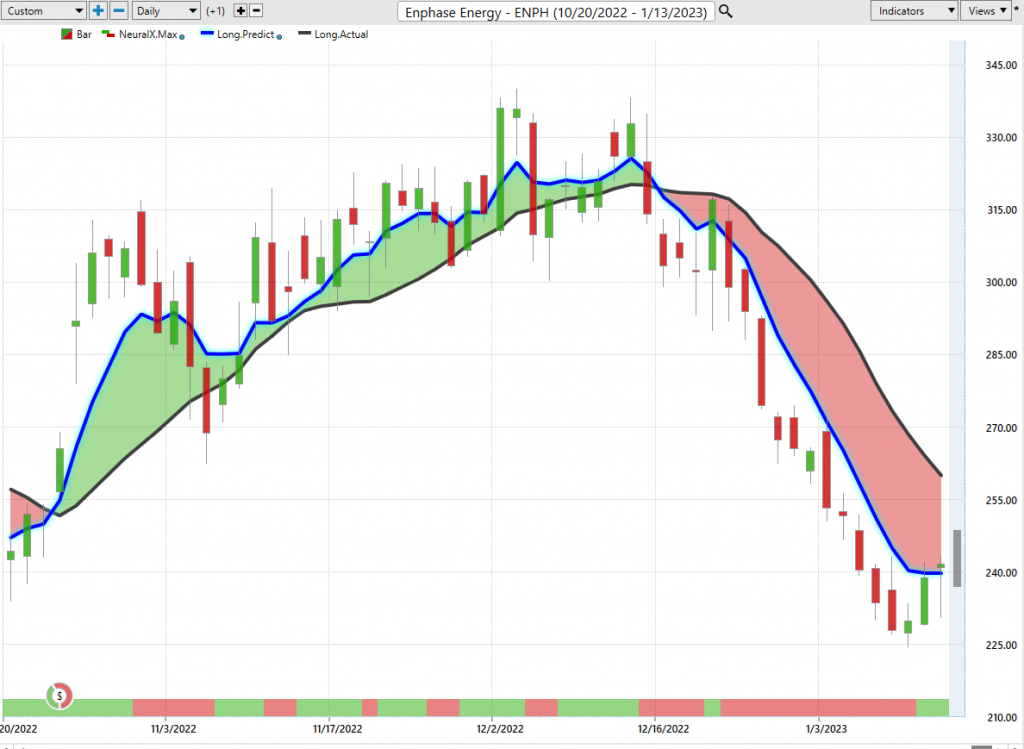
So here’s Enphase Energy, and again, you see some of these markets were not even close to getting any reversals here. So if you want to keep trading, well, it’s highlighting me that up towards these predicted highs would be better places to look and exploit that short opportunity in the market.
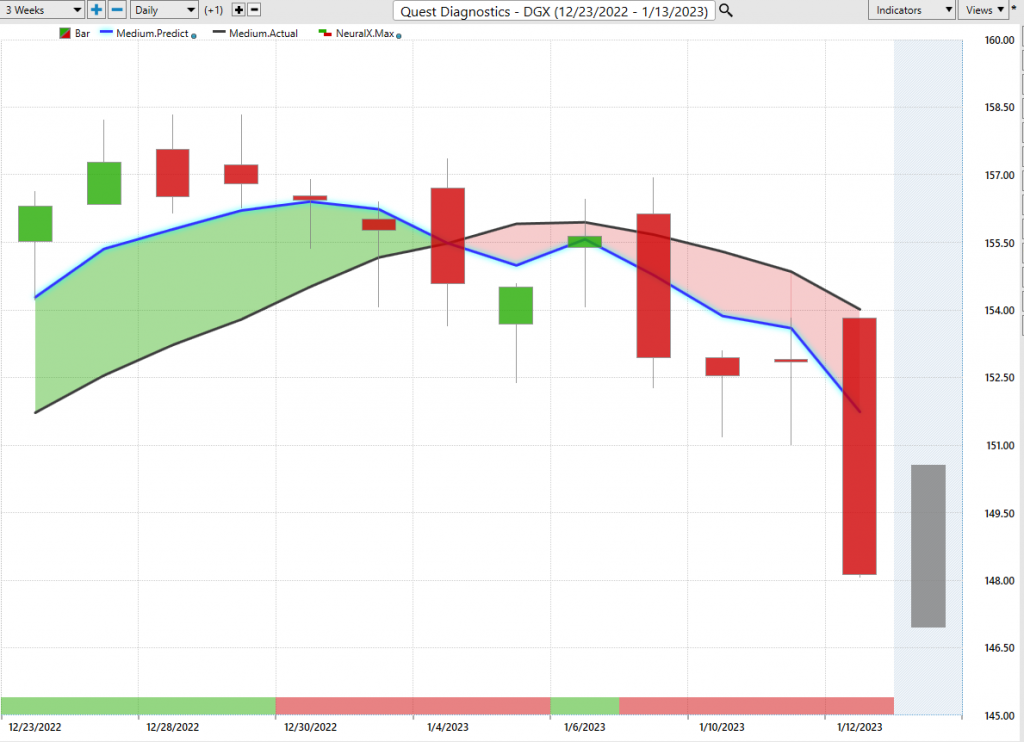
Here’s Quest, again, so this very much still in downtrend all week, and again highlighting where’s their weakness in the market over the past week and down to the specifics of predicted highs and lows. Well, where might you be looking if you’re trying to go ahead and set short positions.
And you see again, there is that weakness coming into areas. So you get these really aggressive snap reversals in the S&P and obviously we make these videos at a singular point in time, but this is where tools like the VantagePoint, IntelliScan are really helpful to see a lot all that strength coming in, see the areas in the market that are very strong that over a week like this where we could see all that strength coming in through the week, maybe it’s not a bad place to get those long positions. Maybe you can hedge some of those areas where you’re still staying short as you balance out that portfolio.
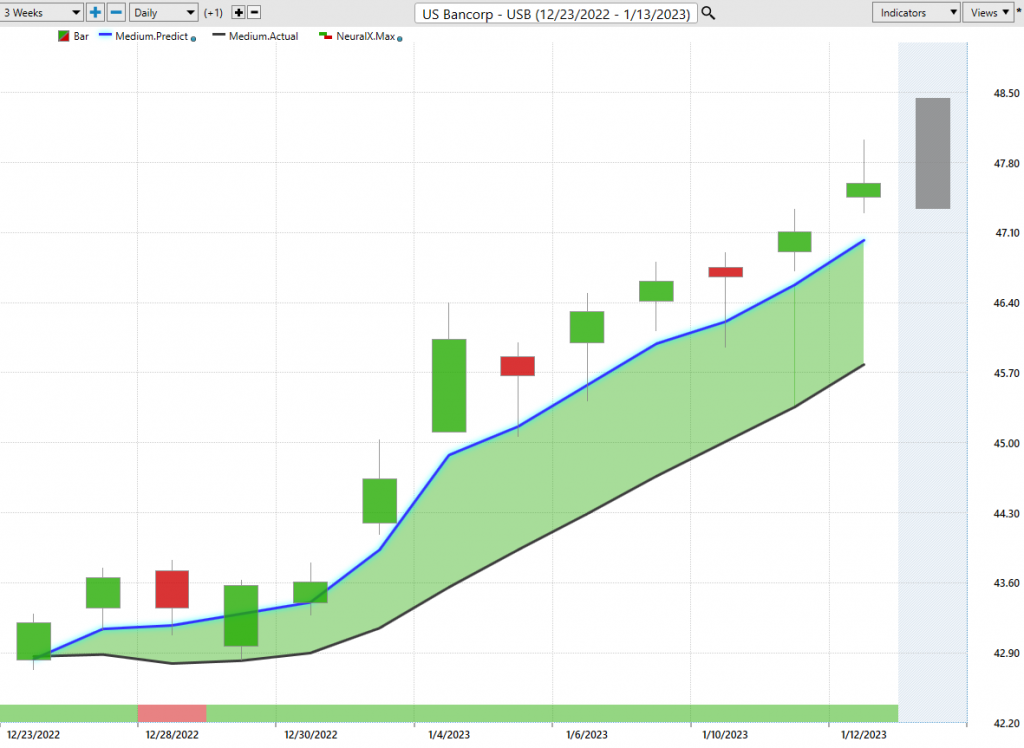
Here you see US Bancorp, I mean, there’s Tuesday afternoon really where it’s screaming at you. That’s the level if you want to go ahead and get long and look for really this profile, right? Things that are in healthy uptrend, and if we get that generalized strength in the S&P, well, it’ll help things out here.
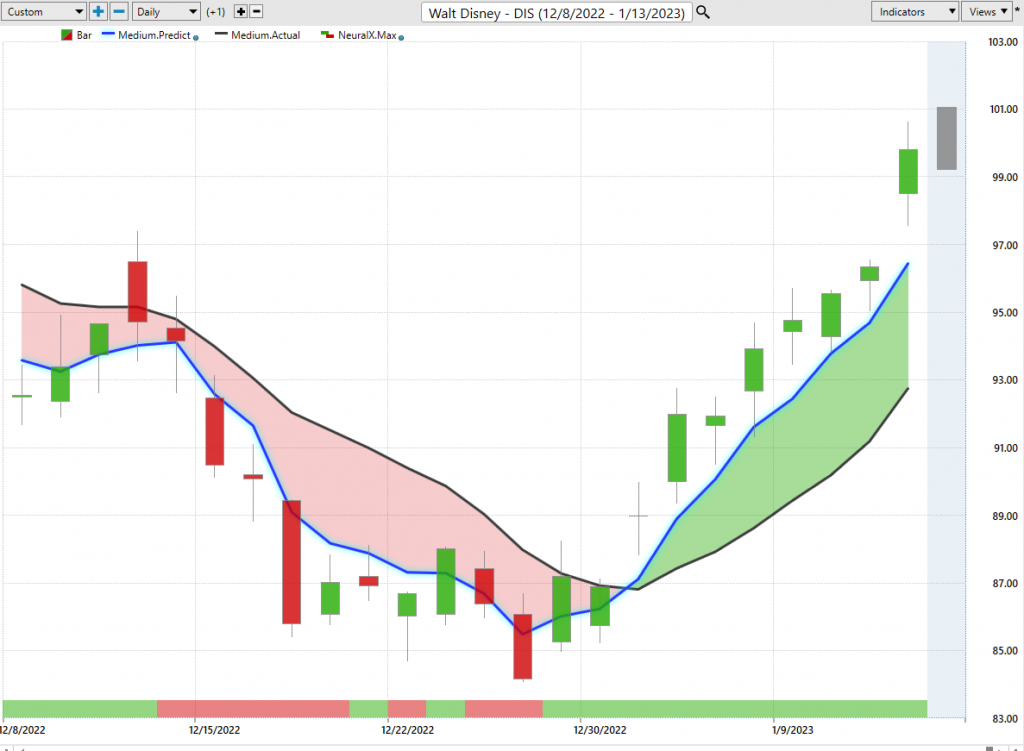
Lastly, Walt Disney, just taking a look at this reversal shift. So Disney was very, very weak. One of these markets were clearly you want to short take profits on shorts, but we had that reversal in conditions, and so that alerts you to, okay, well, we know that there was a reversal a couple of weeks ago in Disney also, Amazon saw a very similar sort of pivot in many of the shares there.
But really, the thing being is let’s think about this week and understanding that, okay, well, Disney, we know isn’t an uptrend, and where might we want to be looking to get that bullish exposure of down towards those predicted lows and getting a really nice entry on a bullish move. I just don’t want traders to lose sight of, yes, there’s been some bullishness here, and the software set an excellent job of highlighting where those things are the most bullish, but I would be very, very careful here as far as a lot of these markets that, yes, have rallied higher, but there’s again a lot of weakness out there. So when you get a big rally in the S&P, it’s liable to pull up a lot of those crossovers because that’s what it should be doing. The markets are very strong and we’re going to see higher prices towards the end of the week, but you want to really highlight where are the best places, where are the strongest opportunities, and then down to the specifics of how are you pinpointing where you’re actually accepting prices.
So if you want to get that bullish exposure, that’s great, but you want to get a really good price, not just come in and sort of get a market entry and not really do all that well and not make as much money as you can. And also risk losing money if these things start to turn around very quickly and abruptly. So I’ll go ahead and leave it there. I know it was a little nuanced episode in this case, so we’ve seen a lot of strength come in, but I think a lot of these starts, like Garmin is almost a great example of all this strength coming in, and some of these cracks in the foundation, at least in the short term, and certainly other places that are just never gotten uptrend and are still weak. So have a great rest of your week and weekend, everyone. Once again, this has been our Hot Stocks Outlook for January 13th, 2023. Thank you all for watching. Best of luck, and bye for now.

