Register for a Free Live Training
The Hot Stocks Outlook uses VantagePoint’s market forecasts that are up to 87.4% accurate, demonstrating how traders can improve their timing and direction. In this week’s video, VantagePoint Software reviews forecasts for SPDR SPY($SPY), Meta Platforms ($META), HESS ($HES), Exxon Mobil ($XOM), Tanger Factory Outlet Centers ($SKT), Northrop Grumman ($NOC), L3 Harris Technologies ($LHX)
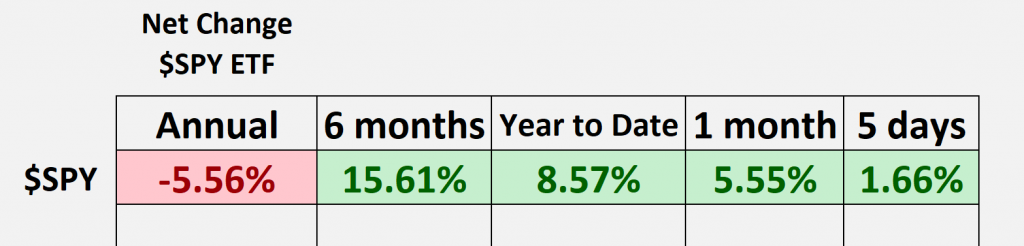
SPDR SPY ETF ($SPY)
Hello again traders and welcome back to the Hot Stocks Outlook for April 17th, 2023. Hope you’re all having a excellent week out there in the financial markets and as always plenty to cover in this week’s outlook. If you haven’t already, make sure you go ahead and click on the link in the description below and you can get a live demonstration and learn more of the specifics about how these tools can help you each day in the marketplace.
I wanted to go ahead and really quickly before we go ahead and look at that broad base performance of the S&P, each week what we do is we take a look at the vantage point predicted highs and lows. As we look at the SPYETF, we can see that last week, well, where was vantage point highlighting the market to move as far as the lower point of the market? Well, you see a lot of excellent entries as the market moves here Monday, Wednesday, Friday down towards those predicted low levels, and advances, we can see 1.66% on the week, but we’ve had some really nice rallies here. You see year to date we’re up about eight and a half percent, and going back a year on the calendar, we’re still down about five, but things have been recovering here. But we want to go ahead and make sure that we utilize these forecasts and really see those shifts in the marketplace, so let’s go ahead and take a look at some of these markets like Meta.
What we’re going to do is really highlight a different aspect of the software as we work through some of these charts. We’ll review some of these energy stocks we looked at over the past couple weeks really highlighting the effectiveness of the vantage point neural index, some of these warning signs in the market, and also some of these areas where we’re seeing things pick up as far as strength.
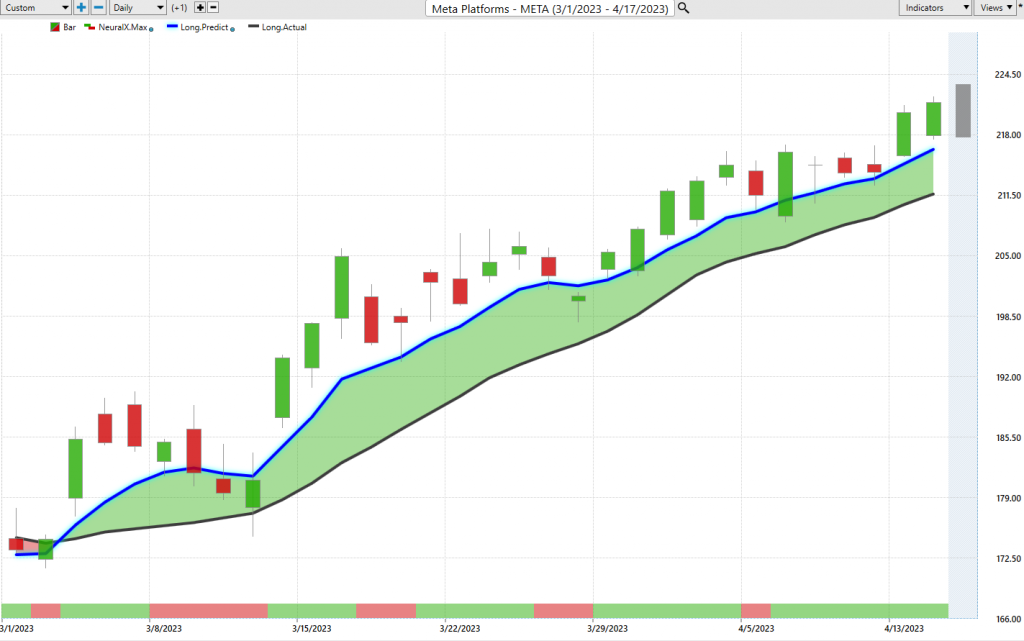
Taking a look here at Meta platforms, what we have here is daily price action. Each one of these candles that you see represents a full and complete trading day. It’s right up against that price data, what you’re going to notice on all these charts is a black line and a blue line value. What that black line value is, is a simple moving average. It’s a very common technical indicator. In this case, it’s a 10 period simple moving average, so it looks back at the last 10 closed prices, it adds them all together, and then divides by 10. What that does is it smooths out the existing price action for the trader and it lets you know where market prices have been over a given period of time. But traders want to be ahead of that next move in the marketplace, and so what we want to do is compare that black, what you might call a lagging moving average, we want to compare that to vantage points proprietary predicted moving average.
For this number, essentially this prediction of price to be calculated and plotted for the trader every evening, this is where the technology of artificial neural networks are performing what’s called intermarket analysis. Now, what that means is specifically for meta platforms here, they’re known to be really dozens of markets that are known to drive an influence the future price of this individual stock. Well, that can be things like the technology ETF group, that can be things like the S&P 500, but it goes all the way through the global financial system all the way down to gold prices, the dollar index, the value of different commodities. It’s able to take all of this into account in addition to even individual stocks that are known to share some very important market relationships, and it’s taking all of that information and it’s utilizing those artificial neural networks to generate extremely accurate price predictions.
What you have is, instead of traditional technical analysis that just looks at the past and rearranges past prices, now we have forward looking predictive tools, and we look at the combination of those tools, whether that be our predicted moving average letting us know where those big trend shifts come into the marketplace. What we see here in shares of meta, as that blue line, so that prediction of average prices remains above the black line value, we’ve had a 27, almost 28% rally in the last 32 trading days. But the beautiful thing about neural networks is that they can be used to solve different problems. And so that’s where these other vantage point indicators come into play.
At the very bottom of the screen, you’ll see this bar that goes from green to red, that is vantage point’s predicted neural index, and it’s tuned to solve a different problem that being short term strength over the next 48 hour window. Essentially two trading candles and subsequently updating each trading day. It has an extremely high level of accuracy associated with it.
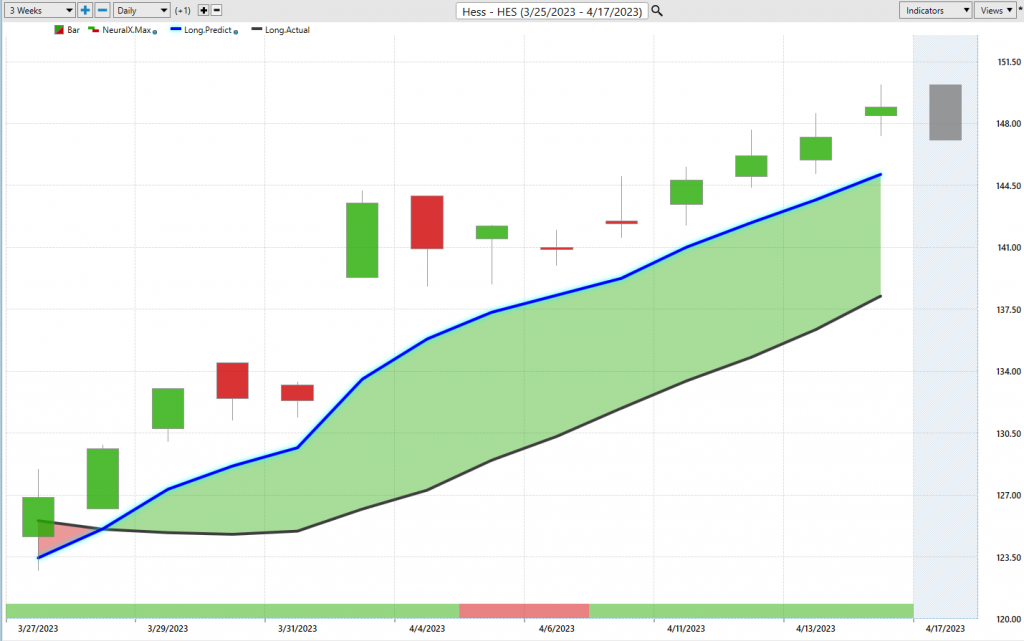
Last week, what we did is we looked at some of these energy shares, one of those places being shares of Hess. We saw this weakness coming in in the very short term, but we realized there’s a lot of strength in energies. You want to be taking profits on long positions, and you see as the neural index gets bullish once again, you get about a four percent rally in shares of Hess. As, again, the commodity energy crude oil starts moving higher, well, sure enough Hess is up about four percent in four trading days. Not a bad place for some short term trading.
But here’s an entirely different energy stock.
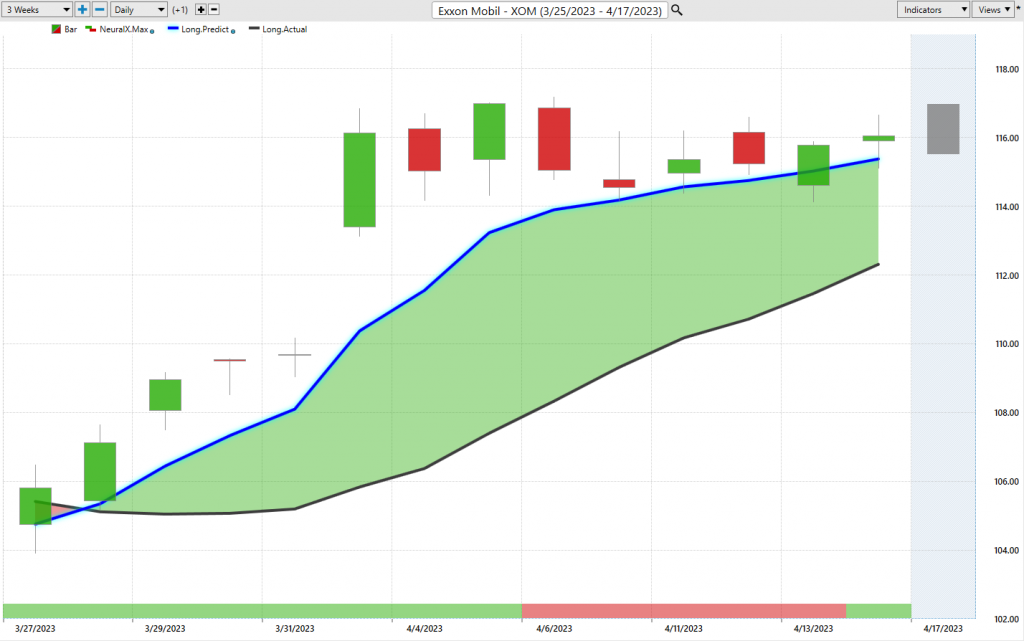
Here’s ExxonMobil. What is different about this forecast? Well, it was actually saying that average prices you should expect to remain sideways at the very least. You have that conflict between this short term weakness and longterm strength that we’re seeing in energy. But does that mean that you don’t want to get long? Well, not necessarily. It just means, well, why don’t you look for good prices to stake out those long positions? You see here throughout the week, down towards these vantage point predicted lows represent some really nice places to get long. And you even see on a day like this, you’re getting a little bit of a gap down. So the market’s gaping down towards these predicted levels, but then moving up towards the predicted high highlighting again a short term trade or really nice entry for a potentially longer term opportunity you might want to get involved in.
Tanger Factory Outlet Centers ($SKT)
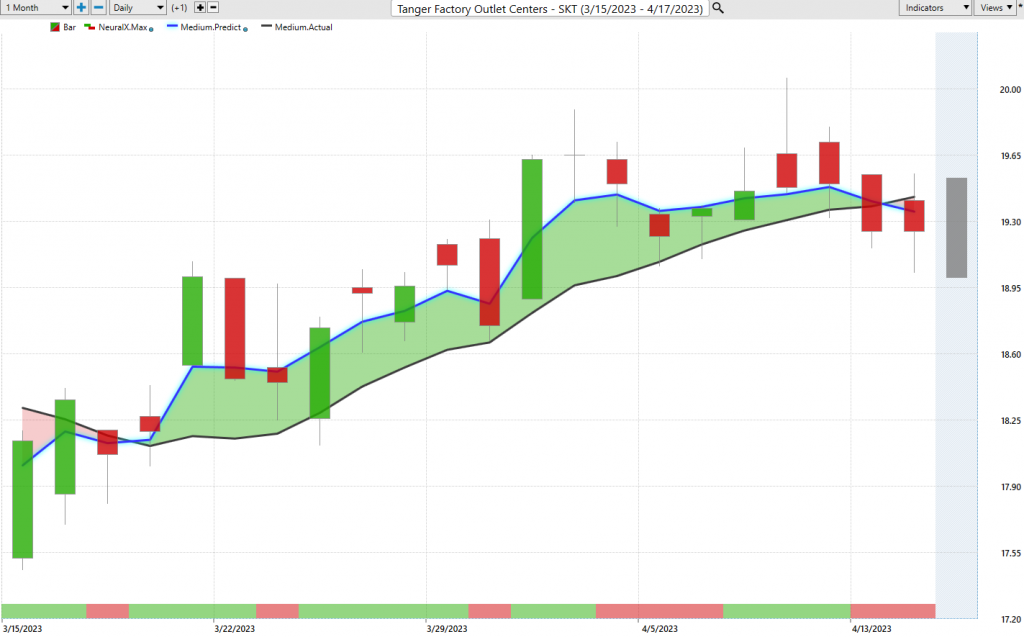
Now here’s Tanger Factory Outlets, and again, just highlighting the contradictions in the marketplace, right? Energy’s doing well. We’ve had certain shares of meta doing extremely well, but you want to update the forecast, right? That’s what the forecast is always doing, is updating based on those very short term, very highly accurate indicators skewing bullish or bearish. They do a great job here highlighting a lot of this strength coming into the marketplace. But I just want to highlight that there are some areas where we are seeing some weakness. You see that, as that blue line remains above the black line, we’re getting about a six and a half percent move over 19 trading days, right? A very small position here is going to make you a nice little chunk of money there, but things have shifted here, and this would not be a place where I want to go ahead and have bullish exposure in the portfolio, and if anything, potentially even reverse that position and add some bearish exposure into the portfolio.
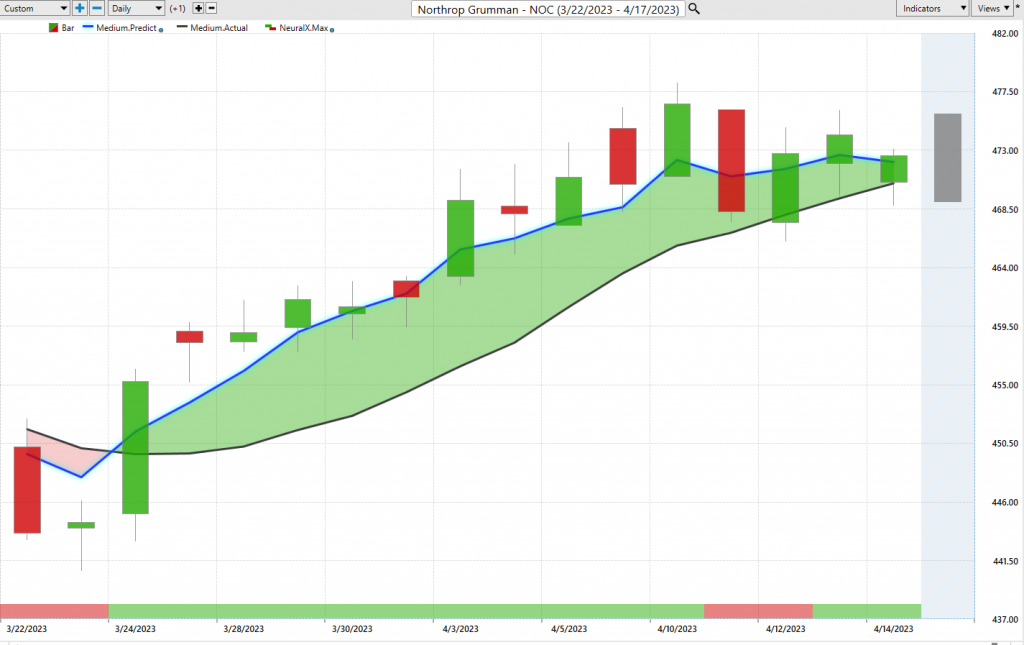
Now, lastly, we can take a look at, well, where has there been some recent strength via the vantage point forecast, whether that be fresh crossover skewing to the upside or that neural index remaining bullish? Well, that’s really been in a lot of the defense space. As we take a look at North Grumman here, we have a crossover between that blue line and the black line. Again, we can use these short term tools to say, “Okay, well if I want to get bullish exposure, where do I want to look?” Well, you see, over these four trading days, that’s one of the better price levels you’re going to be getting over that entire period. Then the market moves higher, we get another level here.
Now, here’s what’s really interesting is this is over a weekend here going into a Monday, and you see that on Monday all the price action goes to the bullish side, Tuesday, Wednesday you fill down to this predicted low. But do you want to be short this market? Well, no, you want to go long, take profits on longs, and again, you see the market skewing to that bullish side, and overall a very bullish forecast as that blue line remains above the black line and there being some strength here over about a 4% move over about 15 trading days.
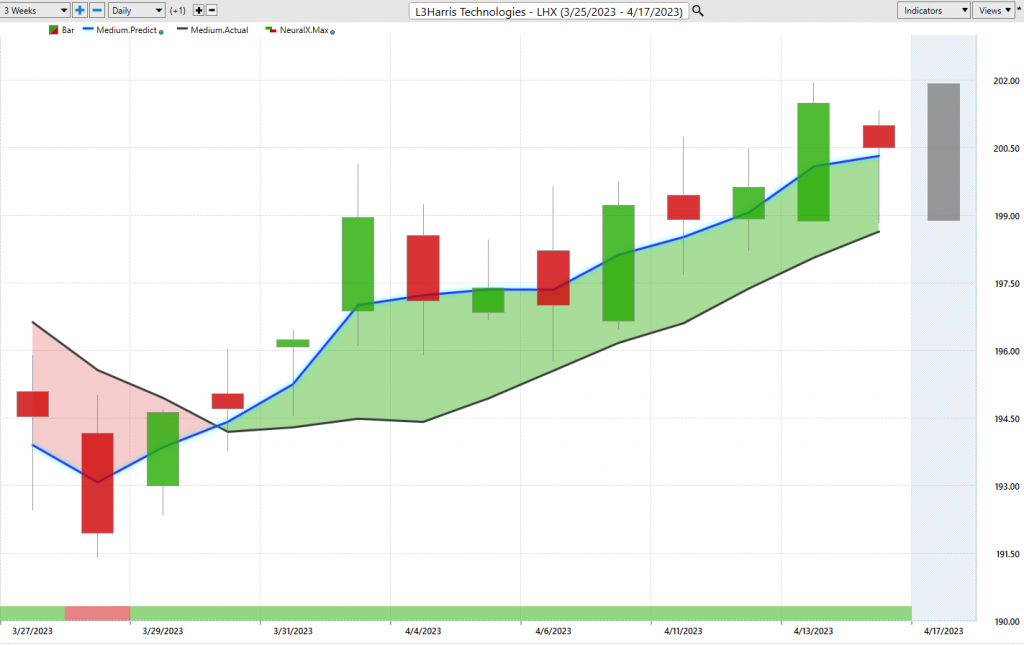
Lastly, L3 Harris, we see a lot of similar conditions. Blue line crossing above the black line, really some strength all the way through there, and you even see in these very short term predicted high and low forecasts, skewing there to the bullish side and highlighting some strength. Again, we can look at what we’ve had with these predicted levels coming through and a couple of nice levels moving to predicted highs.
What I really wanted to highlight here is, depending on how you trade, this can be a huge benefit to you. If you understand you want to be long, well, taking profit at these predicted highs offers a lot of nice discounts from those levels. If you want to take profit and reset positions, you’re getting a nice discount to make more than that three or four percent you’ve gotten over the past week and really maybe lock in longer term positions where you can run longer term stops or just keep taking those chunks out of the market and seeing what you can pull out of it.
We’ll go ahead and leave it there. Again, some interesting things to be aware of in the marketplace, but once again, this has been our hot stocks outlook for April 17th, 2023. Thank you all for watching. Best of luck out there and bye for now.