


Register for a Free Live Training
The Hot Stocks Outlook uses VantagePoint’s market forecasts that are up to 87.4% accurate, demonstrating how traders can improve their timing and direction. In this week’s video, VantagePoint Software reviews forecasts for McCormick and Co. ($MKC), Campbells Soup Company ($CPB), AMD ($AMD), IBM ($IBM), Albemarle ($ALB) and National Beverage ($FIZZ)
Hello again, traders, and welcome back to the Hot Stocks Outlook for December 17th, 2021. Hope you all are having a great week out there in the financial market. Seeing a lot of volatility, a lot of opportunities opening up. And so we’re going to start out with McCormick and Company. We’ve looked at that over the past couple weeks here. Staying in the consumer non-cyclical space, we’ll look at Campbell Soup, where we’re actually seeing a lot of strength there. We’ll look at some tech stocks. We’ve got AMD and IBM. We’ll look at Albemarle, which is actually a lithium battery company. And lastly, National Fizz, which is another one of these bearish stocks that we’ve looked at over the past couple weeks. And I really just want to highlight in this video again, how really picking your spots and really identifying where should you focus that attention as a trader, and Vantage Point really does an excellent job of letting you know where to bring in that attention and then help, of course, with that short term forecasting.
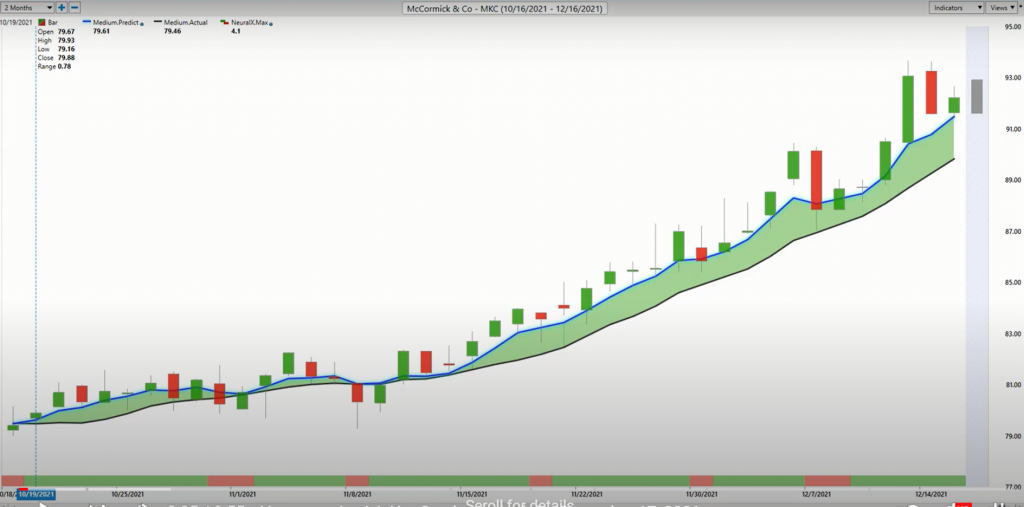
So what we have here with McCormick is daily price action, and right up against all of that daily price action going all the way back to October 19th here, we have a black line and a blue line there. Now the black line, that is a regular simple moving average. That’s a very common technical indicator. What it does is it looks back over the past 10 close prices, add them all together, divide by 10, and that’s a good indicator to smooth out the existing price data and let traders know where the market has been over a given period of time. But obviously a trader needs to be ahead of the move, especially, we see all this volatility coming in. We want to be ahead of that so we can capture that movement. And so what we’re able to do is compare that black value, or what you’d call the actual or lagging simple moving average, to this blue value, which is the proprietary predicted moving average found within Vantage Point.
And so for that value to get calculated and then plotted against your chart each and every night, Vantage Point is doing what’s called intermarket analysis, and it’s utilizing that technology of artificial neural networks to do that process. And so what that means is rather than just looking at past price data like normal technical indicators, what’s going to happen is when trying to figure out and make these future price predictions, the artificial intelligence is able to look at market relationships, and that can be things like the broader markets, like the S&P 500. It can be things like ETF groups. But it all also can be some very big macro important markets like the value of the dollar, interest rates, futures, and commodity markets like oil. I mean, we’ve especially seen oil stocks move around quite a bit recently. And so it’s able to take all of that information, understand those relationships, whether they be leading, lagging relationships, and offering huge advantage to traders with the help of these indicators.
So whenever that blue line crosses above the black line, well, it’s those neural networks picking up on those intermarket relationships dragging that average up and letting you know that the overall trend is likely to move higher in this case, right? Blue line over black line, you see that green space created, and let you know the overall trend is up.
Now that same technology can be tuned to figure out different sorts of problems. And so that’s what’s happening at the very bottom of your screen. This is called the predicted neural index, and it’s what you’d call a binary output, right? It can either be green or red, yes or no, right or wrong. And it’s able to determine short term trend direction with up to 86, 87% accuracy on average. You can think of it if you really wanted to round down as being right four out of five times.
But when we can get that picture of that short term forecast for a 48 hour picture within the overall trend direction of, should we be long, should we be short? And to really wrap this all up, those neural networks are also tuned to solve this other problem of intraday price levels. So you get an intraday high or low for the very next trading day.
And even last week, we went over a little bit about how it picks out these levels. Sometimes you’ll see a lot of volatility and you’ll hit some of those levels the next day, but you still want to, of course, stay long, stay in the direction of trend. And so when we look at McCormick here, I just want to update things for traders. So, past couple weeks, this has been a stock, very strong up trend. It’s in the consumer non-cyclical space where we can also know that there’s a lot of strength, and it just presents these opportunities where you’re buying the market, maybe taking profit up at the predicted highs, but understanding that all through this market volatility, FOMC statements, all this, this has been a very good stock to be positioned in really regardless. And it seems that it keeps wanting to trend higher. The forecast keep offering the guidance, and you’re up about 15% in just the past 41 trading days there.
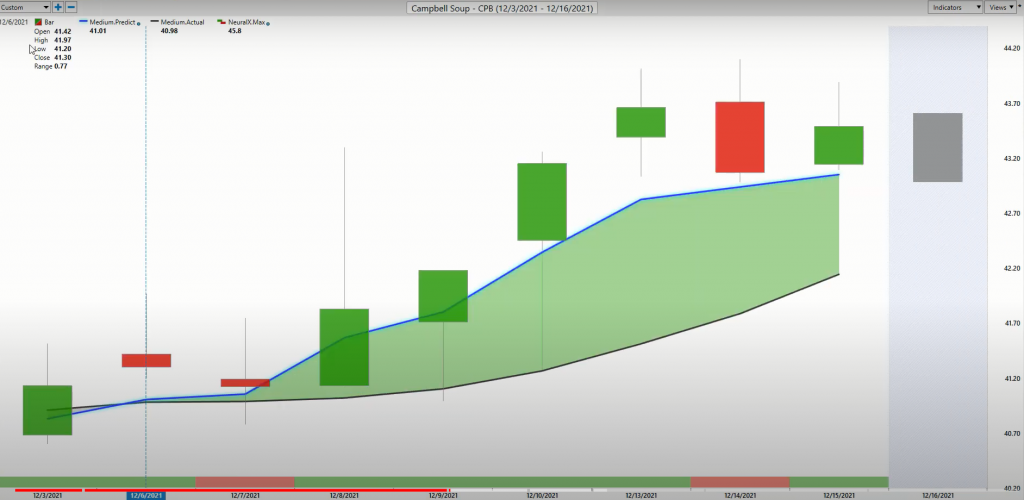
Now we can go over to Campbell Soup though, and moving into all this volatility, well, like I said, it sends you those warning signs that say, well, that’s a consumer non-cyclical stock. Maybe we should look for new opportunities in that area. And so you see Campbell Soup here. We’re getting that blue line crossing above the black line. You see, you get a couple days where you might get sometimes that short term price action, moving below that average, when that neural index goes bearish over the next 48 hours. But very clearly this has been not a bad stock to be buying at or near these predicted lows taking profit up at predicted highs. A lot of different ways a trader might choose to manage that situation. But the big thing, again, nice entries down at $41 a share, and a really great opportunity to have in the portfolio while we see all this volatility heating up.
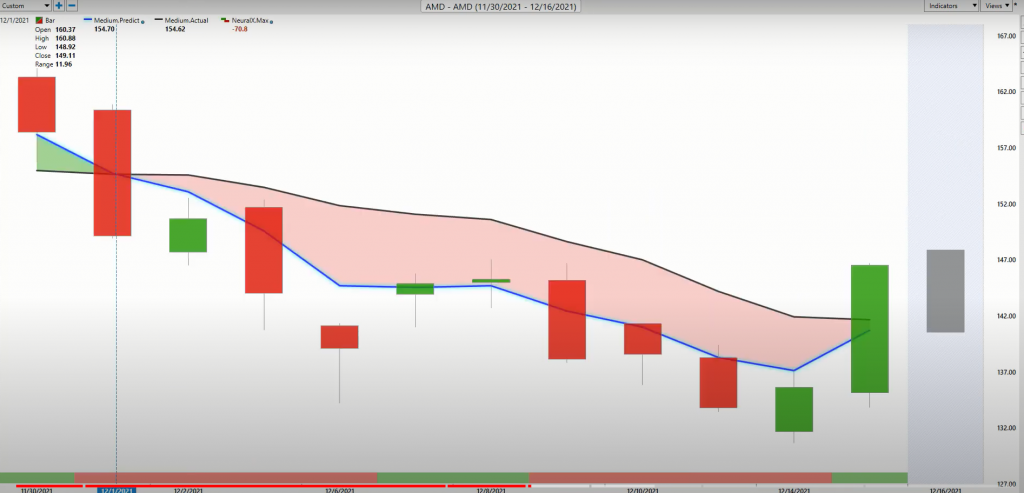
Now let’s move over to the tech space. Now here’s AMD, and we covered actually the move up in AMD, but I wanted to highlight this crossover to the downside because it was very clear that look, there’s some places we might want to be positioned in the market, right? We’ve been able to identify those, but AMD is just not one of them. And it really looks like we can struggle here. And so we’ve seen prices move from the 150s touching on the 130s here, and we haven’t gotten that crossover yet. You’ll have to see, of course, the guidance will help you with that, but very clearly some issues here in shares of AMD and a huge discount over this period, if you were looking to buy at cheaper price levels.
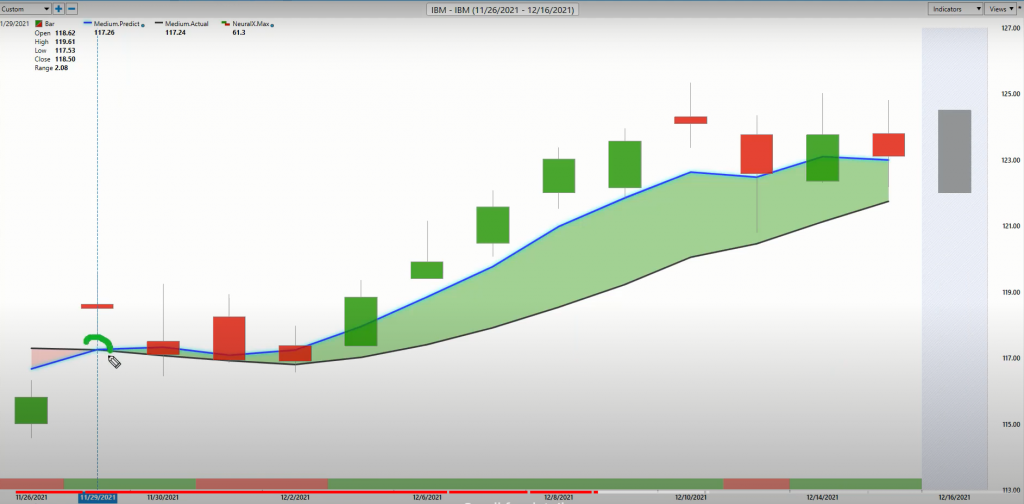
But let’s go look at IBM, right? Much different picture here. You’re getting this crossover, the blue line over the black line. The neural index gets a little bearish here. So you see again, that weakness moving below that average expectation of future prices. But the trend is very much up here. And even with that FOMC statement, yeah. We just really go sideways, rattle around the moving average and breaking higher, really to new highs here. And so again, to identify those areas, not AMD. IBM, okay. We got the guidance for that. And Vantage Point is again, updating. And that’s a huge part of this as well, is understanding that you may buy the market on 11/29 or 11/30, the next trading day, but it really comes down to the trade management. Are you able to add to your position at the right level, get a great entry price, maybe do some trade management around moving into that Fed announcement with the help of those predicted highs and lows.
But understanding that look, blue line is over the black line, stay long. Nothing should really adjust, nothing coming off the forecast here, right? You have areas in the market where you can be long and short, even through periods of volatility and fundamental news hitting the market. Now here’s a battery lithium stock here. We’re seeing a crossover to the downside. So again, to that point of AMD, these, whether it’s spread out throughout the battery stocks, but not the great time to be buying these things. And we’ve seen again, from the guidance here every day, you’re getting these levels ahead of time. So I keep pointing out these because sometimes you might look at some of these levels and go, well, wait a minute, you had a predicted high all the way up here.
And I just see this all the time to where all the price action is bearish, so it completely comes out of the area, but it’s just the next trading day where you’re going to want to move towards that predicted high, fill that range, and if you have a strategy that’s going to deal with that volatility, well, great. You’ll get filled and realize, okay, well, let’s keep managing this thing. Keep shorting up at predicted highs. You see again here, how you’re going to get these sharp movements up on the short side of the market. But look at this guidance. You get that at big move higher there. It’s telling you expect the range to move higher, but you’re not getting long here. You know that you’re looking towards those areas to actually remain short, and not a bad position to have with the FOMC statement with all of this volatility moving around. And if things, again, get very bullish in the stock market and shift, not only do you have those potential long positions, but maybe there’ll be opportunity to add to, to certain things.
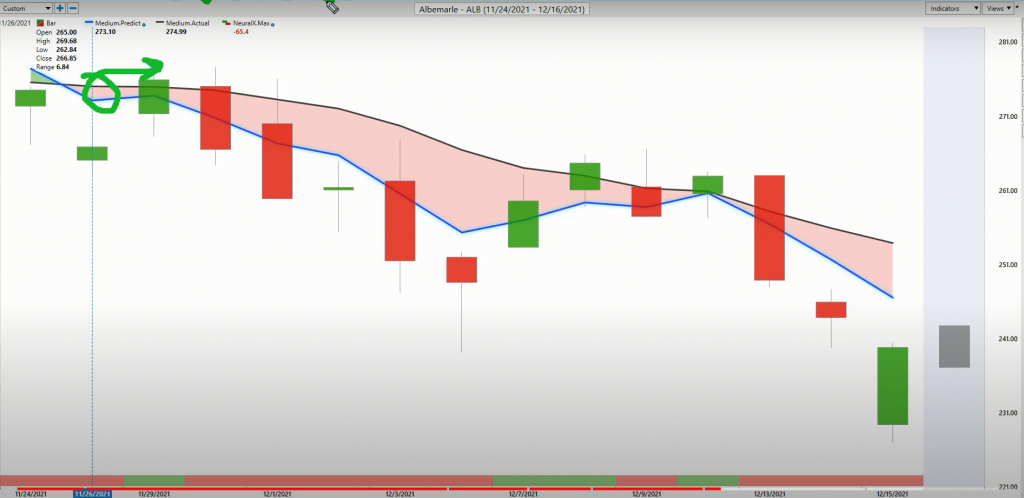
But again, it’s a stock picker’s market here. There’s very mixed things going on. We’ve seen indexes, seen a lot of volatility, and you really want to know, what areas should I be focused on to get this exposure both long and short? So here we got shares down 15%. Again, you don’t have to take that large of a position, but an excellent area to go and hedge that portfolio, especially with what we’re seeing here.
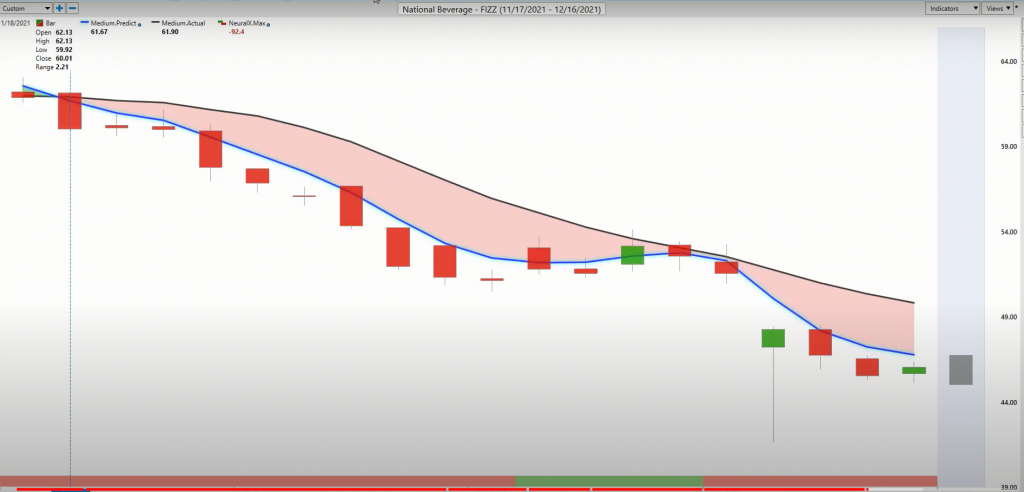
And lastly, just National Beverage. Another one of these stocks where coming into, again, FOMC news and information, and all this coming through, this is an area weeks ago before any of that market weakness came in, right? So here’s the market recovering and volatility coming through these periods, but not in this stock.
And you see that you haven’t gotten any of that crossovers, right? You got your neural index getting bullish here. And so you get sideways price action over those subsequent, I’m trying to highlight the 48 hour periods. But the trend here, very clearly down, and this was actually a great bullish trade, going back several, several months. It’s what got this trade up to about $62, $63 a share, but it gave it all back in about 17 trading days, about a 25% move lower there in a very short period of time.
Again, even just a hundred shares would have you up about $1,500 just over this past couple week period here. And you’ve got those other opportunities where maybe you want to be long somewhere else, but clearly highlighting, where do we not want to take long positions? Definitely, and maybe even look to short over a period like this, and really benefit off of what, regardless what happens here, just by being in the right stocks at the right time gets you exactly that right place, right time. So I’ll go ahead and leave it there. Once again, this has been the Hot Stocks Outlook for December 17th, 2021. Thank you all for watching, best of luck and bye for now.


