Register for a Free Live Training
The Hot Stocks Outlook uses VantagePoint’s market forecasts that are up to 87.4% accurate, demonstrating how traders can improve their timing and direction. In this week’s video, VantagePoint Software reviews forecasts for United Natural Foods ($UNFI) , Facebook ($FB), Southwest Airlines ($LUV), IBM ($IBM), Netflix ($NFLX) and PBF Energy ($PBF)
Hello again, traders, and welcome back to the Hot Stocks Outlook for October 8th, 2021. Hope you all are having an excellent week out there in the financial markets. And as always, plenty to cover here in today’s Hot Stocks Outlook.
So we’ll start out here with shares of United Natural Foods. Really good example of how the tools work. But then we’ll revisit Facebook and Southwest Airlines, which we looked at last week, and then highlight and update those short-term forecasts and how they can help traders really navigate a very interesting market environment we’ve had recently.
But things have shifted in many important areas of the market, so there’s some things going on. We’ve got IBM, Netflix to take a look at. And lastly, we can revisit some of these energy markets, which we’ve covered over the past few weeks here as well.
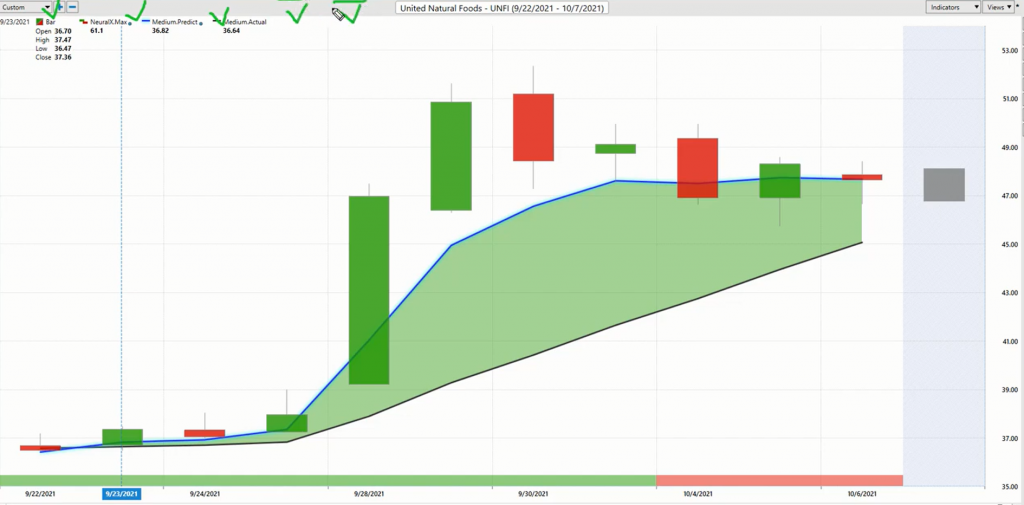
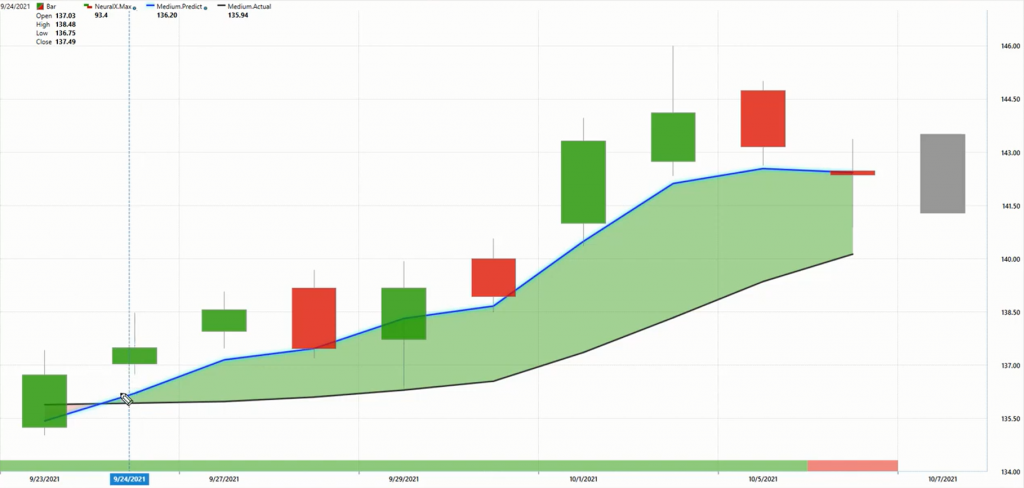
So starting out with United Natural Foods, and what you have here is daily price action, and that’s the same for every single chart that we’re going to highlight here. Right up against those daily bars and candles, you’ll notice there is a black line and also a blue line against the chart there. Now, the black line that you’re seeing, that is a simple moving average, or what we refer to as the actual simple moving average. And it’s a very common technical indicator, right? All it does is it looks back over the previous 10 closed prices, it adds those all together and divides by 10. So what that does is, it’s a really good indicator to smooth out the existing price action, but it always lags behind the market, and this is a real issue with traditional technical indicators. And so what we’re able to do is actually compare that black, lagging moving average to this blue value. And so for that value to get generated and plotted against the chart each and every trading day, VantagePoint is utilizing its technology of artificial neural networks to perform what’s called intermarket analysis.
And so what that means is, for specifically United Natural Foods, this technology has identified important intermarkets, so markets that are known to drive and influence the future price here. Now, those can be positive relationships, inverse relationships, leading or lagging relationships in the data, and they can take place in things like… Obvious places like the S&P 500 or the NASDAQ, but it can also be in things like those broader ETF groups, individual stocks, as well as global commodities, whether that be things like the oil or gold markets, whether that be global commodities or interest rates. And it’s able to take all of this information and actually really synthesize it and build it into a group of indicators. Right?
And so the first one we’re taking a look at here is this predicted moving average. And so whenever that blue line crosses above the black line, again, being influenced by those intermarket relationships to provide a signal as early as possible, that’s going to let us know that there’s been a trend change or shift in the marketplace. And we can see here that as that crossover comes through, you get a tremendous move as far as… As long as that blue line remains above the black line, the overall trend is still up.
But there’s a very important concept here that I want to go over to highlight, well, specifically in United Natural Foods, and then continue on with some of these examples that we’ve looked at over the past couple weeks of how some of these other predictive indicators, when used in combination, can really help traders. So if you look at the very bottom of the chart, you’ll see this bar that goes from green and it goes from red, and this also gets updated each and every trading day after the close of whatever the most recent day was.
And so what that indicator is doing is it’s also influenced via that neural network process and those intermarket relationships, but it’s tuned to only look ahead 48 hours at a time. So it’s very short term in nature, and we can combine that with tools like this predicted high and predicted low level that’s actually provided. So you’ve got a 48-hour forecast intra day. So you can think of that… If you really think of that, that’s down to the minute and five-minute sort of bars, these very specific timeframes of where you want to be a buyer intra day, as well as the overall prediction of average prices and trend direction.
So as long as that blue line remains above the black line, well, the overall trend is up, but more specifically, if we see this market moves up about 31%, it was actually up about 42, 43% at one point, but you have tools like these predicted highs and lows to help you navigate as this market moves forward. So when you’re saying, okay, well, if I want to take a long position, we can see that on this subsequent trading day, on the 24th, you have a predicted low level forecasted of 37 even, and the actual low of the trading day is 37. So you get a excellent entry where the market absolutely never moves against you, then makes a 40-plus percent push in the desired direction.
But you see here, even as volatility comes in, and obviously this is very outside the norm and things are really accelerating, but look how things get back on track, and this is really the key. And if you’re using these tools to manage positions each and every trading day, you’ve got this really good guidance moving forward of, where should you be looking to take advantage of prices in those relevant timeframes? So you see here, you get this predicted low, we move a little sideways. We actually see on this trading day, you come down to the previous predicted low level, but then again, you see everything getting updated here and giving you a really good road map that says, all right, there’s weakness here over the next couple days, improve that overall position. Sell down here, be a buyer down here and protect a lot of those profits that you’ve accumulated as that trend has continued.
But of course, again, one of these things as these trends break out, the volatility is going to really expand and you see how things like the predicted high and low ranges correspondingly expand based on what’s happening in that particular market. And that’s where these tools can really be of assistance.
Now, we looked at Facebook and I really just want to be quick with these, not to spend more time on a lot of these charts that we’ve highlighted as far as the trend moving lower, but just the past week from the Hot Stocks Outlook video. When you’re using these tools and have a game plan that says, okay, well, if I’m trading Facebook, where do I want to look to be short? And you see that we got even more weakness through this week. Again, you see this predicted high being met here, and now you see that this neural index is getting bullish and another predicted low being hit here.
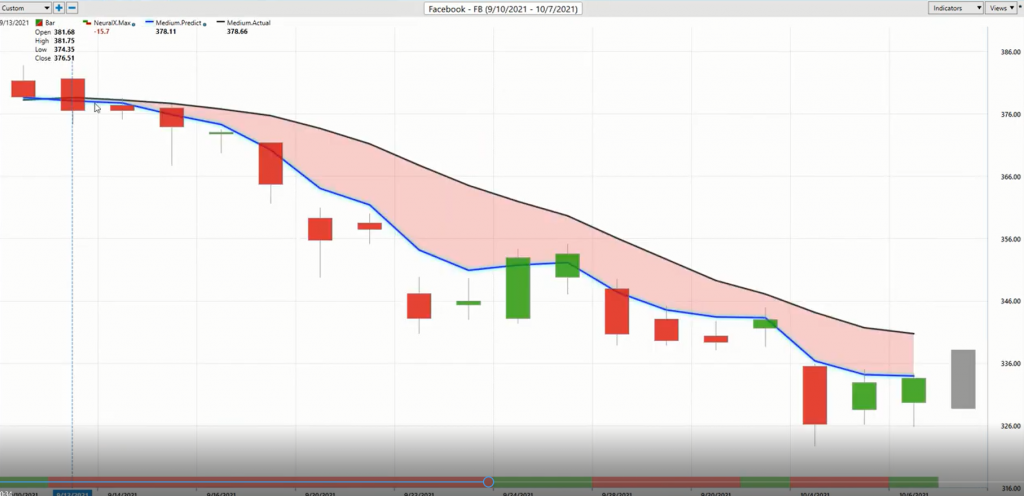
So we’re seeing some signs of overall strength in other markets. And what that means is you can take your portfolio and say, okay, well, I know how to navigate Facebook here, right? I have the tools, they’ve served me very well, and I can keep executing on that strategy, like we brought through Southwest Airlines.
And so this week it was actually interesting, because we were looking at the market and we were right about here when I’m making the video. And I’m just trying to highlight this because if we look at okay, well what were the predicted highs and lows on that trading day? Well, you can see they’re telling you, look for this weakness in the market, look for these lower prices to continue and even subsequently the next trading day expect some to potentially lower prices, but you see just a lot of volatility here, but you clearly only want to be long and taking profits on long positions, right? So you see things snapping around, you see this predicted low again, being hit here, I’m not sure, I think we gapped up and hit the predicted high here. So again, if you have that directional bias, based off these other VantagePoint tools, you’ll have a good roadmap as far as where you want to be looking, maybe short, maybe long and managing these opportunities that you’ve found yourself in.
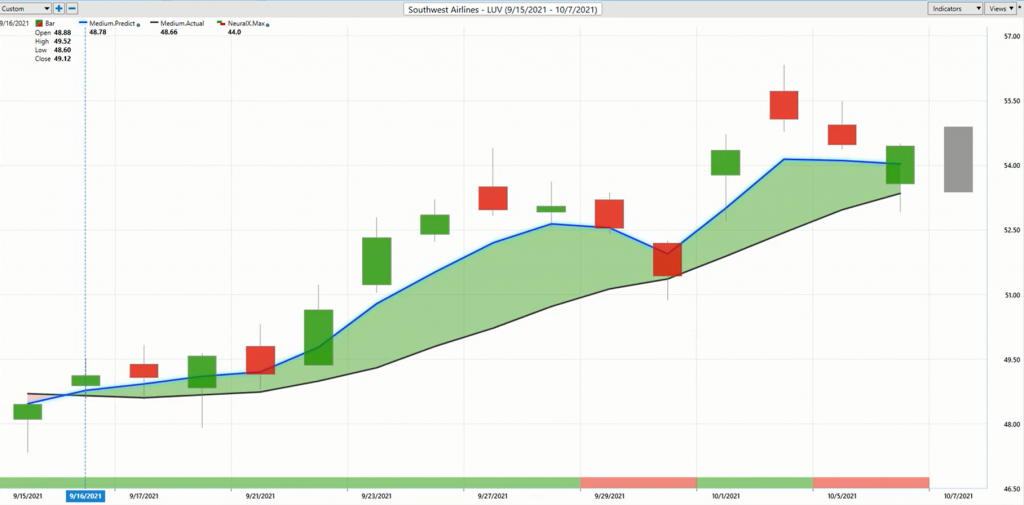
So I want to just highlight that not only do we see some markets moving to the upside and specifically again, it was the airlines, we see a lot of this come through at the same time, but we can use tools like this IntelliScan feature to actually highlight right when these crossovers come through or additionally markets that are in strong trends, right? So when you have a lot of separation between that blue line and the black line, you know that look it’s in a strong trend. You know, again, things like volatility expands is just something that sort of happens as these trends break out. But the point is you have all the information early on in the trade to really get that good position. So you see if you’re a trend trader, you’re getting those very early entries in many of these markets, but also if you’re actually trading these markets, you have some really good information to take these pieces out of short term price action.
So we’ve got Southwest Airlines. Overall here, we’ve got to look at about a 12 and a half percent move so far, but again, I just want to highlight these very early entries that then make it very easy to navigate a potentially long position there.
Now here’s IBM, and this is what I mean by there’s areas in the market where we’re running these scans, seeing crossovers come to the upside, but you need to be very particular about where you want to stake out long positions and certainly, clearly, areas where you don’t want to be taking long positions, right?
We look at the NASDAQ and Facebook and some of these areas where it’s clearly… You don’t have to buy the index, right? You can buy individual stocks and they potentially have the potential to benefit more on a percentage basis. Maybe not IBM here, but you see you get these crossovers to the upside, really good job from those predicted levels guiding you moving forward. And we’ve had an advance in the NASDAQ here and things recovering and you see these early entries, but also the trade management to help you make the most of things as you’re recognizing things shift in the marketplace and you can say, okay, well where are things looking bullish?
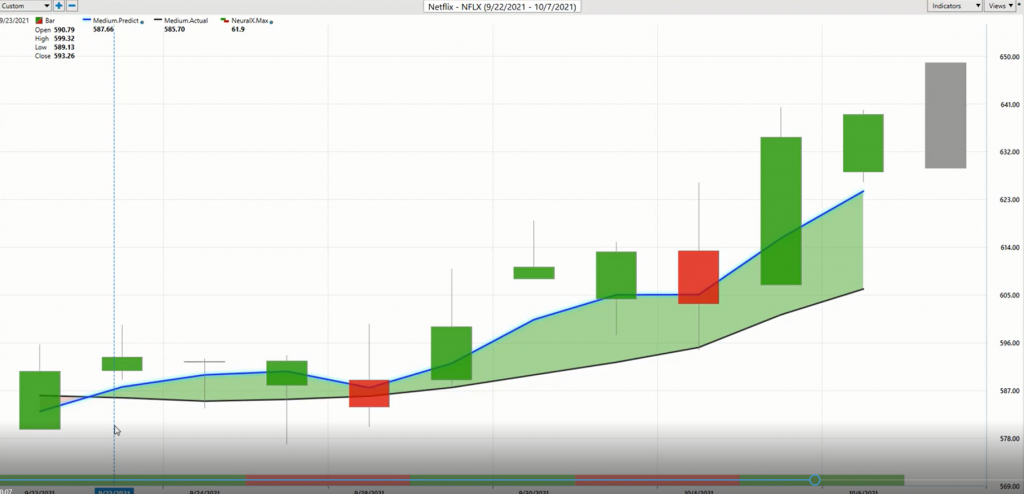
Here we have shares of Netflix. And we see crossovers back here on the 23rd of September, right? So very clearly here, this is a market where you’d only want to go long, take profits on longs. We get a little bit of dips here as we’re seeing volatility broadly in the marketplace, but a trader who can deal with that volatility and run the stops appropriately, really not a lot going on here, you see that blue line still over the black line and this trend really starting to break out. So, so far here, you’ve got about a 8% move on shares of Netflix to the upside. Again, but more importantly, there’s potential for a lot of short term to trading in many of these windows and taking these subsequent pieces out of the market, depending on your trading style. You can get in early on that trend, but also add to that position as it continues.
And lastly here, we’ll just look at PBF Energy and again, just highlighting some of these markets where we’ve seen some of these shifts in the marketplace. It’s clear that energies have been very strong over the recent period. And it made sense that this is an area to look to buy at predicted lows. Now you see again, as the right hand side of the chart here, you see that volatility really starting to expand and things rattle around quite a bit. But early on you see, hey, you’re getting some of these predicted lows being hit, the market starts to trend and make an advance and certainly as the neural index goes bearish, you might get some volatility in these subsequent windows. But you clearly only want to be a buyer taking profits on longs, and you see a really nice entry here. I’m not sure if we hit the predicted low and it immediately hit the predicted high there, but nonetheless, a very good entry, whether you’re still holding onto that position or trailing some stops.
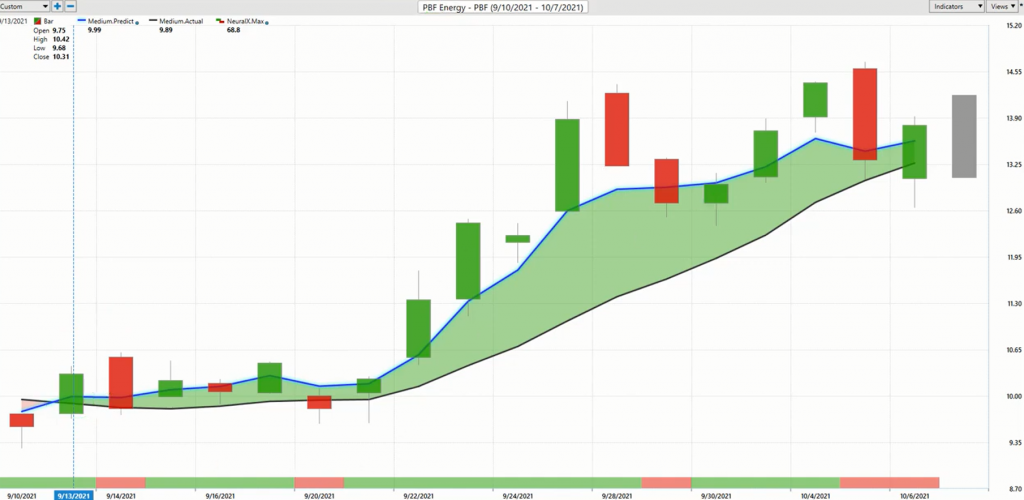
So this has been a… Some of these markets we looked at like SM Energy and things like that last week, just some tremendous moves. I mean, sort of getting the doubling of some of the stock prices, but you see these shares up about 40% in just 17 trading days. More importantly, having these levels to really help you understand, look, if the trend is still up, you know how to manage these things, where to add to the position, take some off and really, again, make the most of all of these different opportunities. We see things crashing lower, the NASDAQ and S&P going lower, but you need to be prepared for when these things shift and understand where are those areas of the market where I can be trailing my stops, holding longs, potentially in energies or potentially some of these more recent shifts in some of the more conventional S&P, NASDAQ sort of stocks starting to recover.
So have a great rest of the week. Once again, this has been our Hot Stocks Outlook for October 8th, 2021. Best of luck out there. Thanks again. And bye for now.