


Register for a Free Live Training
The Hot Stocks Outlook uses VantagePoint’s market forecasts that are up to 87.4% accurate, demonstrating how traders can improve their timing and direction. In this week’s video, VantagePoint Software reviews forecasts for Callon Petroleum ($CPE), Prologis ($PLD), Chewy ($CHWY), McCormick and Co. ($MKC) and Quest Diagnostics ($DGX)
Hello again, traders, and welcome back to the Hot Stocks Outlook for December 10th, 2021. Hope you all are having a excellent week out there in the financial markets. As always, plenty to cover in today’s outlook, and especially exciting period in the markets here, right? We’re going to start out. We got shares of Callon Petroleum. We looked at energy shares last week, and I really encourage traders to go back and watch our August Hot Stocks Outlooks.
We looked at Callon Petroleum, we looked at AMD, which we looked at actually last week as well. We’re going to move on. We’ll cover Chewy, Prologis here, McCormick, which we actually looked at last week as well, and Quest Diagnostics, which we looked at actually on the bearish side in October highlighting that this bearishness looks like it’s over and things are going to move higher. Again, August it’s really great period.
I think September is likely where we’re talking about Quest Diagnostics. September, October, over that period.
But here in Callon, a really good example here of what we’ve been seeing across the energy space. But what we have here is daily price action. Each one of these candles that you see on the chart for Callon Petroleum stock represents a full and complete trading day. You’re going to see that there’s a black line and a blue line right up against that price data.
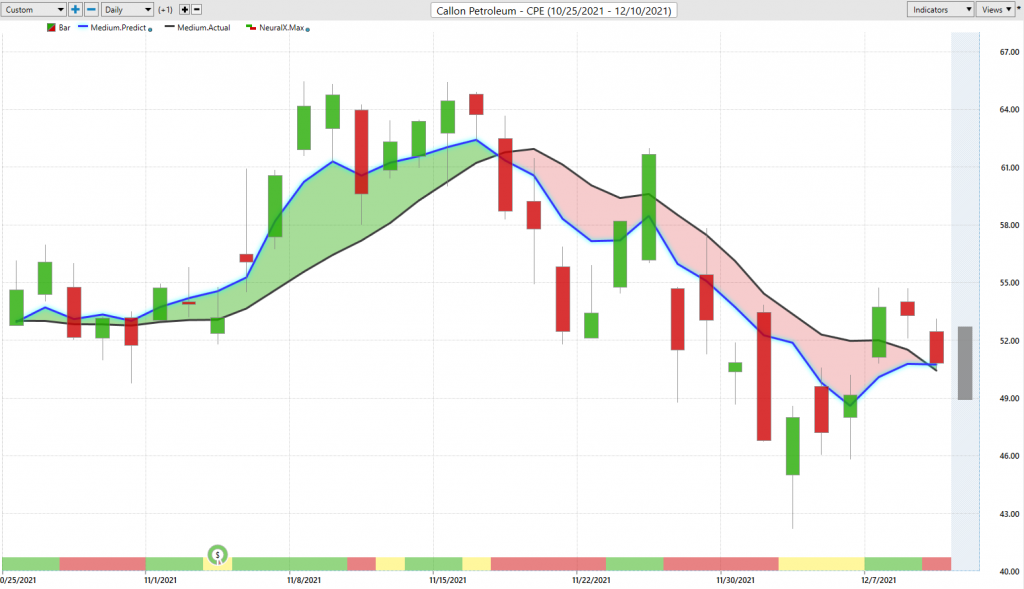
That black line that you’re seeing there is a simple moving average. That’s actually a very common technical indicator. What it does is it looks back over the previous 10 closed prices, and in this case, divides by 10, and that acts as a really good metric to smooth out the existing price data, right? And let us know where market prices have been over a given time period. But traders need to be ahead of the move and understand where are prices likely to go moving next so we can be ahead of those moves.
What we’re able to do with these tools is actually compare that black simple moving average or what we might call the lagging moving average to this proprietary predicted moving average. For that number to get calculated and then plotted against the chart each and every trading day, which is essentially a prediction of future price, that’s where VantagePoint’s technology of artificial neural networks are performing what’s called intermarket analysis.
It’s looking at relationships between markets and able to use those clues derived for that information and forecast future price in an extremely effective way. Now, this becomes very obvious when we look at things like Callon Petroleum or energy stocks, right? Because we know we can see these relationships on a standard chart. Looking at the oil chart, looking at Callon Petroleum, nat gas, shares relationships with certain stocks. This is very obvious what’s going on here.
But there’s also relationships that are taking place with currencies, right? With interest rates. With those global commodities and futures markets, as well as individual stocks and individual ETF groups. What’s happening here is the technology is able to understand what’s happening in these relationships and fed out very important clues as to future price. It’s able to take all of that, summarize it, and actually generate a future price prediction that is then used to generate these values for the predicted moving average.
Now, if we look at the bottom of the chart, we have another indicator that’s tuned differently to a different timeframe and we can use that in a different way. In addition, we have a predicted high and a predicted low. All the technology really tuned in a different way providing a very rounded out forecast of what’s very likely to occur to help traders make better trading decisions.
Whenever that blue line crosses the black line, it’s just average price are going to start moving lower, and then we can look towards tools like the neural index to help us with short term strength or weakness in the market. If we know the overall trend direction, there will be these times where what the neural index is essentially saying here is over the next 48 hours is their strength or weakness. Right?
How I really like to think about is that it’s very short term, right? That there’s this miniature trend essentially in the price action on the upside and the downside, but only over a 48-hour window, right? It’s not looking beyond even 48 hours. We can understand when the next 48 hours are likely to see some strength, but not lose sight of the bigger picture as far as our trading strategy, and more importantly, even have an updated predicted high and predicted low values to make important trading decisions like limit orders, profit targets, things like this.
We can actually look and see, like we do every week here, how accurate all of those predictions are. You see that the software does a very good job. Even before this update, your predicted high and predicted low ranges are moving higher before the trading day occurs. Again, here, neural index predicted ranges getting higher, but the overall trend very clearly to the downside. You again see situations like this where if you’re actually using these tools, here you get a day where you’re coming up a bit, but you’re getting opened at the open, right?
Your order is filled at the open if you’re setting a limit order at some of these levels, and it is highly effective to stay short, cover those short positions, and then alter the guidance with the help of VantagePoint’s tools, because these things are going to update in the same way that back in August we’re getting buys down in the $30 per share as far as the forecast go for Callon Petroleum. Well, things have shifted and they may shift again.
This is where the software does an excellent job of adapting to those changing market conditions and helping the traders make better trading decisions. This is going to be very interesting here, right? Here’s Chewy. This is an opportunity from October where there were a lot of really great opportunities to get long in the market in October. If you watch all the Hot Stocks Outlooks videos in October, it’s all about buying stocks and there’s a lot of strength here.
We covered Chewy in that period, I’m certain. Here we have this predicted low here at excellent entry early on the trend. Things start to move up, then we start to see a little volatility over this time period here. But your entries are coming in at 64, 65, and this market moved up to 79 soon after. Now, once we get this shift though, we start to recognize what’s going on in Chewy, but also some of the broad-based market weakness.
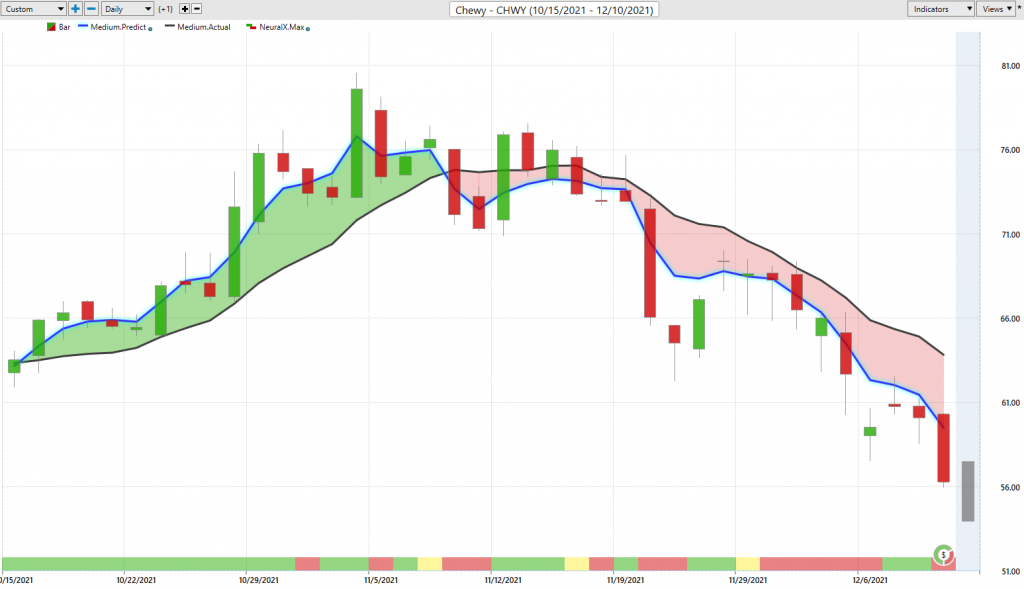
It’s not just happening in Chewy. We see it on the stock indices. We see it on a broad basket of stocks. We know that, yeah, energies are going to be a problem over that time period. We already knew that. Well, Chewy as well is not a place we’re going to want to be over this time period. If we look at the forecast from that point, well, what would you be doing? Well, if you’re long in the market, you’d be looking to cover some of your position. Well, not cover, but take profit on some of your position and potentially short the market and look to short and cover from that point forward.
You see that you get some bouncing around here, but the overall forecast doing a excellent job of letting where you should be taking action and managing the position in however way you might want to do that, right? If you’re a trend trader, you potentially have some really nice shorts up at 75, and you’re potentially still holding those with the opportunity to take some profit along the way with the help of the shorter term tools.
Again, really aggressive drop here and it’s making it very clear as far as the areas that you’d want to avoid as a trader. You see about a 20% drop there. Now, here’s what’s interesting.
Here’s PLD, right? This is a logistic stock, very similar as far as when the strength came in in October. It was very clear that you want to be buying stocks in October, use your VantagePoint’s forecast to go ahead and get long positions, start managing them.
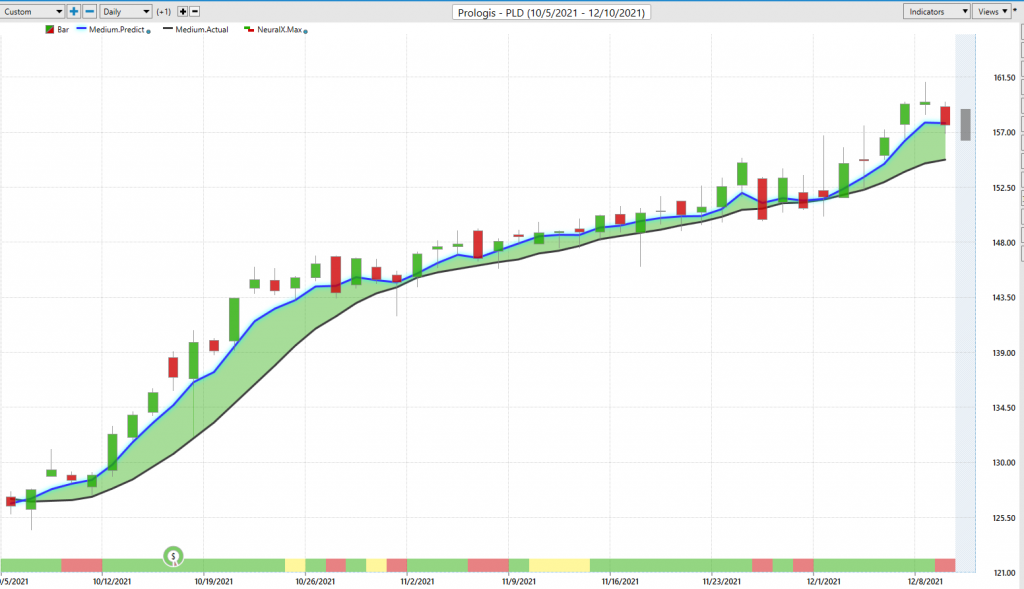
You just see again that the strength of the forecast. Yes, you’re going to get this neural index getting bearish at times and you see the market tends to fizzle out and run sideways over those periods. But the predicted lows over that time period will let you know in today, where should you be looking to accumulate shares of this stock? Again for the short term trader, right?
When you have these periods where things aren’t moving around, maybe you do want to take some profit at the top end and buy back in at lower prices. One of these sort of days here, I always like to highlight these where you’re getting a lot of volatility as far as the upside, market moving higher, and look where this market wants to revert back to. It’s these predicted lows that weren’t hit. You get that volatility and shaking around, and then immediately moving higher once again in the forecast lining up and helping you with all of that.
Again, we’ll just go back to that overall forecast here. You see that this is a very strong forecast all through the weakness in the market, right? Here’s about a 24% rally over the past 44 trading days. A lot of great trading in there utilizing the short term tools from VantagePoint just day in and day out. But don’t lose track of that 24%, right? That you haven’t gotten that indication that things are going lower like you have in some other areas of the marketplace.
Last week, we looked at McCormick here. Again, I want to highlight some of these areas where the forecast do such an excellent job, and even in areas where you may look at a predicted high and low, you might look at it and go, “Oh, well, it came out of the area.” But then when you look more closely and think about, okay, actually setting up a strategy and a timeframe around this, how would this work? Right? Overall, we’ve got 11% rally here to the upside in about 36 trading days.
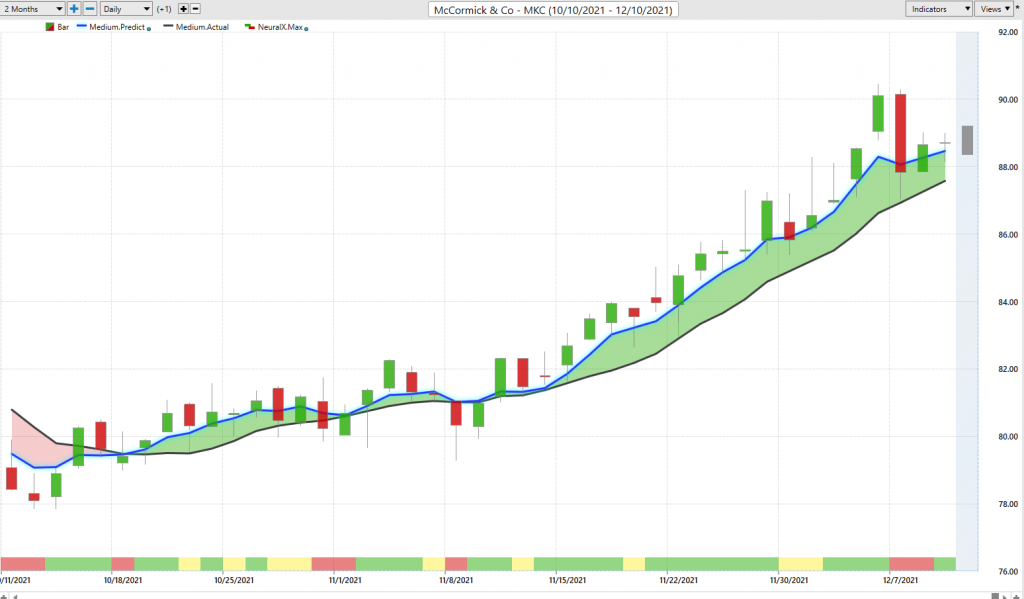
A lot of the better entries of course was a trend trader coming in early here with these predicted lows. But more recently, you’ve seen a lot of volatility in the marketplace, and this is even from last week already. The market just shoots up, right? We’re covering this here and saying, “This looks like a strong stock, even with some of the volatility.” Markets start to recover a little bit, and this thing really recovers. But look again. You’re coming, you’re not hitting these predicted lows, right?
Prices are really frothy, it’s moving straight up. You can anticipate that you get that pretty aggressive pullback, but look where the market closes. It closes pretty much right at that predicted low, and then trades up hits the predicted … You’re back into trading and potentially managing things. But the overall trend, still the upside. Really nice opportunities all throughout the marketplace. Again, even from that predicted moving average, you’re well above the predicted moving average. You can froth around that a little bit.
But oftentimes, that’s what you see is happening. You’re just hitting an earlier predicted low level, which generally makes sense. If all the volume the previous day was buying, then the next day it’s profit taking and selling, takes you down to that level, it’s important to know those levels are there.
Here’s Quest Diagnostics. I wanted to bring this through actually because this was a stock that was still in a down trend, but we recognized all that strength coming in October. Again, watch the early October period videos of the Hot Stocks Outlook.
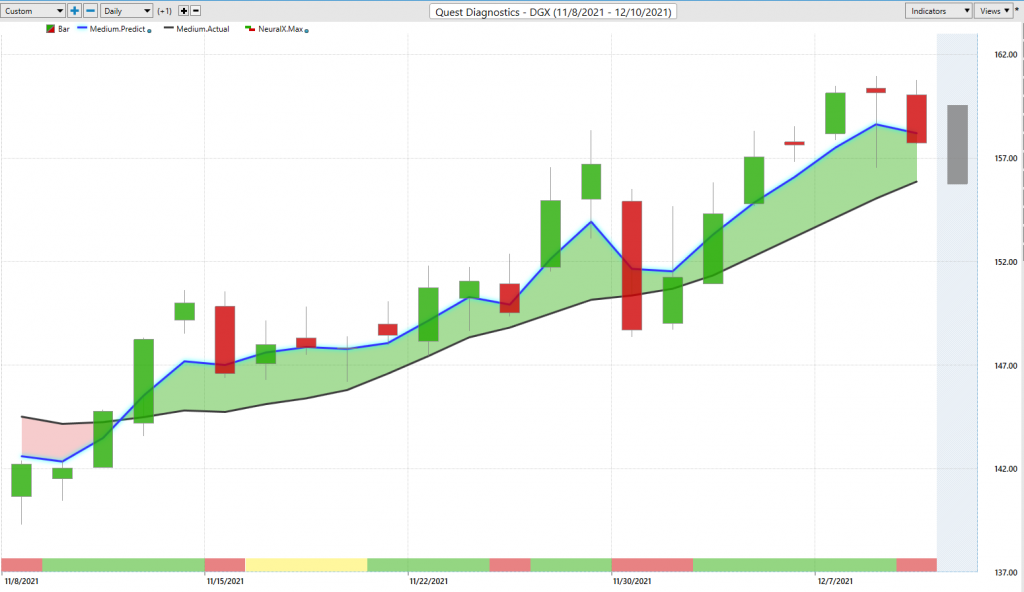
Quest Diagnostics were actually highlighting the weakness that had come through in September. The Quest Diagnostics was a good place to exploit that weakness. Well, now, very clearly, you’re getting a very strong cross over the upside here, and again, the short term forecast in a market that’s seen a lot of volatility. Exact example of what I was just explaining here of you’re getting a gappyness. Right? It’s all buying, volume comes in and it pushes the price up, but there’s still the selling volume that has to come in and balance things out, and you see that, yep, you go right down to that predicted low.
This is where the software always has to give you an updated prediction. In some cases, the trend is going to continue and this generally works very well. These predicted highs and lows you see come lower. But this is where it’s great, it’s the software’s adaptive qualities to understand that, okay, we closed lower here. What’s going on here with these short term forecast? Get everything back online here. Again, you see it happens again here. This won’t hurt you because you’re going to be on the bullish side if you’re using the trend forecast here.
But you gap up out of the area, look where the market wants to divert to. That predicted low, on the money, and then things are moving back up again. There’s these little nuances if you’re working in a smaller timeframe that you’re going to want to be aware of, especially when volatility gets to be extreme and you’re really pulling away from some of these average predictions of price.
But overall here, the trend very much to the upside and we can see how that guidance is going to help me say, “Okay, what area should I be long? If I’m going to be long those areas, what level should I be looking for to manage?” That allows you to really create quite a diverse portfolio of opportunities, whether that be to the long side or the short side, and really manage those quite effectively. Once again, this has been our Hot Stocks Outlook for December 10th, 2021. Thank you all for watching. Best of luck out there, and bye for now.


