Register for a Free Live Training
The Hot Stocks Outlook uses VantagePoint’s market forecasts that are up to 87.4% accurate, demonstrating how traders can improve their timing and direction. In this week’s video, VantagePoint Software reviews forecasts for United Rentals ($URI), Caterpillar ($CAT), Johnson and Johnson($JNJ), and Bed Bath and Beyond ($BBBY) and KeyCorp ($KEY)
Hello again traders and welcome back to the Hot Stocks Outlook for April 8, 2022. Hope you all are having an excellent week out there in the financial markets. And as always, plenty to cover here in today’s outlook. And we’re going to be doing a little bit of a review episode. Like we typically do, we want to bring in markets and see those updated forecasts, but we’re really going to dig in here looking at United Rentals, which we ended on last week. Also, Caterpillar, Johnson & Johnson, I believe Bed Bath and Beyond, we’ve covered all these videos over the past few weeks. And lastly, we’ll look at KeyCorps, we’re actually seeing some weakness in financials, which we can highlight there as well.
But let’s start out here with United Rentals and really continue on on how these tools works and importantly, how they can help traders adapt to those changing market conditions. So looking at United Rental here, what we have here is daily price action, right? So each one of these candles on an individual basis represents a complete day of trading. And right up against all those daily price closes, you have a black line and also a blue line there. So the black line that you’re seeing there is a regular, simple moving average, a very common technical indicator. In this case, it’s a 10-day simple moving average, so it looks back over the previous 10 closes, adds them all together, divides by 10, and smooths out the price data for us. But traders don’t need to know where the market price has already been and that’s really what that simple moving average is telling us. It’s really just looking at the recent closes and getting dragged around.
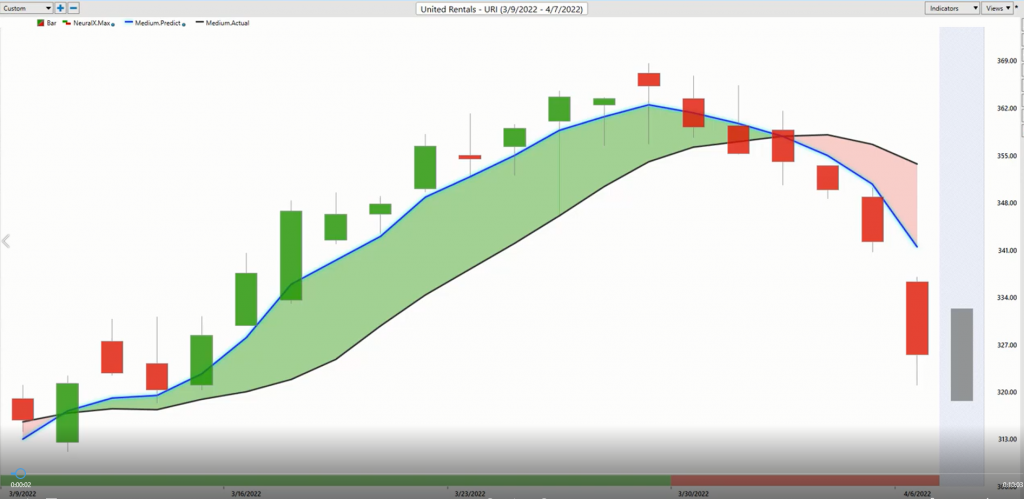
Traders need to be ahead of the next move in the marketplace. And so what we’re able to do is actually compare that black lagging moving average to this blue value. And for that value to get plotted and calculated every single evening, this is where the technology of artificial neural networks comes in and it’s performing what’s called intermarket analysis. So specifically for United Rentals, this technology has determined up to 30 markets that are known to drive and influence the future price of this stock. Now, that’s going to be things like the S&P 500 and the NASDAQ, certain ETF groups, but also things like global currencies or global interests rate, or as we’ve seen recently, oil driving stocks and certain stocks more so than others, right? So it’s able to take this global information and actually generate future price predictions. And it’s those predictions generated via the technology that are worked into these indicators, turning what were lagging tools that just reflect what’s already occurred in the market, into a forward-looking predictive tool.
So what we talked about was this blue line crossing over the black line and leading to this rally to the upside. But what we ended on with the last video was that the last reading from the neural index at the bottom of the chart was bearish. So I encourage you to go back and watch that previous video. But what we explained is that the neural index down here at the bottom is also driven via that technology of artificial neural networks, but it’s tuned to solve a different problem for traders, this one being short-term strength or weakness over the next 48 hours. So on the way up, it was very clear, hey, you want to add to the position, take profits, stay long. Great. But after that trading day, it suggested look for weaker prices over the next 48 hours. An important tip for traders to be aware of, so they’re ahead of that weakness coming into the marketplace. But potentially more importantly here is this crossover the downside indicating that the trend is now down, and you should go and look to get out of the position or conversely, look to short the market.
Now that’s where the neural index is extremely helpful. And you see that neural index went bearish and it never got bullish again. It just keeps forecasting weakness over the subsequent 48 hours of trading. But what is really exciting are things like the predicted highs and lows, which will actually project a intraday predicted high and low level. Which traders can make trading decisions, whether you want to put limit orders and stop market orders and things like this at these levels to make these better decisions. But the point being is we can go and see how accurate really the aggregate of all these indicators together are. Right?
When we look at the forecast collectively, we see that, okay, well, the neural is telling you look for these daily ranges to be lower, but you’ll actually see, even if you’re still bullish at that point, you’re getting excellent entries to buy the market and potentially make some money on day trades. But this day is where that ends and where that blue line is crossing below the black line. And if anything, you should get out of all your long positions and look to short, and you see that has been very important to recognize. And I stress this because it’s not just here in this market. Now, certainly we’re seeing United Rentals scale back about seven or 8% here, but there’s been another important shift to the marketplace.
It was about Thursday of last week literally, we see it in United Rentals. Or that neural index goes bearish. As we run in the scans with the help of this Intel scan to see these predicted moving averages start moving lower. We start to see that in a lot of areas throughout the marketplace, and it warns us that maybe on the portfolio level, things need to adjust here. So here’s Caterpillar. And again, highlighting that, “Hey, there’s a lot of strength here.” Again, the 24th, 25th of February, a lot of strength comes in the market. We see the Intel scan indicators picking up on that and letting us know that there’s strength coming in.
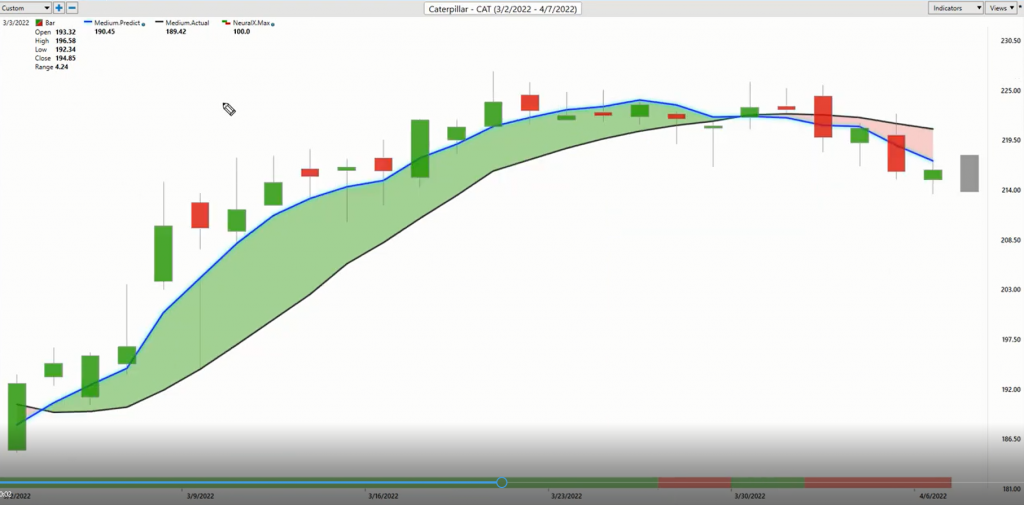
But recently here we’ve started to see some weakness and I wanted to bring in Caterpillar because you see how the collection of these indicators work together. You’ll notice that you’re getting a crossover between the blue line moving below the black line. And certainly those average prices are going to move lower. But notice the neural index, this 48 hour indicators saying, “Look, expect higher highs over the subsequent 48 hours.” That’s how I often like to use that tool.
Once it gets back down to the bearish, so you get more weakness coming into the market there, but again, this very important shift that’s taking place. And when you recognize that, right? So the last forecast we’re talking about, “Hey, Caterpillar looks strong. Let’s take these forecasts, keep buying the market.” Great. Markets going up 16.5%, but you have to recognize that something shifted there. And now we need to take that into account and take profit on our Caterpillar, if we’re still long and potentially even short or buy some put options. Let the indicators drive your action is really the point. And this is how we’re using this technology to make better trading decisions in the marketplace.
Johnson & Johnson, another market brought in from last week, but we can see has not suffered from seeing these crossovers move to the downside, but still the market generally weak there and the neural index picking up on some of that weakness. But you’ll notice the blue line remains above the black line in forming traders, that if anything you want to remain long. And over the past couple weeks, you see the guidance of these predicted highs and lows. And this is the stuff that I love is where, when you have a strategy that can certainly deal with a couple days of volatility, no problem. You see, you have this day where you come out of the range a little bit and go, “Okay, what happened there?”
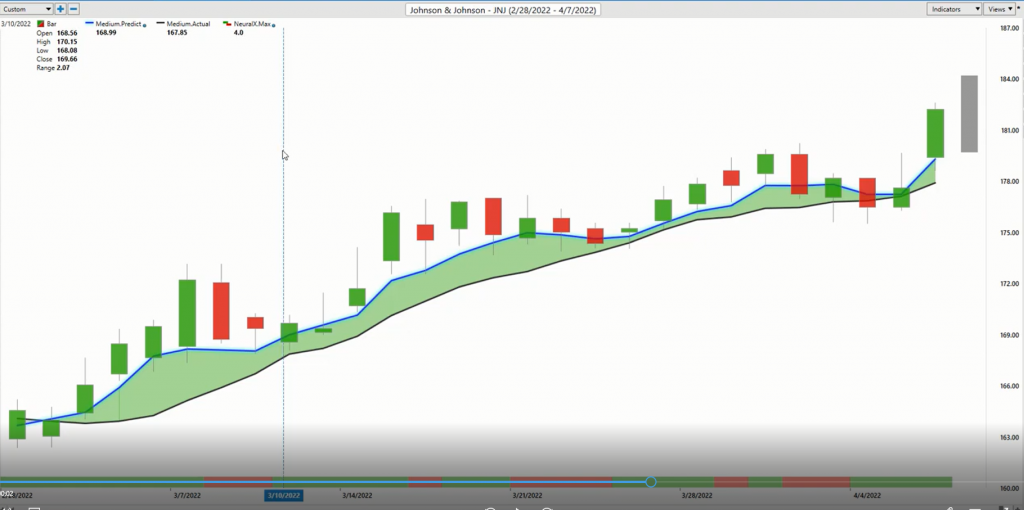
This is where the software is really helpful at looking at all of that information, not just in the target market here in Johnson & Johnson, but those 30 related inner markets that are driving an influencing thing and said, “What happened here? What happened with the close? What happened with all those inner markets?” And then forecast forward future prices. And this is where traders can just their position so that when you are benefiting from that strength that came in really all through the month of March, you can benefit from that, but not lose sight that certain things may have shifted in the marketplace and other opportunities are opening up that require maybe some different action here.
So here’s Bed Bath and Beyond. This qualifies as a meme stock, it gets driven around by news and information hitting the market. But most of the time that news and volatility isn’t hitting the market. And overall the software has a very high level of accuracy through earnings reports, news announcements, fed announcements, regardless it still has that very high level of accuracy from the tool and its indicators. And so you see here with Bed Bath and Beyond the neural indexes letting you know that things are running sideways here, right?
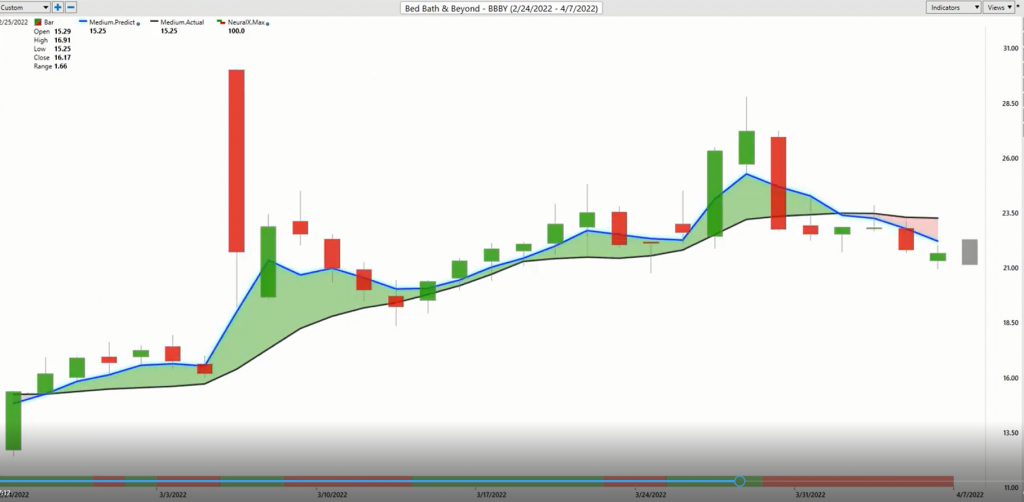
You get these dips in the market and it does a really great job of warning you of when this weakness is coming in. But very clearly this stands out as a period of strength, as that blue line remains above the black line and a very important shift happening here. I actually think we’re down like 10, 15% here on again, news announcements. But you see how, despite all those news announcements, you’re able to manage the opportunity and understand when these important shifts are happening. Again, not just in this market, but potentially broadly throughout the market and a potential to make those adjustments at a portfolio level.
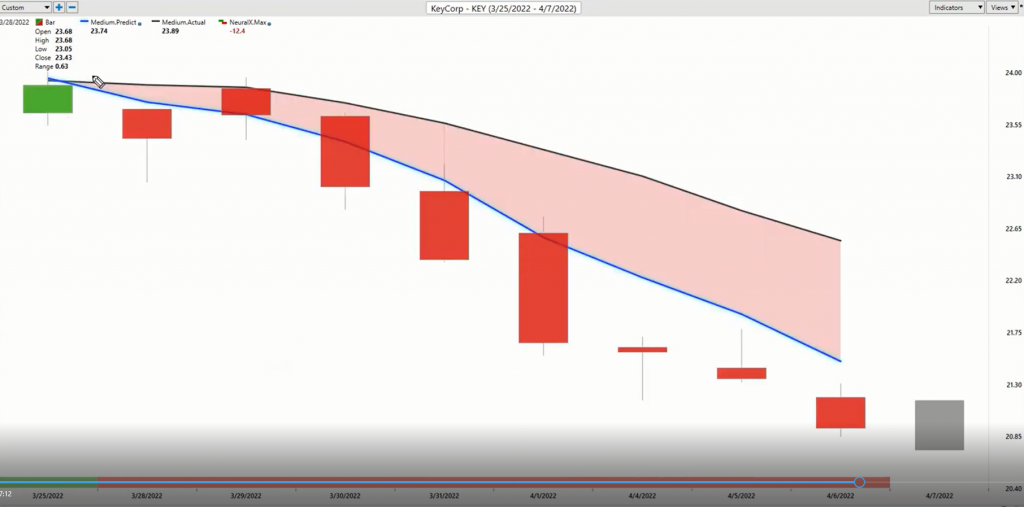
Here’s KeyCorp, so speaking to some of these financials and some of this recent weakness coming in. Very clear blue line crossing below the black line, you see really at the end of March. And if you want to get that exposure, hedge some of those longs that we talked about in previous Hot Stocks Outlooks. Or whatever your positions might be out there’re areas to go ahead and put a short on. And this is where the software does an excellent job of saying, “Okay, look towards these levels up here, but you do not want to get long here in KeyCorp.” And tangentially a lot of these other financial stocks, you’re seeing a very similar picture. And that’s where the indicator, but using these indicators in a very process driven way, really helps traders get ahead of these moves and recognize a lot of this strength and weakness here in the marketplace.
So about a 12% decline there in KeyCorp. But you just see these opportunities all over the place where, Bed Bath and Beyond a really great opportunity on the upside, moved up to 48%. Was up much higher at a certain point, if you had any orders to maybe take some profit on it, would’ve got filled almost 100% gap up there. But very clearly again, recognizing that, no, you don’t want to keep that behavior going. And if anything actually short up at these predicted highs about 23 and subsequently you’ve seen the market very quickly start to move lower up from those levels there.
So, it’s all about having the right tools and really having confidence in those tools to guide you moving forward and make those adjustments where you need to. And really adapt to those changing market conditions and not get stuck in a very static way of looking at things that keep you behind when these important shifts happen in the marketplace that can be very opportunistic and profitable. So we’ll go ahead and leave it there. This has been the hot stocks outlook for April 8th, 2022. Thank you all for watching best of luck and bye for now.