


Register for a Free Live Training
The Hot Stocks Outlook uses VantagePoint’s market forecasts that are up to 87.4% accurate, demonstrating how traders can improve their timing and direction. In this week’s video, VantagePoint Software reviews forecasts for SPDR SPY($SPY), HF Sinclair ($DINO), OVINTIV ($OVV), AMDOCS ($DOX). DropBox($DBX) and Wingstop ($WING)
SPDR SPY ETF ($SPY)
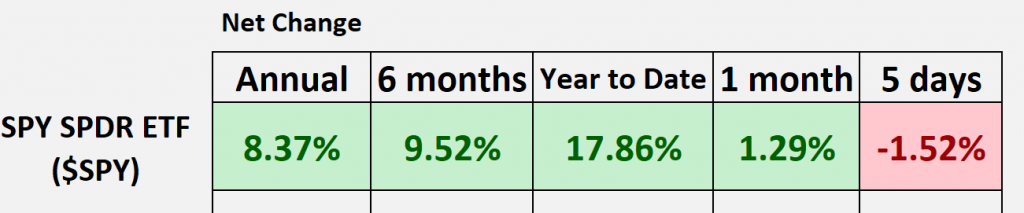
Hello again traders and welcome back to the Hot Stocks Outlook for August 4th, 2023. I hope y’all are having a excellent week out there in the financial markets. As always, we’re going to have plenty of exciting opportunities to cover here today. So if you haven’t already, make sure you go ahead and click on that link in the description below. And you can sign up and get a live demonstration and learn how this predictive technology through intermarket analysis and artificial intelligence can help you make much better trading decisions in the marketplace. So let’s start out as we typically do by looking at that SPY ETF or essentially the S&P500. And so what we can do is just look back over some of these periods, get a sense of where market prices have been over a given period of time. And so if we go back 12 months, well we see we’re actually about 8% on the SPY ETF. Year to date numbers have been great, up about 18%, but things have run a little bit sideways. And I really encourage you to go back and watch some previous Hot Stocks Outlooks.
It’s really highlighted that energies look really bullish here. Looks pretty nice in that area of the market. But tech’s running a little sideways. And this is why it’s really important to have these predictive tools to make sure you’re ahead of this stuff and have the portfolio positioned effectively to make some money.
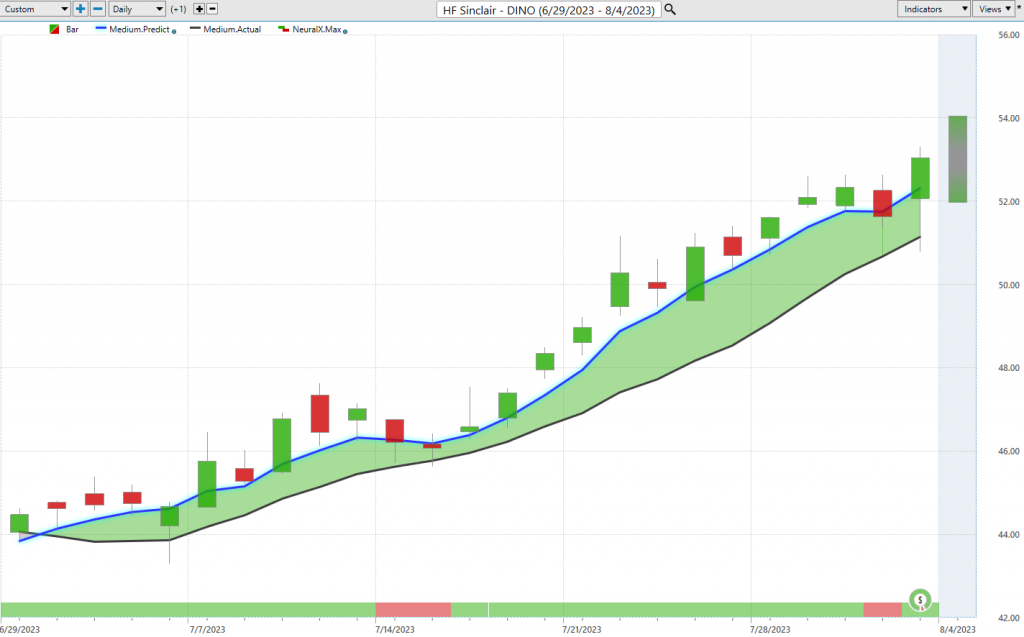
And so starting out, we’ve got HF Sinclair, Ovintiv, a couple of those energy stocks, a couple tech stocks that we’ve looked at over the last month. And lastly we’ll end more on the restaurant consumer space with shares of Wingstop. And so here, HF Sinclair, we’ve really been highlighting this opportunity really week to week. And what we have here is daily price action. So each one of these candles that you see on the chart represents a complete trading day. And it’s right up against that price data that what you’re going to see is that there is a black line value and also a blue line value.
And what the black line value is actually a simple moving average. We kind of refer to this as a traditional technical indicator in that what it’s going to do is look back over the previous 10 closes in this case, add those all together and then divide by 10. And so what that does is it gives you a nice rolling number of where market prices have been over a given period of time. But the problem with technical analysis and tools like that is that all the data comes from the past, and is therefore lagging the market. And so what we want to do is actually compare that essentially baseline value with that simple moving average or what we call the actual moving average and compare it to this proprietary predicted moving average. And for that number to get calculated and plotted on the chart every evening for traders, well, this is where that technology steps in.
And so what it’s doing is rather than just looking back at past prices of HF Sinclair, it’s looking at global markets that are known to drive and influence the future price of this target market or stock. And so obviously that’s going to be things like the crude oil market, RBOB or gasoline contracts. Well, they were up about 18% in the month of July alone. But it’s going to be able to look at things like the stock market. The SPI, the ETFs, maybe energy ETFs. It’ll look at individual stocks that are applicable to again, the target market in HF Sinclair.
And it will even look at things like future markets, like the value of the dollar index, global interest rates, and maybe even some other commodity markets that are affecting, again, those future prices specifically in this case. And so if you think about artificial intelligence, what it’s really great at doing is taking in a huge amount of data and then generating extremely accurate predictions. And so the data sets being used are those intermarkets that are known to drive, in this case an energy stock. It’s kind of easy to see how some of this stuff might be very important as far as crude oil contracts and RBOB and natural gas and some of this stuff. So what we get is essentially a prediction of where average prices are expected to move. So whenever we see that blue line plotted on the chart and you see it’s moved above the black line, what suggests those average prices are going to start moving higher?
Depending on your trading strategy, you may want to go ahead and take profits on your long positions. And so we see here as, and I mentioned those RBOB contracts are up about 18%. Well, here you see HF Sinclair, a refinery chemical company, definitely within the energy space of about 18, almost 19% in the past 24 trading days. But you get a little bit more than that. So when you want to solve different problems, well that’s where artificial intelligence and neural networks are really ideal. And so when we want to figure out, okay, well what’s going on in the short term? Is there strength or weakness? This is where this indicator called the predicted neural index comes into play. And again, this gets updated each and every trading day moving forward. And what it’s doing is forecasting short term strength or weakness over the next 48 hours.
So maybe you’re a short-term trader, maybe you do some day trading. And what you can see here is as the market moves up, you’ll get these periods where the neural index goes bearish. And you might get some weakness over that subsequent 48 hour period. But if the overall trend is up, well, you want to take profits on those long positions, buy on the dip, and act accordingly based on your approach and strategy. And lastly, really taking it even shorter term, we have a predicted high and a predicted low value. So essentially intraday values are calculated before the next trading day. Really at 6:00 PM before 9:30, the market’s open the next morning, you have all of these levels and can set limit orders and even profit targets and breakout points and all those sorts of stuff. So what you see with HF Sinclair is, well, we’ve got that blue line crossing above the black line neural index bullish.
And over the course of this really nice month in energy, you have this guidance from the vantage point predicted highs and lows. And you see here has the market constantly moves down to these predicted lows. Let’s see about six or so entries there. But overall, the trend, very bullish. And so this is how traders can utilize these tools to make the most of these trading opportunities. And again, where it really helps is actually using tools like the VantagePoint IntelliScan that will help you recognize that, okay, well what sectors are moving up and what sectors you maybe want to avoid so you can get that portfolio positioned effectively.
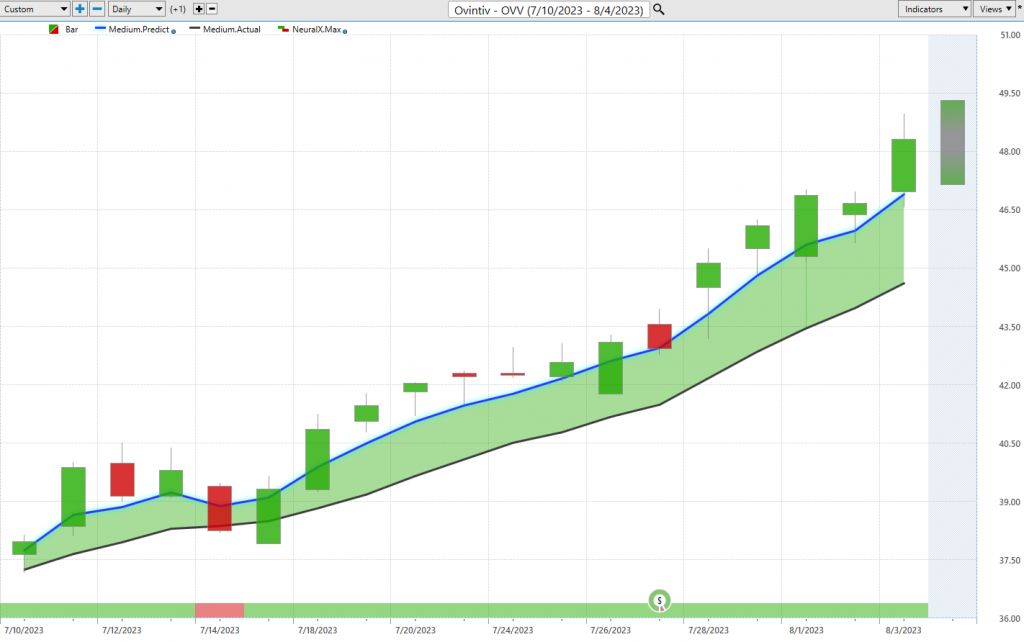
Here, shares of Ovintiv. So another more traditional oil stock here. Here you see that blue line crossing above the black line. And the thing is, you see this across a lot of the vantage point forecast in the energy space.
And as the trend progresses, you have that updated guidance with that neural index staying bullish saying those subsequent 48 hour periods are still quite bullish here. And then again, you get those predicted highs and lows to guide you. So even if you’re a very short-term trader, you’ve got these levels ahead of time that say, all right, well be ready. You see, in this case, you actually get a gap down where you’d more likely than not get filled right at the open there and shares go higher. Again, you see it here, a gap down towards that predicted low and then the market advancing. So even here, just in the past couple of trading days, a really nice move off of those predicted levels. And this really just being a Tuesday to Thursday here, about a 6, almost 7% rally in shares of OVV. But what we’ve also highlighted is that there’s been some weakness.
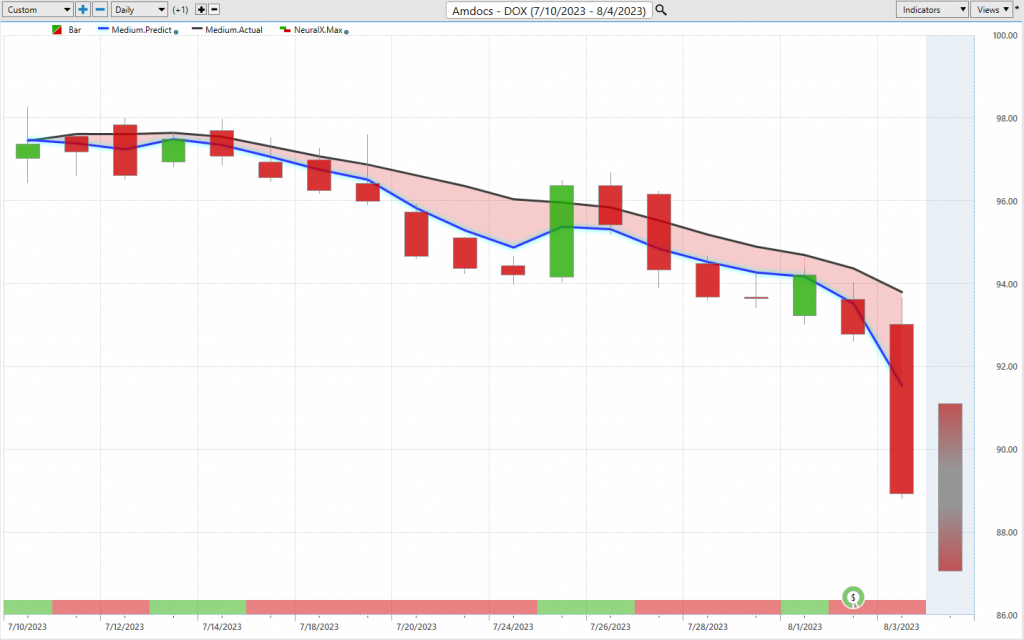
We’ve actually looked at Amdocs, going back a couple weeks now, and this was an area of concern. And so what you see again is that blue line crossing below the black line, the neural index, very bearish here at the bottom of the chart. But you will get these short-term situations where the neural index gets bullish and you see what happens. You get a gap up. Here again, neural index is bullish. You have a couple of trading days where you’re still trading up towards those highs, but notice that the blue line is still very much below the black line, letting you know that the overall trend is still down. You may want to go ahead and act accordingly and maybe have some shorts in the portfolio to compliment some of those longs in energy that’s been doing well. So again, we see here just a really nice move if we want to look at the entirety of the move here.
And there’s been a lot of earnings too. So that’s the thing is you get yourself positioned really effectively early and you can take on some of that risk going into earnings. Here you see about a 8, almost 9% decline in just the past 18 trading days in shares of Amdocs. And again, really these first four markets being markets that we’ve definitely looked at over the past 2, 3, 4 Hot Stocks Outlooks, videos.
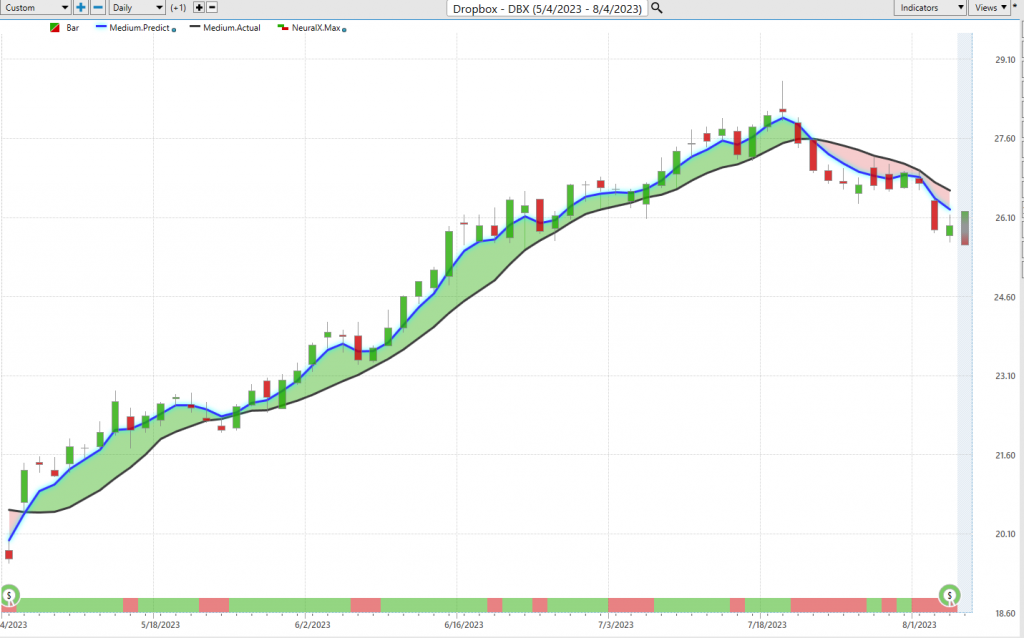
Here’s shares of Dropbox. And interestingly enough, this was one of these opportunities on the bullish side. So as tech was really advancing higher, well, great, we understand where that strength is likely to play out. We have that neural index and also those predictive highs and lows to help us and guide us moving forward. And you can see that as the market rallied and as tech shares were doing extremely well in the NASDAQ, and the indices just reaching newer short-term highs day after day, we have a ton of excellent levels here to say, okay, well accumulate that position.
You can take some profit on the bullish side as you move up towards these predicted high levels, you typically eventually get a decline to go ahead and get back involved in the market at lower prices. But as the markets start to shift, you need to be aware of that. And what you’ll recognize is where are those shifts happening? And so here you see that blue line crossing below the black line. And just now over the past couple of weeks, we can actually go ahead and zoom in on this a little bit. We can see those predictive highs and lows being very effective here. And letting you know that, okay, well, as the market moves up towards this predicted high, again, you see a gap up, you don’t want to be long there. You want to short, take profits on shorts. And we actually see from that level a pretty nice decline here just over the past few trading periods.
So here we have another 4, almost 5% drop in shares of Dropbox just over, yeah, about six trading days there.
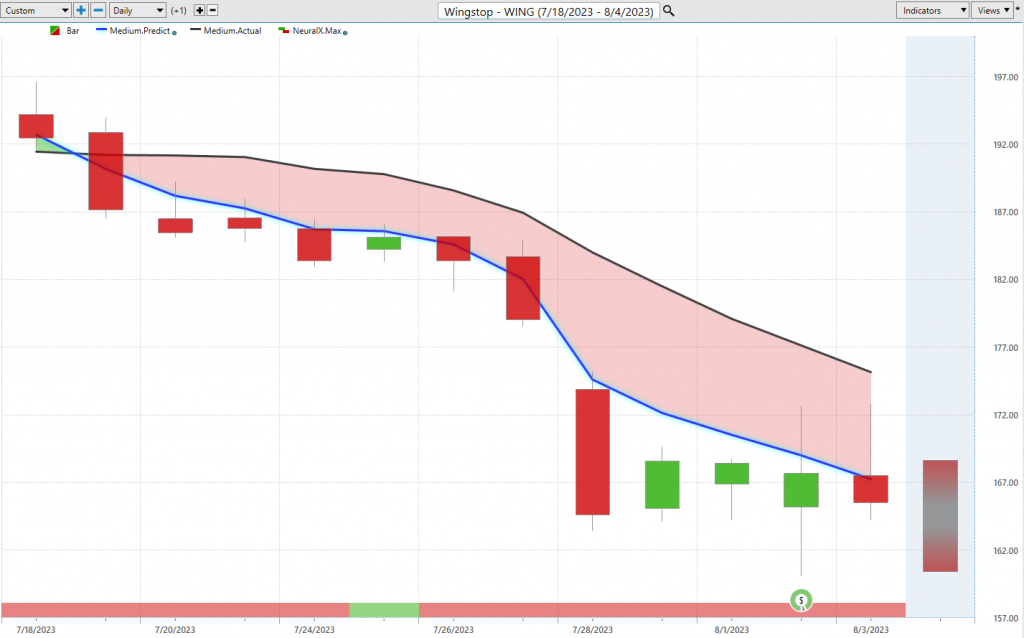
Lastly, we’ll take a look at Wingstop. So more in the consumer restaurant space. And a lot of restaurants have done really well. We saw shares going higher and a lot of the state companies and Darden restaurants and a lot of these things. But here we see Wingstop that crossover to the downside. And you see, this is how effective this neural index is. If we look at all of these trading days, we have about 12 or 13 trading days here. You have one day where that neural index is bullish and you actually do trade sideways here 48 hours later. You’re opening here, probably trading up throughout the day. But recognizing, hey, you want to be on the bearish side here, looking towards those predicted highs as an area to go ahead and set short positions potentially. Or just don’t trade in these areas where the forecasts are to the downside.
Make sure you’re not really just getting out of the way essentially. So here we can see from these predicted high levels, the market moving lower off already about 12% in just the past 10 trading days. And so this is why this is really important to have the right tools. And aside from these very accurate short-term forecast indicators from VantagePoint, there’s tools like the VantagePoint IntelliScan. So this is what allows traders to really search the markets and understand, okay, well, we can identify some markets that maybe are trending on the bullish side, we can see how much of the market is trending bullish. Maybe want to look towards the downside or see some of these markets that have been in a trend for a longer period of time so that we can sort of assess things and say, okay, well where might I want to go ahead and look for opportunities to hedge my portfolio or identify new trading opportunities?
And so this is where these predictive indicators are really helpful to let the trader know, okay, well, where are things shifting? And you can do this every single day. Recognizing these big shifts in the marketplace, what sectors are doing well, like energies we have here, and some of those areas where you really might want to avoid so you don’t get the portfolio wrapped up in things that aren’t going to work, aren’t likely to work as well. So once again, this has been our Hot Stocks Outlook for August 4th, 2023. Thank you all for watching. Best of luck out there and bye for now.


