Welcome to the Artificial Intelligence Outlook for Forex trading.
VIDEO TRANSCRIPT
U.S. Dollar Index ($DXY)
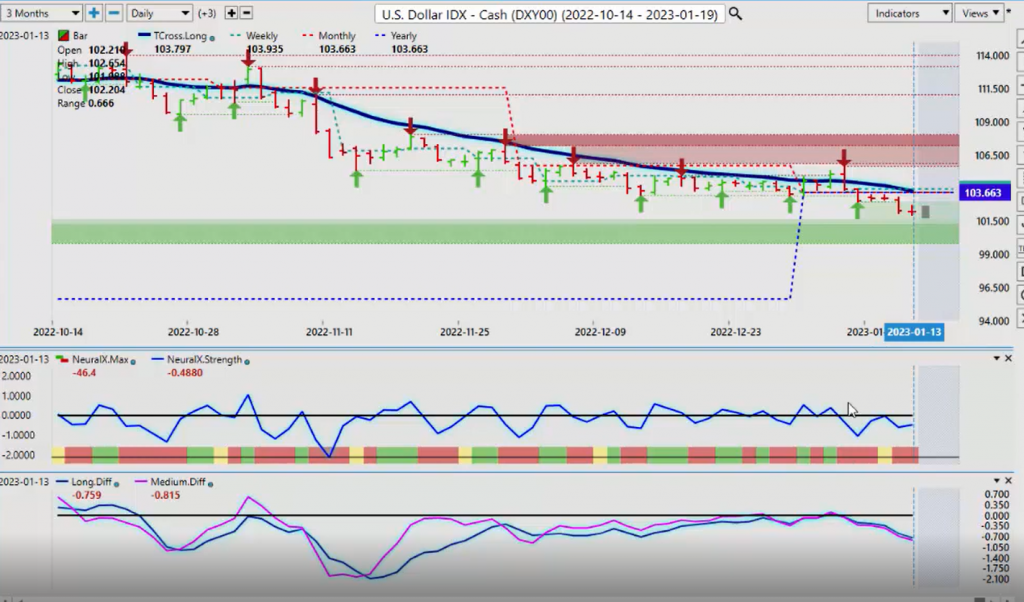
Hello everyone and welcome back. My name is Greg Firman and this is the VantagePoint AI market outlook for the week of January the 16th, 2023. Now to get started this week, we’ll begin where we always, do with that very important US dollar index. Now as you can see here, I have the VantagePoint point in time set to the weekly, the monthly, and the yearly opening price. Now, those levels are coming in at or about 103.66. The dollar is bearish, while below this particular area.
Now, with the dollar being bullish, the inner market, the inverse correlations to the S&P 500 is higher, oil higher, gold Bitcoin, all of these markets are higher on a down dollar. Now, we’ve come through the CPI number. I didn’t see a big shift in inflation. I think inflation is still very high or elevated in the US, so I’m not convinced that the Fed is on board with some of the theories about cutting rates and all these different things.
So right now, our T cross long, our critical level, VantagePoint level, 103.79, and multiple other resistance points coming in from 103.93, all the way down to 103.66. The dollar remains bearish, while below this level. I don’t anticipate further dollar strength until towards the end of the month with that known period of dollar strength, which will continue throughout the calendar year, even if the dollar remains below its yearly opening price. Now, our neural index remains bearish. Our predicted differences are pointing down, so no sign of a reversal yet.
Gold
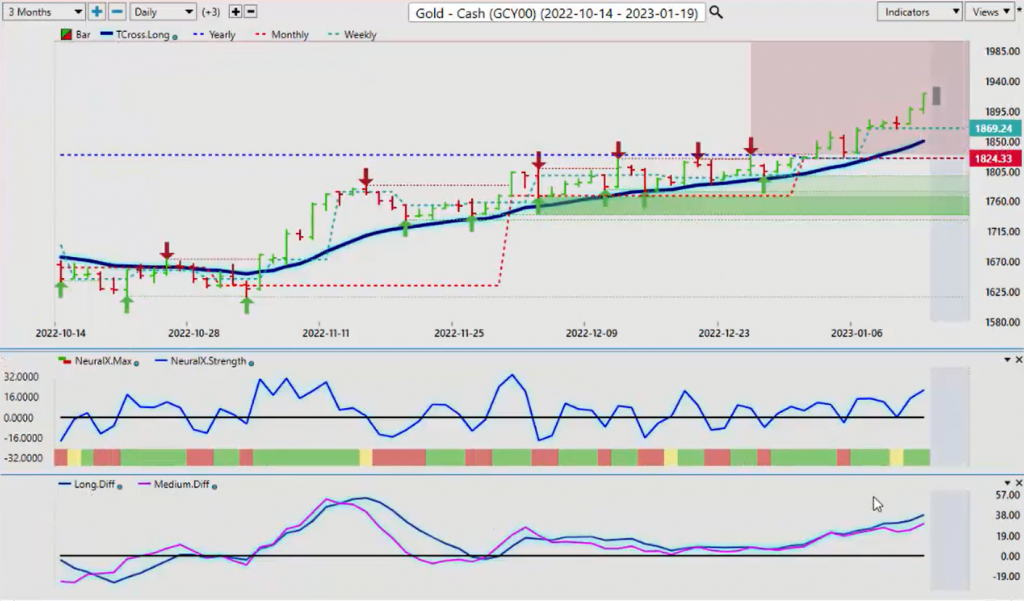
Now, with this dollar weakness, you can see the gold is above its yearly opening price, its monthly opening price, and it’s finishing firmly above its weekly opening price. We can assess here that our T cross long support, 1850. The further we move away from this level, the more likely it is we’re going to retrace to it.
The yearly opening price, 1824, and again, the monthly of course is the same, but a very strong close in the week. In my respectful opinion, regardless of what the dollar does, gold strength is likely to be limited or contained in the first quarter. But we’ll continue to monitor things, we could move … extend higher. But when we look at this, you can see on a year-over-year basis, that gold is normally not that strong at this particular time of the year. Last year with the Russia-Ukraine War, that boosted gold prices. But we can see it going back into 2020. 2021, gold usually is not overly strong at this time of the year. It’s usually not until April that we’ll see gold really start to move higher.
Now again, our key levels and our key indicators, our predicted difference, has crossed down. So, there is some warning sign that gold could be reaching a top here, as early as the latter part of next week. So be mindful of this, if we click on our F8. One of the quick and easy ways to tell that we’re going to see a reversal is we use our long-term crossover or our long-term predicted moving average. That level, 1886. If we start slipping below that, then we’re likely going to target back down into the 18.50 area. But again, I don’t think that’s going to come until the latter part of the month.
S&P 500 Index
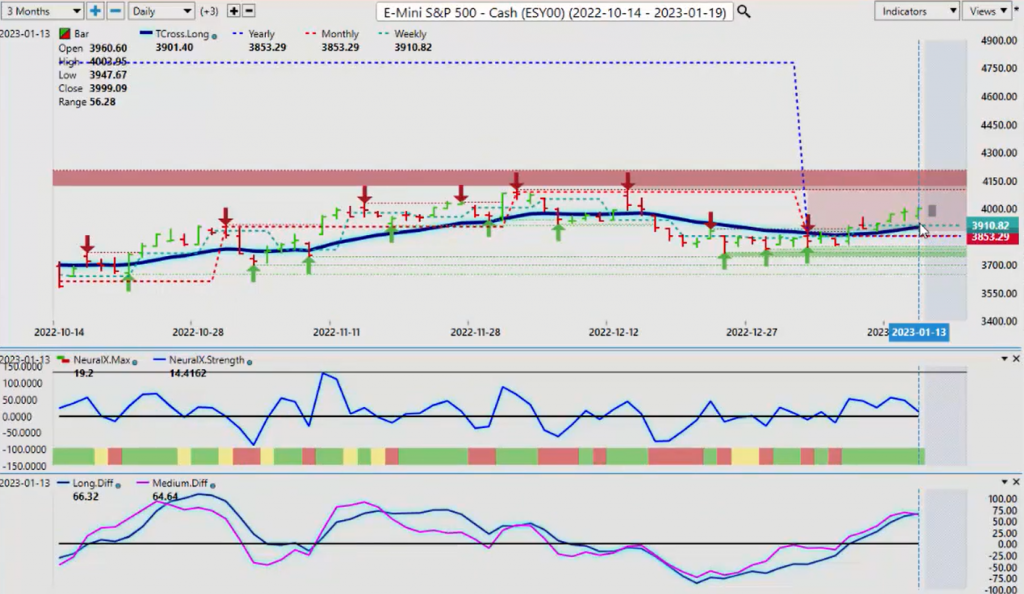
Now, as we look further into this, we look into, of course, one of the main drivers, or the main inverse correlations throughout 2022 was of course, the S&P 500 inversely correlated to the dollar. So, when we look at the S&P 500 right now, there’s optimism here in the stock market. So, far in 2023, stocks are bullish. We remain above our yearly and our weekly opening prices, those are coming in at 1853 and 1910. Our T cross long, 39.01, that is our key level.
Now again, the further we move away from that, the more likely it is we’re going to receive retracement back to this level. We can identify this clear as day throughout the last three to six months in the VP software, the market in constant contact with that T cross long, but that is our line in the sand for stocks, between 3901 and the yearly opening price at 38.53. We need to stay above these two levels if stocks can extend higher. But again, in my respectful opinion only, we’ve only had one full complete trading week this past week because the previous week, holiday short week, the school’s still on vacation. A lot of the bank guys are still out. So, we’ve had one full week. I think it’s very premature to suggest the equities are going to have a great year in 2023, or the dollar’s going to be down in 2023, until we get towards the latter part of the month or the first week or two into February, as some very, very strong seasonal patterns kick in.
Crude Oil
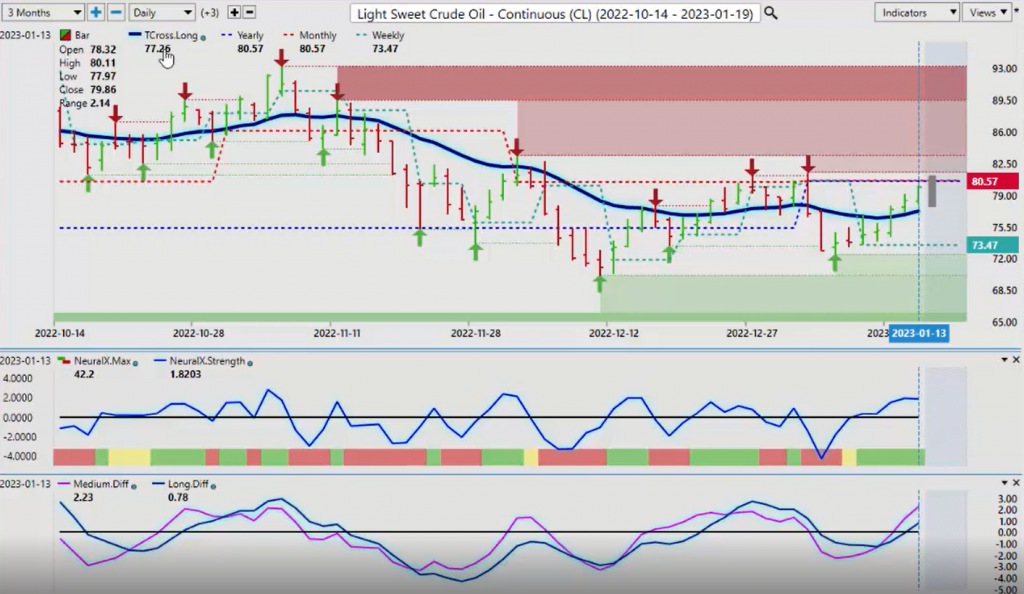
Now, when we look at oil, oil obviously rising with the stock market, but again with oil, we’re still below that yearly opening price, 80.57. We have closed two days in a row above 77.26. The VantagePoint T cross long. This will be our major support level, but we must clear 80.57 if oil is going to remain strong, or even have a good first quarter here. If we’re below the yearly opening price, it is not bullish here, guys. It’s a corrective move higher. So, if we can clear 80.57, we should see oil contracts go higher. But if we enter into a recession, oil predominantly does not do very well.
Bitcoin
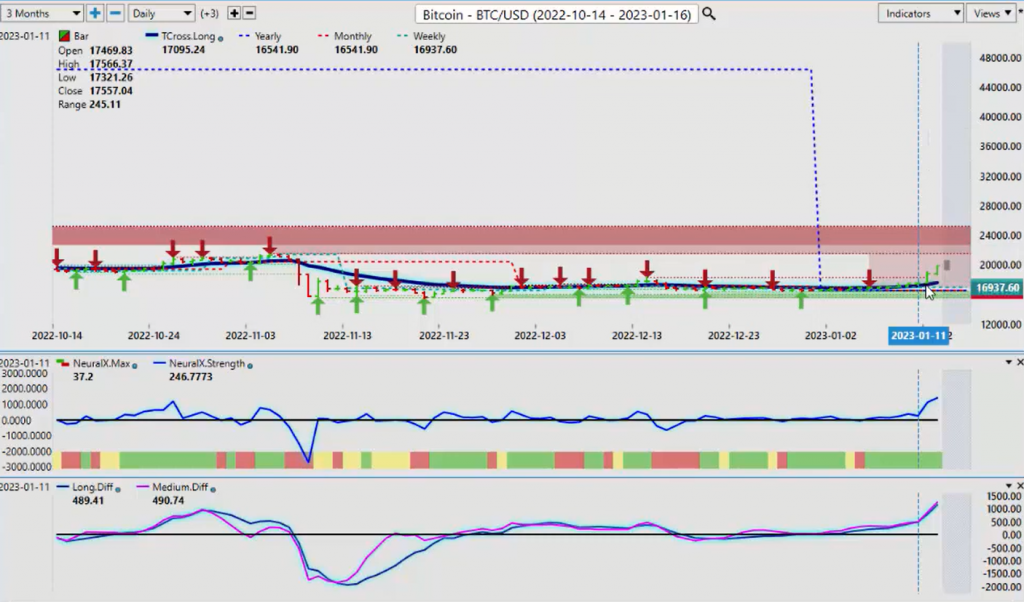
Now, once again, the pundits out there, your Warren Buffetts, and these people that continue to bash Bitcoin, simply cannot see the forest because of the trees. As I’ve said many times on here, Bitcoin is a stock trade. It’s officially listed as a commodity via the CFTC. But the main thing we want to understand is that Bitcoin is moving up and down with your global indexes, more specifically the NASDAQ and the S&P 500. So, Bitcoin already this year, which I really do feel I need to point out because we keep getting false information from these pundits. So, if we look at where we’ve started Bitcoin on the year and we draw a line to where we closed on Friday and we look at this, once again, it’s not hard to see that Bitcoin is again the number one investment so far in 2023, which the same could be said for many other years. I don’t know why that is possibly set to that high, but a single contract on Bitcoin here, very, very easy trade.
As long as you understand and know the correlations involved, and again, the direct intermarket correlation that Bitcoin has is to, positively correlated to, the NASDAQ and the S&P. So, it doesn’t surprise me that Bitcoin’s gone higher, but in order for Bitcoin to maintain these gains, we must stay above the yearly opening price at 16,541 and the T cross long at 17,556.
Euro versus U.S. Dollar
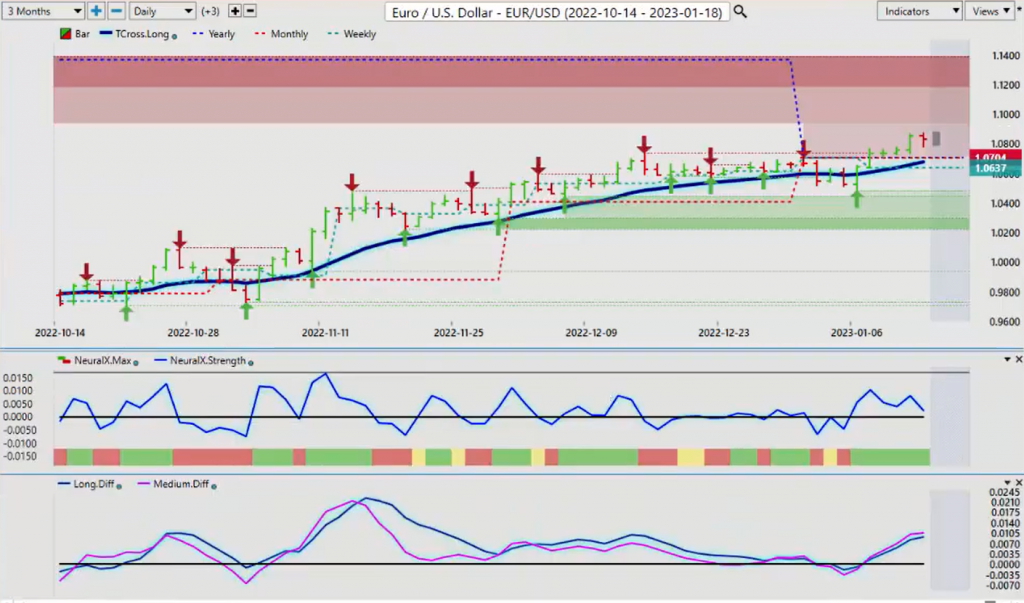
Now, as we go into some of our main forex pairs into 2023, the euro clearly starting the year with a bit of a bullish tend to it, a bit of a bullish bias to it. But again, it’s way too early to make the prediction that the dollar is going to tank in 2023. I believe that a lot of these pundits have got it wrong that they’re putting … continue to put words into the Fed’s mouth that he didn’t say. So, a lot of volatility as we approach the February FOMC meeting. But for now, the euro is holding its gains. But I will point out that the ECB has come out and clearly said hikes are done in June either way. So, that tells me that the upside could be limited here on the Euro.
Right now, we’ve got our neural index strength is pointing down. Our main neural index is green. What we want to watch using our VantagePoint software is this pink line crossing the blue line, the medium term crossing the long-term predicted difference. I believe that will occur in the next week or two as we move towards the end of the month, and either way, the dollar will strengthen at the end of this month. So keep an eye up for potential shorts here, but again, our T cross long 106.77 and our yearly opening price at 107.04, we’re long well above these two levels, guys, easy peasy.
U.S. Dollar versus Swiss Franc
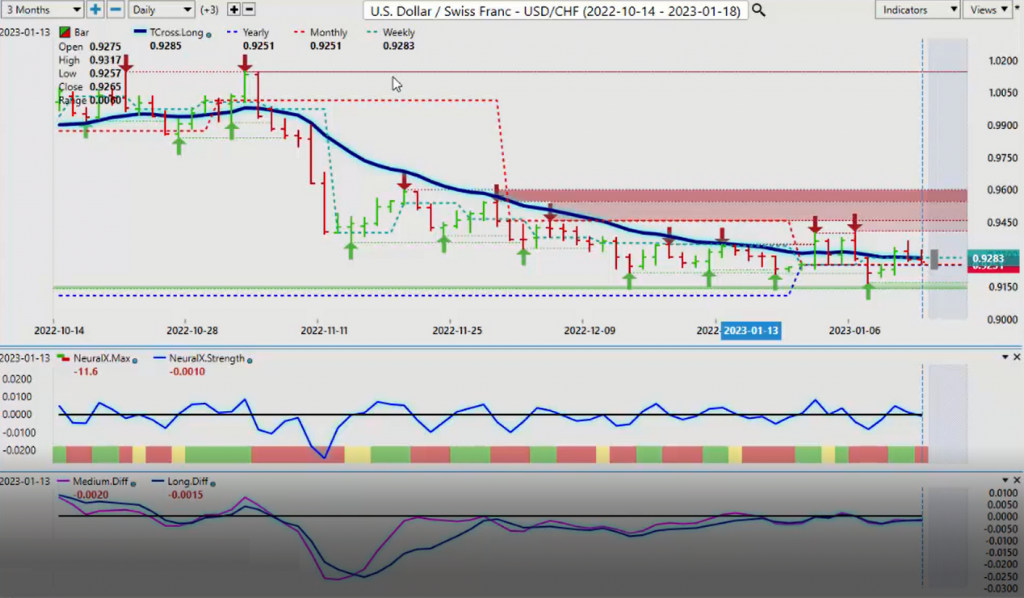
Now when we look at the US Swiss franc, again, if the dollar can turn here, the yearly opening price, 92.51. If we can get the dollar index turning around, this would be a place of value to actually buy dollars here because again, I don’t think the dollar is done just quite yet. I will continue to monitor things, but again, the question remains, what is the Fed going to actually do here? Is he going to say that hikes are coming to an end? I don’t think so. He’s made it quite clear that even if they do come … the hikes come to an end, he’s not cutting. “Higher for longer,” those are the words that the Fed has said. I’m not interested in what some of these other pundits are saying. They’ve been wrong every time to date. So, we focus on what the Fed is doing and what the Fed is saying. So, if the dollar turns around, we could see some potential, very good buying opportunities on this pair. But right now our neural index is down, the neural index strength is down and our predicted differences remain below the zero line. So, until this changes, a little bit more downside before we turn back up.
British Pound versus U.S. Dollar
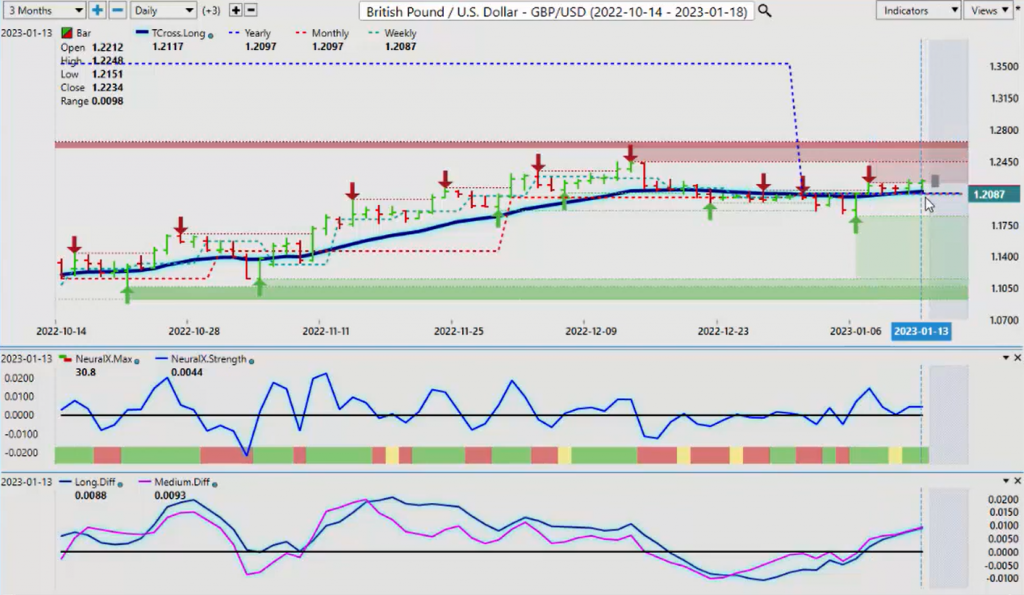
Now, the British pound also, this is again, we’re either buying or selling US dollars. That is the main trade in the forex. Now, the verified zone is providing some resistance at 122.10, but we’re closing above this on Friday. Our yearly opening price, 120.97. We’re long the British pound, while we hold above this level. The VantagePoint T cross long coming in at 121.17. So, all of our support is sitting right here, guys. So, as long as we can stay above that, the pound can extend further. But our medium term and long-term predicted difference is struggling here.
So, we’ve got to be careful here. It looks like a cross is trying to take place. The pink line over the blue line, that would tell me that the pound is losing momentum. Now, I’m fairly confident the pound can move higher for at least another week or so. But again, as we get towards the end of the month, you’re going to see real dollar flows, real dollar buying, that will trump any silly comments from this person or that person. We want to make sure we’re focused on the fact that real money buys dollars at the beginning of the month. So, a little bit more upside, but be very cautious because that signal right here for next week is warning us that the pound is potentially getting ready to move lower.
U.S. Dollar versus Japanese Yen
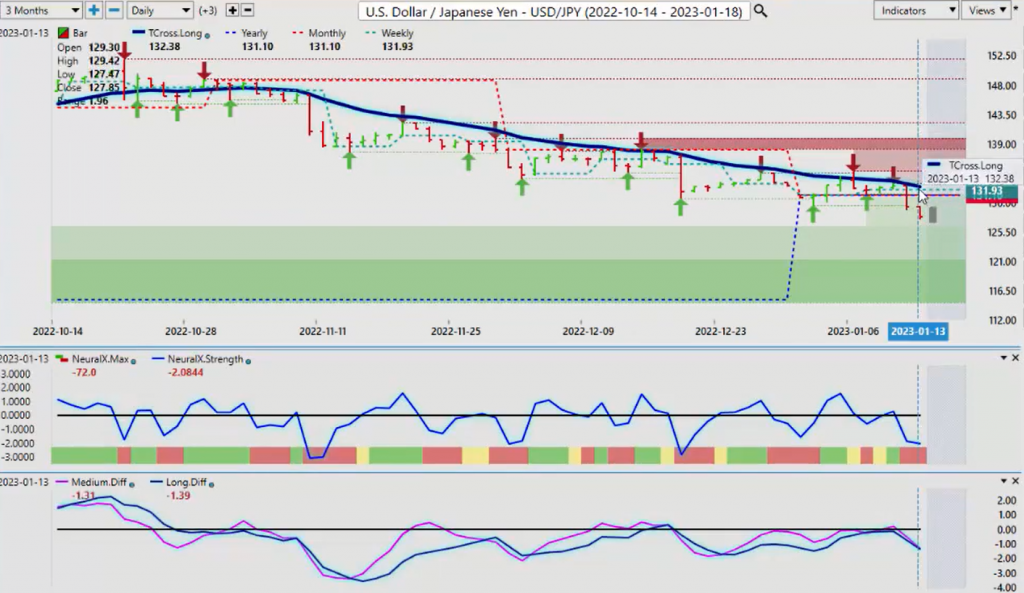
Now, as we look at the dollar-yen for next week, this pair starting the year breaking down below the yearly opening price. So this is where the VantagePoint T cross long using the yearly, monthly, and weekly opening prices come in. So, we have our resistance here. The yearly opening price, 131.10, the dollar-yen pair is bearish while the market is below 131.10. That’s our major resistance point. Then we have our T cross long at 132.38. So, these two resistance points tell us that we’re short while below this level.
My concern here is again, the Fed is higher for longer and no matter what, he’s not cutting. So, this keeps the carry trade alive. So be very, very cautious with this and watch for the VP signals, the turning points, the medium term cross and the long-term predicted difference, the neural index and the neural index strength, positive for say, two days in a row. Then we could be seeing a reversal, but more than anything,, keep an eye on the yearly opening price at 131.10. That’s our retracement point. It’s a very powerful non-indicator at this time of the year.
U.S. Dollar versus Canadian Dollar
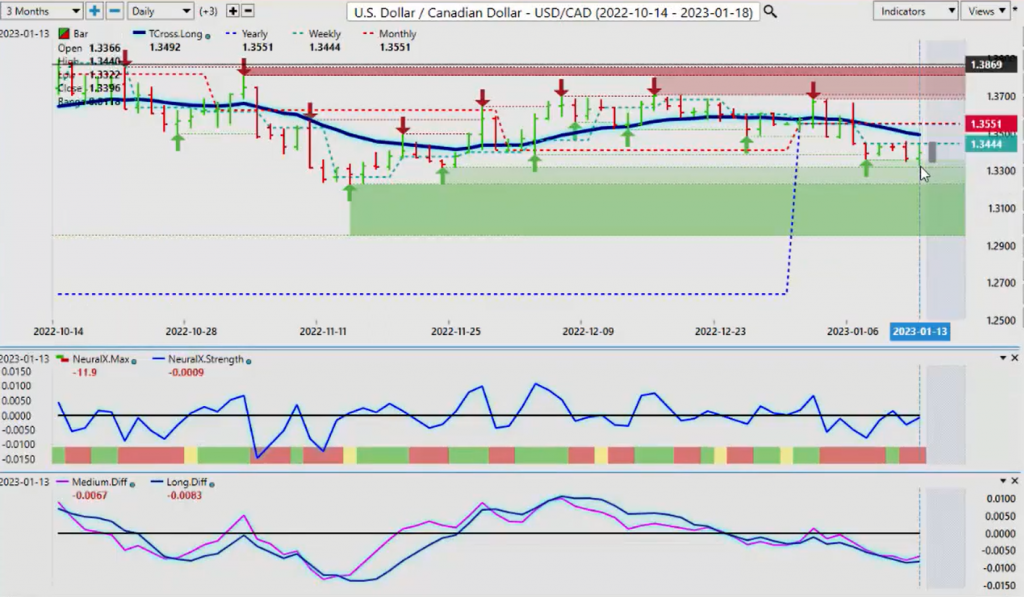
Now, the US-Canadian dollar pair, once again, oil is stalling and as you can see is oil stalls below. Its yearly opening price. The US-Canada has trouble extending further to the downside. So next week, the 133 level is going to be a very significant level to us. You can see we have multiple verified zones down here. 133.16 is a big one. And then we have an even bigger one coming in here, and that’s coming at the low of 132.26. I believe that US-Canada, the only way US-Canada can get down to 132.26 is if the stock market continues higher and oil contracts continue to move higher. I believe both will pause within the next seven to 10 days, as we get closer to the month end. When that happens, US-Canada goes higher.
But that could come sooner if the stock market moves lower and oil comes lower. But right now, we identify those two support levels, our predicted differences, our pink line and our blue line down here are starting to turn back to the upside, warning us we may have a problem down here. So, for next week, be very mindful of these two support levels, 133.16, 132.26. I believe that it will be very difficult for this pair to break down below 133.
Australian Dollar versus U.S. Dollar
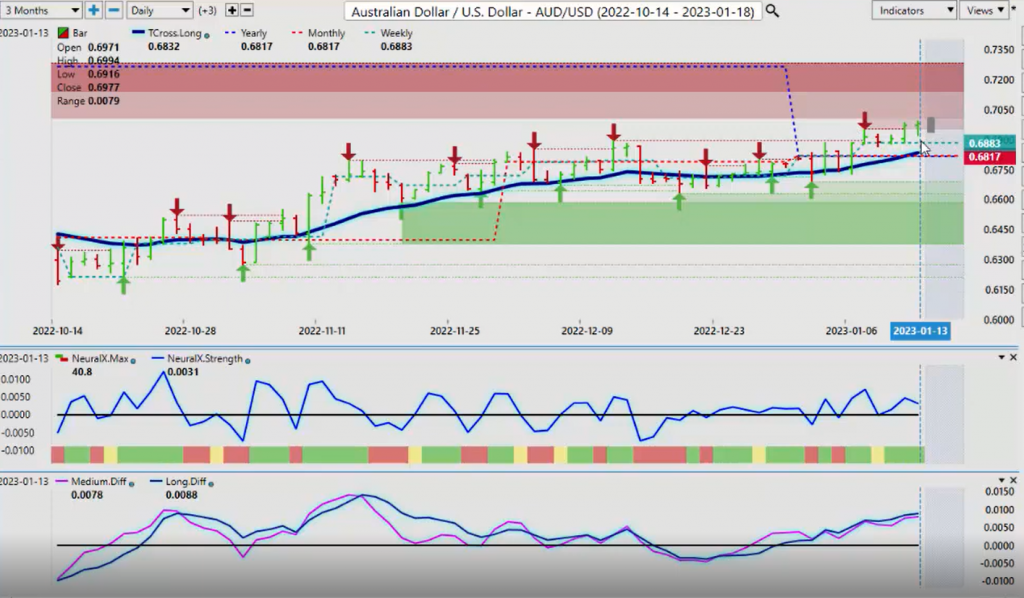
Now, as we look at the US … the Aussie-US dollar, excuse me, for next week. Once again, fully dependent on the stock market moving higher, this is the inner market correlation you need to understand. We can throw a thousand indicators at this particular pair or the US-CAD or the New Zealand-US. It doesn’t matter, it’s dependent on the inner market correlation of the S&P 500 or the global stock indexes. If they don’t continue to move higher, then the Aussie-US will not move higher, nor will New Zealand-US move higher.
New Zealand Dollar versus U.S. Dollar
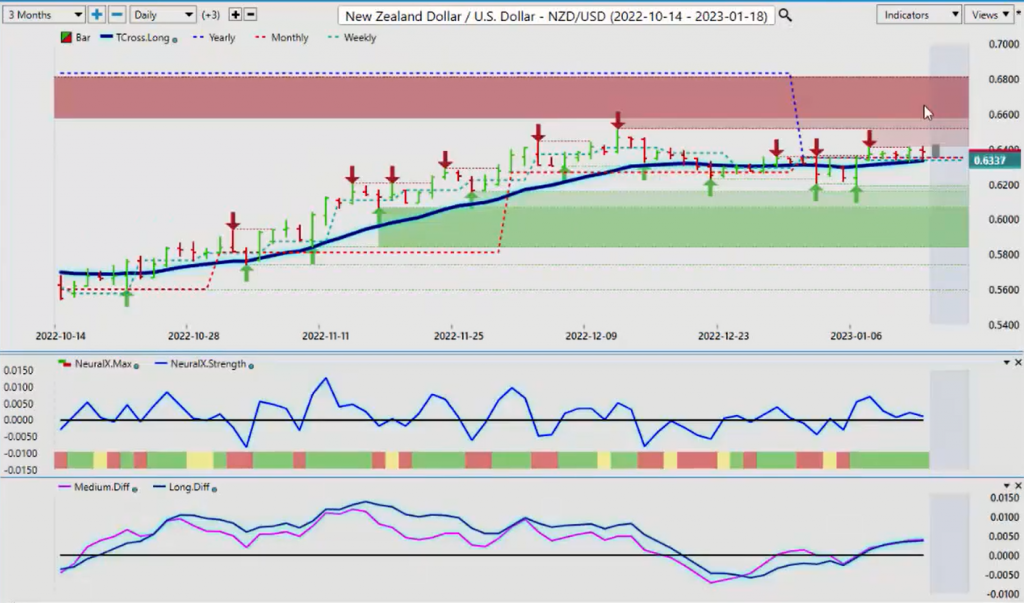
So right now, we’ve still got some buying up here, but the clock is ticking here on dollar strength, pending dollar strength towards the end of the month. So, the indicators are still relatively bullish here, but we’re definitely going to see some headwinds up here. Same with New Zealand. And the New Zealand is not as strong as what the Aussie is. The New Zealand is being contained by a newly formed, verified resistance high at 64.11. So, we need to clear this, but then in my respectful opinion only, we have even stiffer resistance at 65.14.
But neither one of those resistance points will matter if the S&P can extend higher. If we lose ground on the S&P 500, you’re going to see Aussie move lower, New Zealand move lower, US-CAD move higher, pound-dollar lower, euro-US lower. This is the trade, guys. The inverse correlation, the inverse correlation between the dollar index and the S&P 500. So with that said, this is the VantagePoint AI market outlook for the week of January the 16th, 2023 …