


Welcome to the Artificial Intelligence Outlook for Forex trading.
VIDEO TRANSCRIPT
U.S. Dollar Index ($DXY)
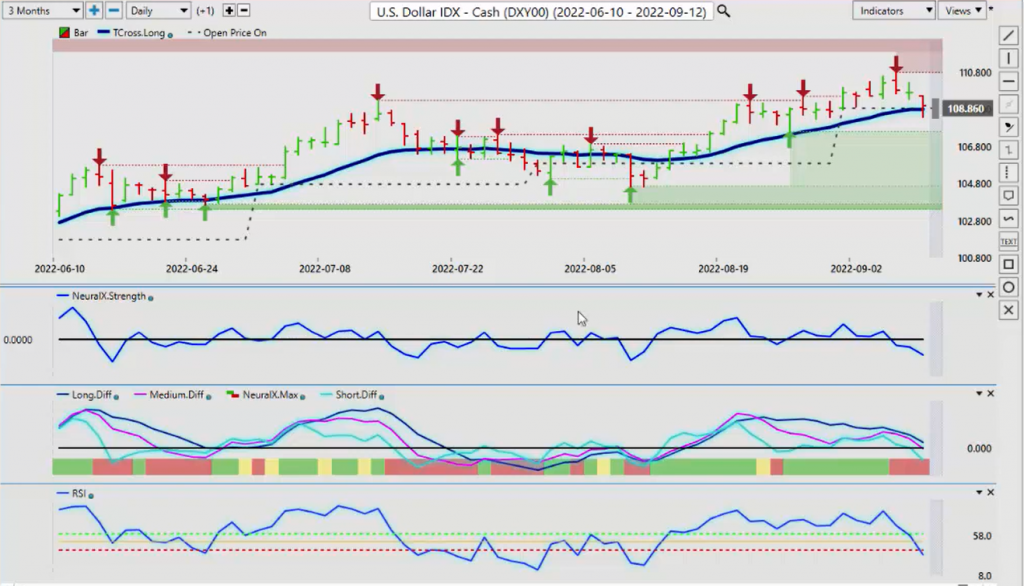
Hello everyone, and welcome back. My name is Greg Firman, and this is the VantagePoint AI market outlook for the week of September 12th, 2022. Now to get started this week, we’ll begin where we always do, with the US dollar index. Now, once again, somewhat of a violent reversal on the US dollar. This is typical between Monday and Tuesday trading with the holiday on Monday, we can see we’ve had an excessive rally on the dollar up to about the 110.34 area, and then down we go. Now the mean revision theory here would be that if we move too far away from the key T cross long, the last several weeks I’ve had everybody focusing on the critical level, whether something is bullish or bearish. The theory is if we’re above the T cross long, it’s bullish. Below it, we’re bearish, so we’ve been holding above it for an extended period of time.
In my respectful opinion, this is a long rally for the dollar from going back to August the 15th. But now coming back in, we’re out of summer trade, we’re into normal trading next week, this holiday, short week from this past week, lots of volatility with the S&P and with the ECB, etc. But again, a lot of this is market noise. When we look at the intermarket correlations, we can see that the dollar is losing ground, but we’ve managed the close just above the T cross long at 108.79. This is the level we would want to watch very, very closely going into the next week’s trading. What I will argue here is that with the dollar cycle, as the dollar is normally strong at the beginning of the month and then it weakens towards the middle of the month, we can see that’s usually around the 15th of the month.
This is a little bit more than a coincidence in my respectful opinion, because we have strong yearly seasonalities, but then we also have repetitive patterns that occur basically monthly with the dollar, and then usually the non-farm payroll number, the dollar softens. So, this is perfectly normal. The dollar does remain in an up trend in the calendar year. But again, can we hold this level? Our neural index strength is slipping. The neural index is down, and you can see that momentum to the downside is actually building, with the RSI breaking below that very important 40 level. So again, we’ll watch this, but be very, very cautious in trading from Monday to Tuesday. In the VantagePoint live trading room, we work on this every single week, this Monday, Tuesday phenomenon of the phenomenon of the market actually reversing whatever it does on Monday. So, the spillover here would tell me that the dollar’s soft again on Monday, but on Tuesday I would be a little bit more cautious selling dollars come then.
Gold
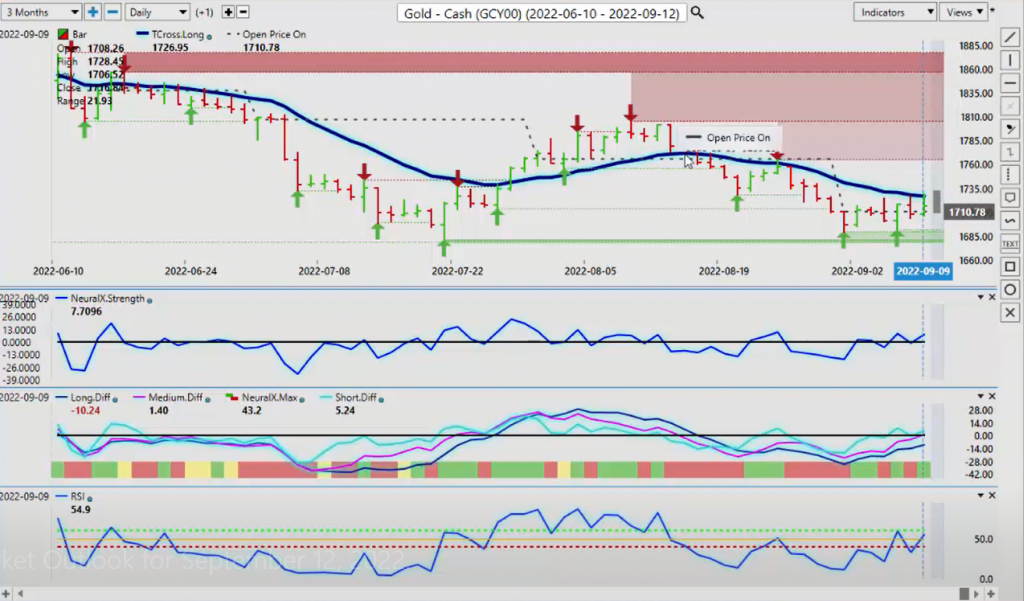
Now, when we look at gold, gold’s getting a bit of a boost here from the dollar, but as you can see, focusing on just the blue line by itself, the T cross long it’s again, not a coincidence that we’re banging into this level, but we’re unable to break it. Even though the additional VP indicators are gaining momentum, we must clear that T cross long. So again, very good short opportunity. I will argue that the dollar, good, bad, indifferent, whatever the Fed does, the dollar is usually strong on a seasonal basis in the month of September and part of October. But the closer we get to the mid-November, the dollar really takes a hit. So, gold still not ready to break out yet, but we can identify that critical breakout point of 1,726. We need to break above this area and close above this area.
Now, what are the positives? This line that’s running through here, this dash is the monthly opening price. That point on open is coming in at 1,710. So again, in the VantagePoint software, when we bring this up and we look at our point in time, you can see that I have it set to the monthly opening price. I’ll then apply that right across the portfolio, and that gives me a bit of an anchor point. I would argue that if we’re above it, it’s technically bullish and we’re below it, we’re bears. So gold is trying to make a push here, but I think it’s very unlikely we go higher, too much higher in the month of September.
Crude Oil
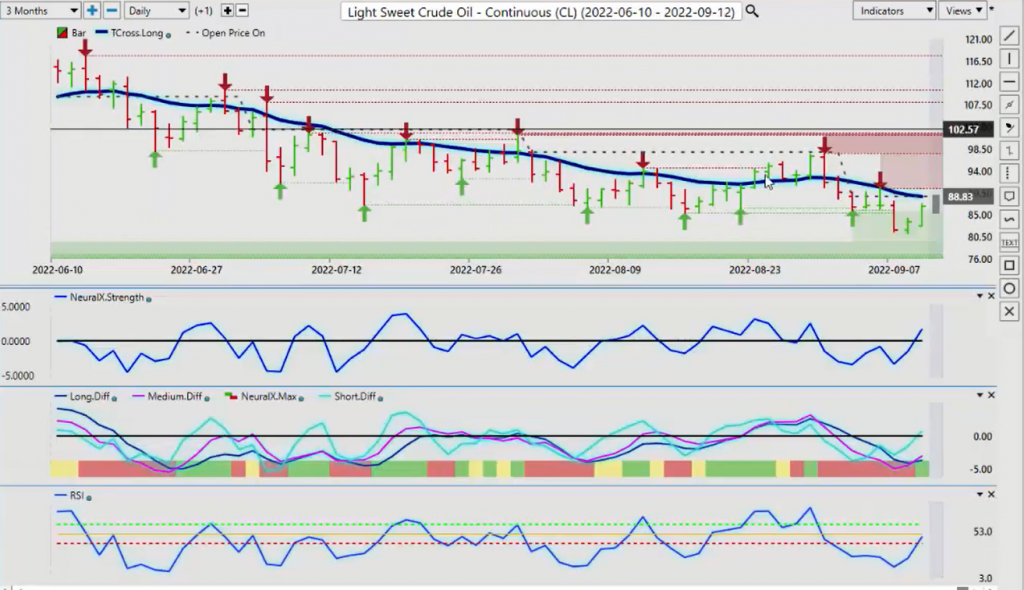
Now with light sweet crude oil, it too remains under pressure. You can see that after the breakdown of the T cross long, we’ve come back up, retraced to it this week. Again, be very careful.
This past week, this is the Tuesday bar I’m showing you, but you can see we rally up on Tuesday only to get pounded lower on Wednesday and basically staying down until Friday. But for next week, our T cross long pivot level is 88.82. As long as we’re below that level, oil remains slightly bearish. Our monthly opening price, 88.83. So all of our resistance is at this particular level. One of the other plays that you can do here is you can straddle this thing. You can sell into the 18.83, then have a buy stop ready to go, say around 89, 89.20, cut the short and go long. That would probably work.
So again, identifying a specific level in the market actually helps with your entry point, your stop loss, and of course your risk to reward ratios. Now with oil, we’ve got our medium term crossing our long term predicted difference with the neural index. This trade setup guys, is very seldomly wrong. So it’s pointing towards strength in oil that could indirectly support dollar weakness. But again, we must clear 88.83 and break free and clear of it, and I would prefer it to close above that level at least two days in a row.
S&P 500 Index
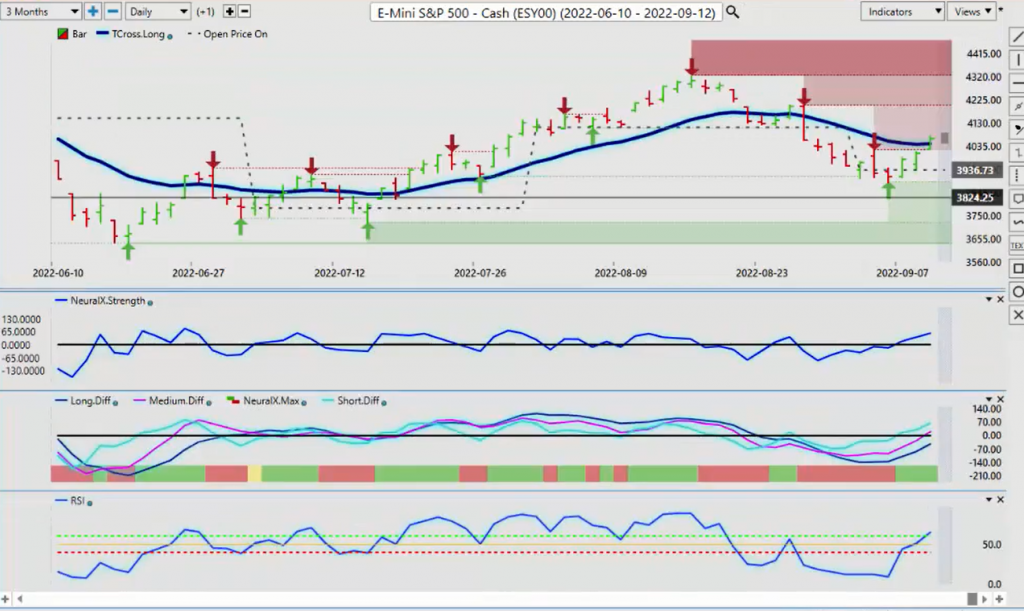
Now, when we look at our S&P 500 going into our stocks, stocks are enjoying a bit of a rally here.
But my view on that would be, any gains are likely to be limited. I don’t think the Fed is going to pivot this month. I think he’s going to stay firm, and he’s going to remain hawkish. Now we’ve closed above our T cross long, but only for one day. So again, be very cautious of a further equity rally on Monday, only to reverse back to the downside on Tuesday. I’ve seen this a lot guys, so be careful. But the indicators right now are bullish, they’re pointing higher, and so we could be making a move towards the high, around the 4,203 area, but I think that would likely contain any rally because again, stocks in the month of September, it’s normally a month where the dollar shines, not stocks. So again, we’ll monitor this, keeping an open mind here, but we need to hold above 4,043 in order for there to be any lengthy rally. And my optimism on that at this particular time remains heavily, heavily guarded.
Bitcoin
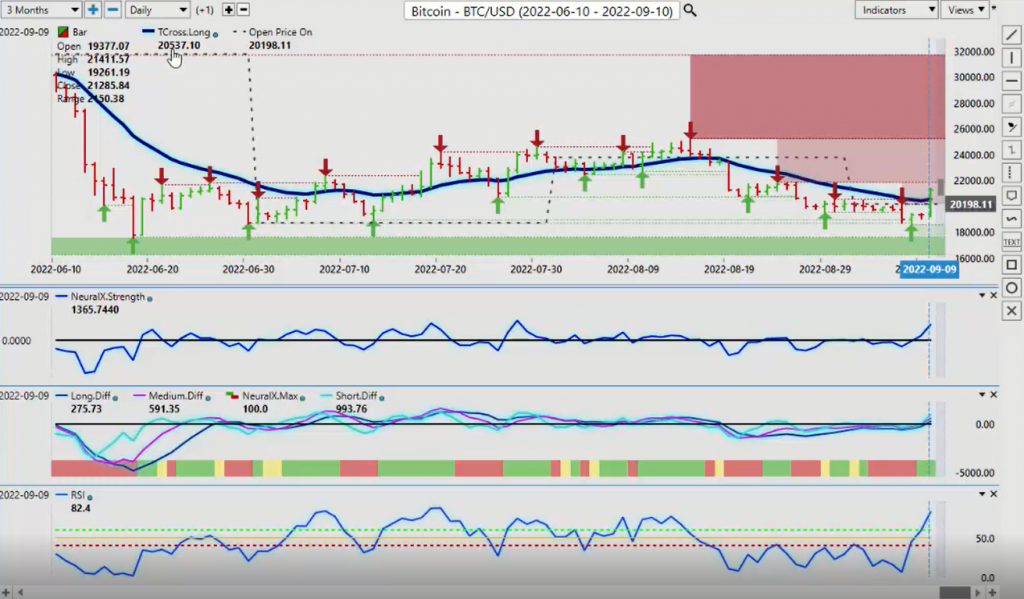
Now, when we look at Bitcoin, Bitcoin will continue to follow the stock market indexes, more specifically the NASDAQ and the S&P 500. So Bitcoin, like the S&P 500, the intermarket correlation here is clear as day. They’re both moving up and down together. So if we can continue to hold above Bitcoin’s key level of 20,537, then we would see further upside. But again, I am not anticipating any real strength in Bitcoin until the end of the month. The seasonal pattern has been clear every year, late September to very early November is one of the premium buying periods for Bitcoin. So again, that would point that stocks could rally, but it would likely not be until the latter part of the month. Now as promised, I will have a quick peek at natural gas, because I think it’s worthy of a look.
When we look at natural gas again, as per last week’s weekly outlook, we did move lower in natural gas, but we’re stalling out down here guys. We’ve got a newly formed verified support low at 7.75, and it’s likely to move higher from there. The indicators are warning of this, the neural index strength, the medium term crossing, the long term predicted difference with the neural index and the RSI is starting to turn. So if nothing else, I would anticipate a mean revision correction move if nothing else, back to approximately the 8.57 level.
Euro versus U.S. Dollar
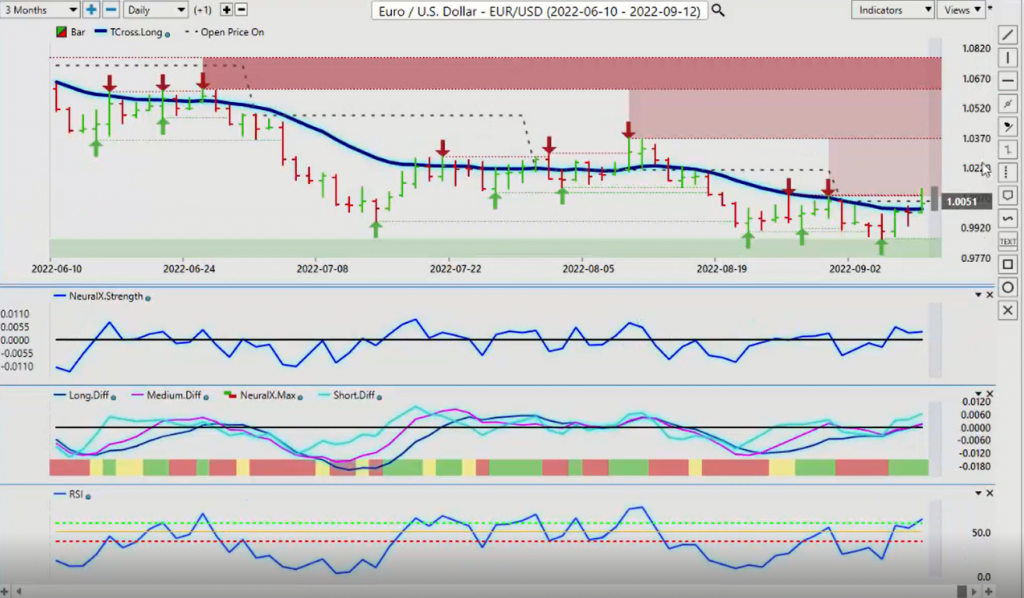
Now, as we look at some of our main Forex pairs for next week, the Euro is enjoyed a bit of a rally with the ECB, but once again, we’re not closing above the monthly opening price. That point in time, 1.0051, very strong verified resistance up to the high at 1.0079.
But this is the one I think the Euro may have a shot at. I don’t think we’re going to get back to 1.0368, but we could see the 1.02 level on dollar weakness this coming week. Now the neural index strength is above our zero line. It’s looking good. Neural index itself with the MA diff cross and the RSI is showing momentum. But again, the Eurozone has a lot of issues here, guys, a lot of which were not just brought on by Putin. So, that’s a whole nother debate. But for now, we have closed above the T cross long. That key level is just at about the parity level. Now, if the Euro is going to extend higher, it likely would be next week, because again, we see that pattern of dollar weakness around the 15th of the month. So if we can hold above that, the Euro could extend its gains up another maybe 150 pips or so, but I believe the sellers will still be out in full force, just prior to the Fed announcement this month.
Now, the US-Swiss franc again showing a similar pattern here guys. When we back this up, I’ve discussed this many times on this weekly outlook that you see a pattern in the market where it happens more than once around the 15th of the month, where this pair mysteriously sells off. So again, it’s up to its old tricks. Again, here I believe we’re probably going to extend a little bit lower with this, but again, a very, very high correlation to the dollar index. If the dollar index turns back to the upside, this pair will immediately follow. So knowing that intermarket correlation is half the battle. The indicators right now, however, are saying we are extending lower. We’ve got a verified support low, that coming in at 95.78. So keep a close eye on that. If we lose that level, then we would look to target potentially the bottom end of this range down at about the 94 level.
U.S. Dollar versus Swiss Franc
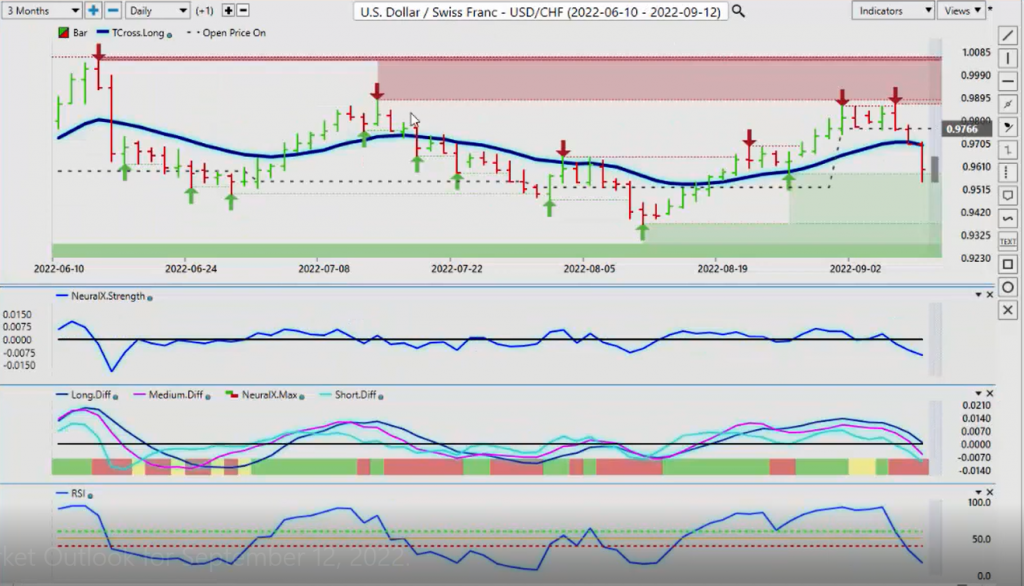
Now, the US-Swiss franc again showing a similar pattern here guys. When we back this up, I’ve discussed this many times on this weekly outlook that you see a pattern in the market where it happens more than once around the 15th of the month, where this pair mysteriously sells off. So again, it’s up to its old tricks. Again, here I believe we’re probably going to extend a little bit lower with this, but again, a very, very high correlation to the dollar index. If the dollar index turns back to the upside, this pair will immediately follow. So knowing that intermarket correlation is half the battle. The indicators right now, however, are saying we are extending lower. We’ve got a verified support low, that coming in at 95.78. So keep a close eye on that. If we lose that level, then we would look to target potentially the bottom end of this range down at about the 94 level.
British Pound versus U.S. Dollar
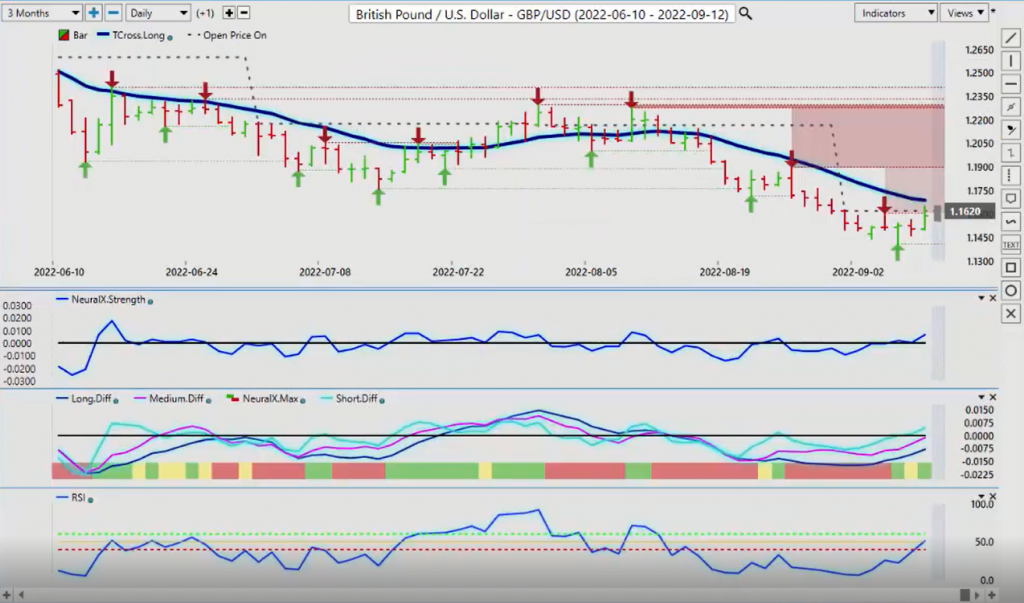
Now, the pound dollar, again as discussed in last week’s weekly outlook, heavily, heavy support down at the 1.14 level. Now, if we lose the 1.14 level, that’s going to be a very gray area with this. There’s some analysts are talking parity on this. I’m not in that camp at the current time, I think the UK is starting to turn things around. They’ve got a new parliament, or a new prime minister. Old Boris is out, so we’ll see where things go here. But again, this verified support low at 1.1405 is a much bigger number than most people know. If we break down below this level, we could have a massive stop loss hunt below those levels, taking it down maybe another two or three cents down to the 1.12, 1.1250. But at the current time, the VantagePoint indicators are saying that we’re looking pretty good for a continued correction move higher, but we must clear 1.1684, guys.
The T cross long, our monthly opening price, also sitting there at 116.20. These are two critical levels of resistance. If we can clear that, we have the possibility of extending, maybe considerably higher. I don’t know if we’ll get back up to the 1.20 area, but I think at the very minimum, the 1.18, 1.19 area could be in play. Interest rates will play a part too. The UK, the Bank of England has put off their hike announcement, or their policy statement announcement until, I believe the 23rd. So, we’ll see where this goes. But right now we’re still looking higher on this particular pair.
U.S. Dollar versus Canadian Dollar
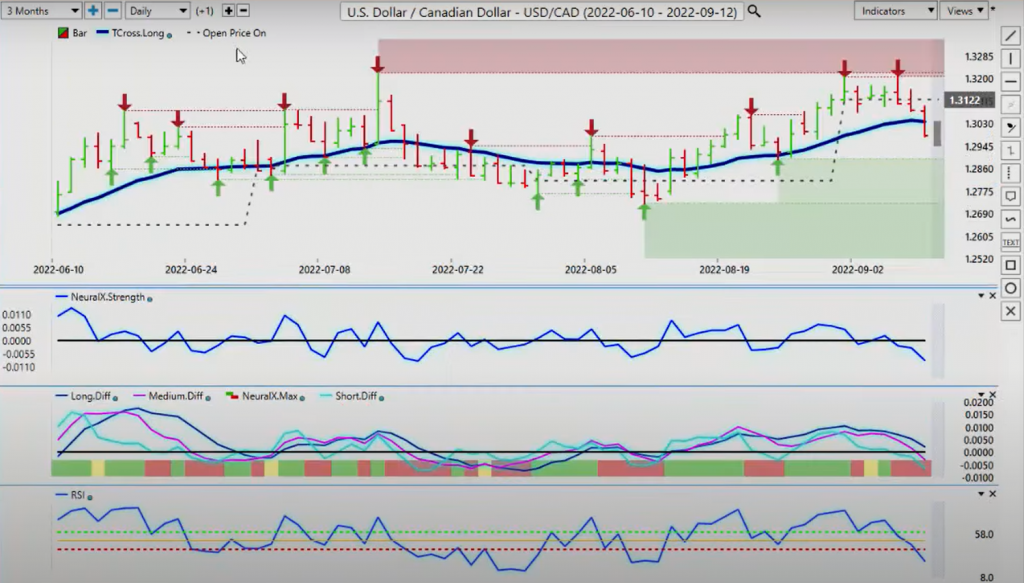
Now with the US-Canadian pair, this pair drives even the best traders crazy. Another one that is notorious for the Monday Tuesday reversal, and you can see it here again, I can only warn you guys is what I can do.
In the VantagePoint live room we do this every week and 90% of the time, whatever US Canada does on Monday, it does the exact opposite on Tuesday. It’s quite the phenomenon. So right now you can see last week, it did it yet again. Now we’ve closed under our T cross long, but this thing needs to keep moving below 1.3037. Right now that that is where our key level is, our monthly opening price, 1.3122. So it’s technically bearish while below these particular levels, and it appears it does have room to extend. So this points towards potentially oil longs, natural gas longs, maybe indirectly gold longs, too. And not only that, but the other intermarket correlations that fall into this are of course the S&P 500 and Bitcoin. So, it’ll be very interesting if this pair continues to extend lower because there are numerous other markets that will benefit from that.
Now, the Aussie and the New Zealand, they fall into the same category here, but the Aussie is unable to break the VantagePoint critical level of 68.49. The indicators are warning that it’s ramping up for a breach of this area. So, one of the ways you can play it is, have buy orders ready to go above the T cross long at 68.49, probably around 68.70, 68.66. If we can break through there, we can extend higher. The indicators are saying yes, but again, this is still pointing to a corrective move, not a new trend. So be very cautious with it. The same thing would apply new to New Zealand. It’s challenging that VP level at 61.35, but it must get moving here quickly. The Aussie, the New Zealand and the CAD, they all fall into a similar category here, guys. They need stocks going higher. They need some of the commodities going higher. Also, if they don’t get that, then of course they too will sell off. So what that said, this is the VantagePoint AI market outlook for the week of September the 12th, 2022.
Australian Dollar versus U.S. Dollar
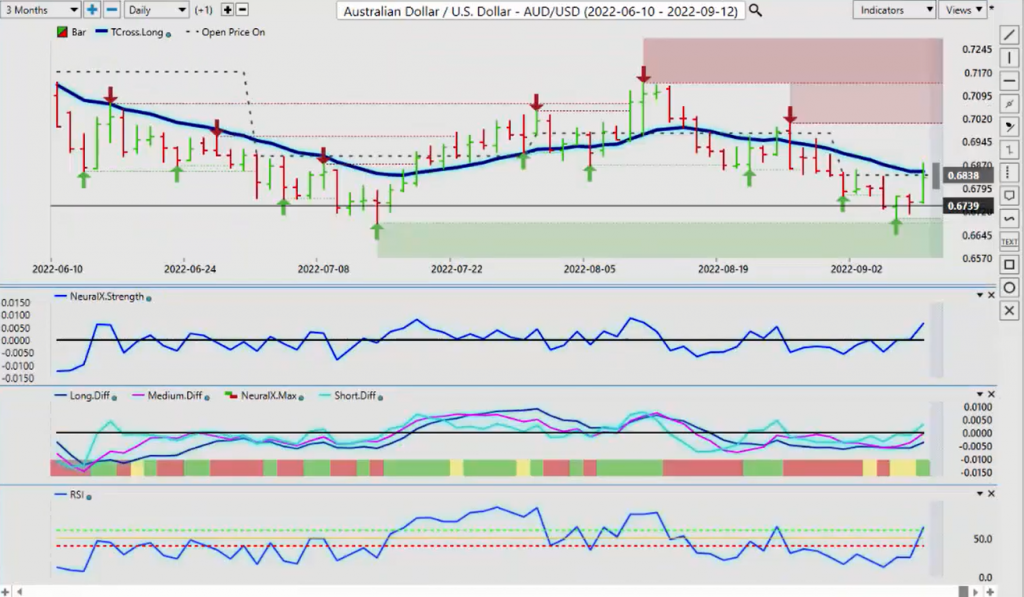
Now, the Aussie and the New Zealand, they fall into the same category here, but the Aussie is unable to break the VantagePoint critical level of 68.49. The indicators are warning that it’s ramping up for a breach of this area. So, one of the ways you can play it is, have buy orders ready to go above the T cross long at 68.49, probably around 68.70, 68.66. If we can break through there, we can extend higher. The indicators are saying yes, but again, this is still pointing to a corrective move, not a new trend. So be very cautious with it
New Zealand Dollar versus U.S. Dollar
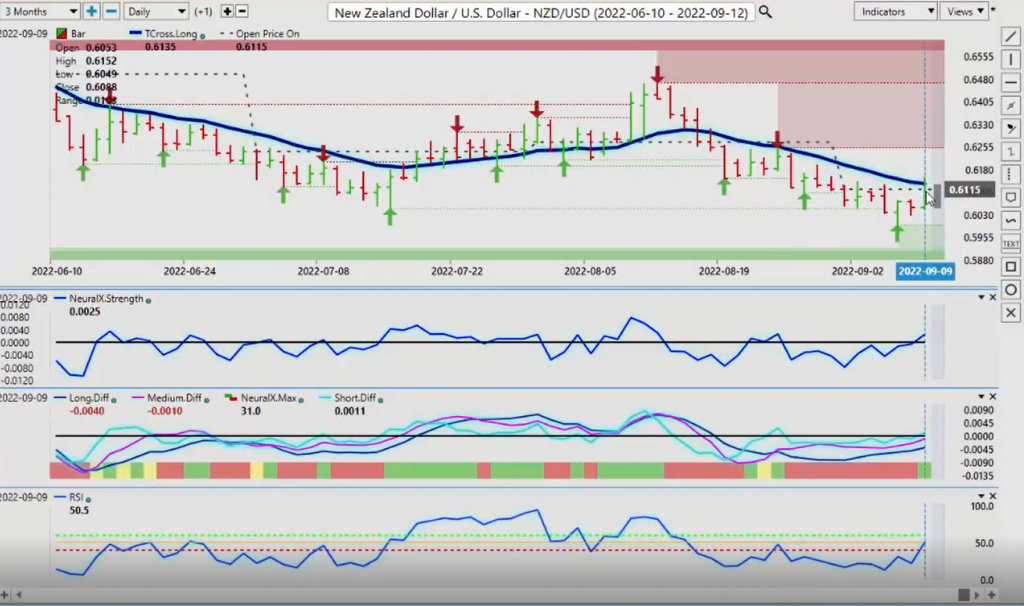
The same thing would apply new to New Zealand. It’s challenging that VP level at 61.35, but it must get moving here quickly. The Aussie, the New Zealand and the CAD, they all fall into a similar category here, guys. They need stocks going higher. They need some of the commodities going higher. Also, if they don’t get that, then of course they too will sell off. So what that said, this is the VantagePoint AI market outlook for the week of September the 12th, 2022.


