


Welcome to the Artificial Intelligence Outlook for Forex trading.
VIDEO TRANSCRIPT
Hello, everyone and welcome back. My name is Greg Firman, and this is the VantagePoint AI Market Outlook for the week of October the 11th, 2021.
U.S. Dollar Index
Now, to get started this week, we’re going to begin where we always do with that very important U.S. Dollar Index. First of all, we will look at the indicators we’re using this week. 37-week lookback, we’re using bars, not candles, predicted short, medium, and long-term difference with the Neural Index, point in time, the triple AMA cross, and, of course, the very, very popular verified support and resistance zones.
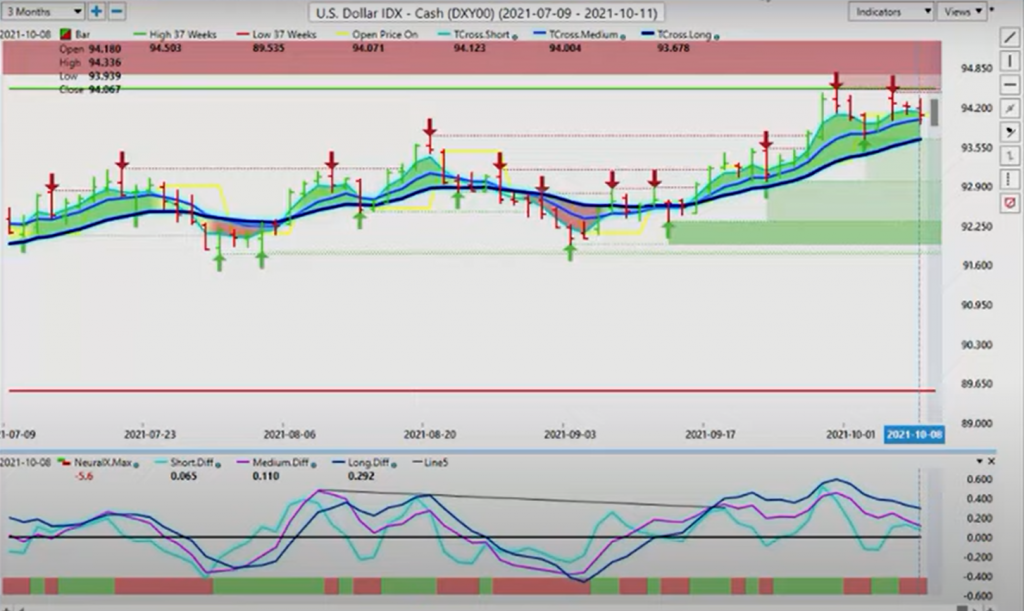
Now, coming off the nonfarm payroll number, the dollar remains locked in a very, very long-term channel here. Now, again, when we hear these headlines about how bad that U.S. unemployment report was, it’s just simply not factual. The U6 number is moving in the right direction. The unemployment rate is moving in the right direction. The household survey number, the U3 number, was less than expected, but that number is likely going to be revised upwards next month. So it does leave the dollar somewhat holding its strength and that’s coming out in the VantagePoint software.
Now, when we look closer at this, the main strategy, because again this is an outlook, not a recap of something that already happened, when we look at this, we can see that our support zone is the T cross long. That determines in the VantagePoint software whether we’re long or short, whether it’s bullish or whether it’s bearish. We also use the point in time for the weekly opening price and the yearly opening price. The yearly opening price, the dollar is firmly above its yearly opening price, but it can’t seem to break this channel. So we always want to make sure we’re going back so we can see the bigger picture here.
Now, that bigger picture has resistance between 94.30 and 94.70, which I’ve discussed for approximately the last three weeks. These levels to date have still not been broken. Now, an easy upside target would be 97.80, if we can clear this. But again, you can see this dark red ominous cloud moving lower down, blocking the index from moving up. Now, that’s not to say that it won’t because, again, I will make that argument that some of the pundits are misinterpreting that particular labor report. The average hourly earnings are decent. Again, that U6 is very strong and the unemployment rate dropping. So again, what it’s going to take to break this channel is a catalyst. Now, we could get that catalyst coming this week with the Fed minutes. It’s possible. But again, in order for the dollar to extend and break out of this channel, we must break free and clear of the 94.80 area. And right now, that appears to be a tall order.
So we would look closer at the VantagePoint software to see where the dollar actually is. Now, as the dollar has been moving kind of sideways up near the top of the yearly high range, our predicted differences are still moving downward. The slope of the predicted differences are warning that there’s not a lot of strength here. So the Neural Index has picked up on that. But again, this is Friday after the nonfarm payroll number. The dollar is still holding close to its weekly opening price. It’s closing almost exactly where it started.
Now, what we can do is, again, look at these advanced strategies so we have some idea what’s going on here. If we click on our short-term crossover in VantagePoint, we’re struggling up here to get a clear signal of this. When we click on our F8 we, or our F7, excuse me, our medium-term crossover is still not crossed to the downside. But again, when we’re looking at these predicted differences, it’s measuring the long-term trend against the medium-term trend. And that is still saying, okay, there’s not a lot of momentum here. So we could get this momentum after the nonfarm payroll number. But when we look at our F8, our predicted moving average by ourself, we can assess here that on Tuesday we moved back up above the predicted moving average. And you can see how this is being used as a pivot level.
Now, again, we’re closing right on that long predicted. So the dollar really does need to make a move here soon, or it has that risk of a substantial selloff. But there is also a substantial risk of a breakout to the upside once the market actually digests or real money digests that labor report. And they could look at this and say, okay, the Fed is getting ready for takeoff here early. They’re going to end the bond tapering program next month, and we could be looking at a much earlier rate hike, maybe even February or March. So the minutes will be key this coming week.
S&P 500 Index
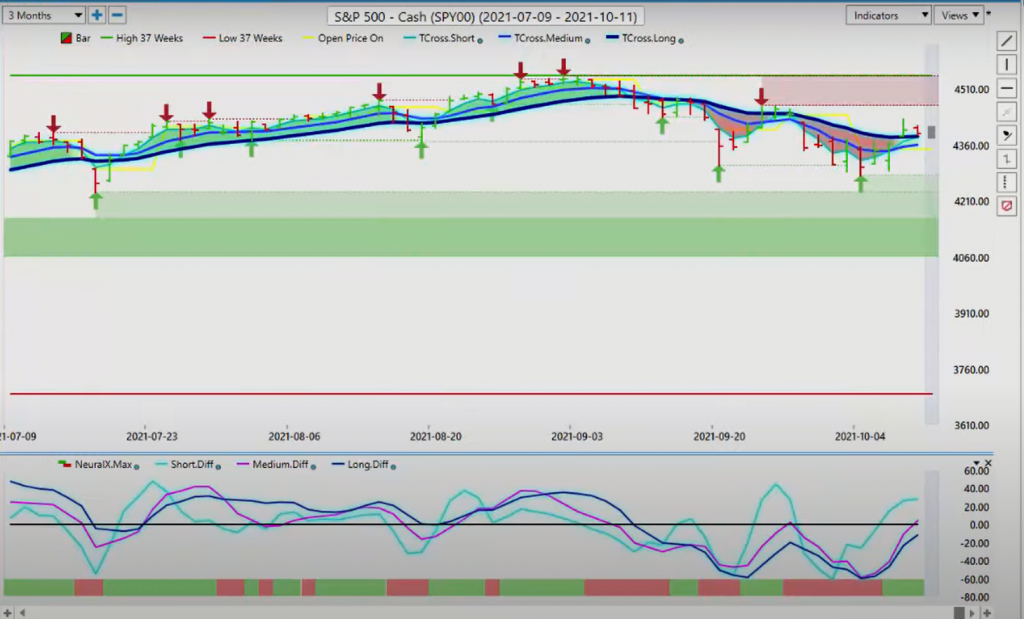
Now, that’s put pressure on the equity markets this past week. But as we can see, as I had spoke to in last week’s weekly outlook, that buying on dips has been a very profitable thing with the global indexes, mainly the U.S. indexes. So the S&P 500 on Thursday has moved back up above the T cross long. So 4,383, our T cross long is now a very, very strong level. You can see that this move actually started back here as the predicted differences crossed and started moving higher. The Neural Index started to turn green way back over here. Then the market made its move. These are the kind of moves we want to look for going forward.
So looking at next week, I’m monitoring the NASDAQ very, very closely. Again, some of the pundits saying, oh, the NASDAQ, not the place to be, the NASDAQ stocks are going lower because of the Fed. Well, in actual fact, when we look closer at the NASDAQ here, we’ve got a low coming in at 14,178. We hit that. That’s going back, by the way, using the verified support and resistance zones, that’s going back to July the 19th of 2021. So when we look at it right now, the NASDAQ has come down to almost that exact same level, and then our predicted differences here started rising. The short- term predicted difference really shot out way back here. So as the market was moving lower, we had the divergence on that short-term predicted difference, but then the medium and long term they started to roll over long also. Then our Neural Index came on board and you can see that there’s very, very little lag in a setup like this.
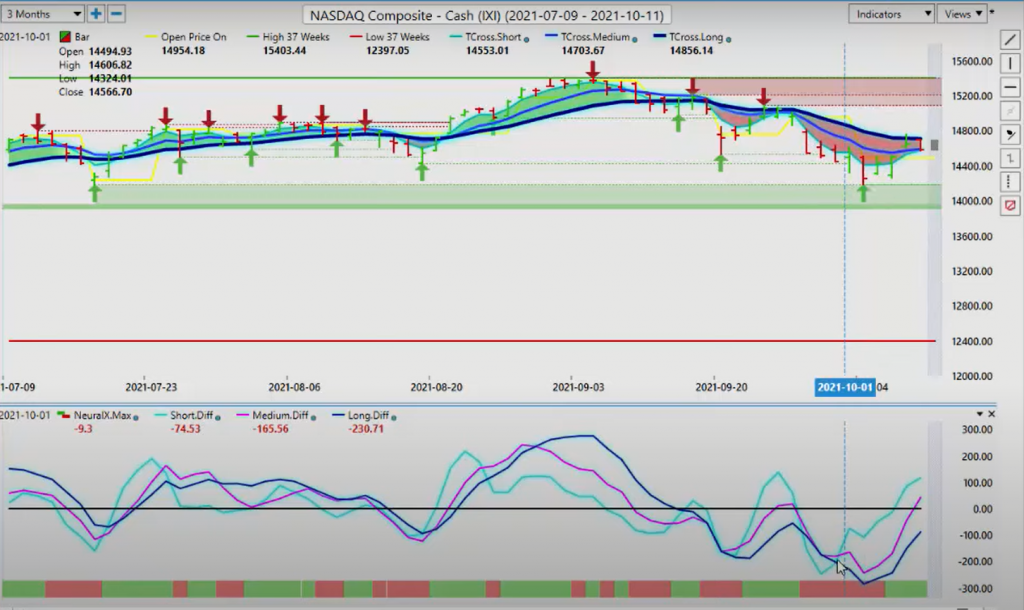
Now, the problem is is what I had just mentioned, determining the primary trend. Are we above or below the T cross long? Now, the S&P 500 and the NASDAQ are about 90% correlated. The S&P has already moved above the T cross long. So the only thing stopping the NASDAQ from recovering further is that T cross long at 14,711. So we want to watch this level very closely.
When we start backing up a little bit here, when we look at this, we can see that our short-term crossover in VantagePoint, that has taken place days ago. And right off that verified support zone, I could argue that one could take the chance and buy off of that because we can see that our short-term indicators, when we utilize a number of the predicted indicators in VantagePoint we do more of a complete analysis and we can see these moves before they actually happen, so that short-term crossover is actually quite effective. But once again, when we look at that verified support zone, one could buy off of that level alone, and then look or just simply wait until the Neural Index turns green. That led to a fairly substantial move to the upside. But once again, we’ve got to clear that T cross long. That is stopping it.
But right now, we’ve closed above the long predicted. That level was coming in at 14,540. We’ve closed right on the T cross long at 14,573. Now, bit of a concern that I have here is that a number of these pundits have misinterpreted that labor report and they’re focusing on the U3 number. If you look at the U3 number, yes it’s a big miss. But the U3 number is a moving target here, guys. Last month’s was revised. And when we go into the nonfarm payroll next month, in November, the U3’s likely to be revised up again.
The U6 is not revised. It’s a solid number, and it’s moving in the right direction. That’s why the unemployment rate dropped so much because the U6 number did, the broader unemployment. So this could benefit, it could benefit the dollar. That’s the problem. If the dollar breaks through that particular channel that I showed you between 94.70 and the yearly opening price down in that mid-89 level, then that would likely have a very negative effect here. But again, when we look at the NASDAQ from a predicted standpoint, we have a fresh crossover that is just taking place, but it’s right on or just under that T cross long. So in order for this to progress, we must clear above that. But potentially some very good buying opportunity on the NASDAQ, depending what that Dollar Index does.
Now, if that channel on the Dollar Index can break, then that would mean that gold would be getting ready for a bigger move to the downside. But again, I’m not convinced. For every one positive in buying U.S. dollars, there’s two negatives. That’s the problem here. You’ve got the debt ceiling. You’ve got the printing presses running at full steam ahead. That’s not going to deter us necessarily because other countries are doing the same, but we still need to be mindful of that. So right now, gold responded, in my respectful opinion only, properly to that unemployment report. It actually took a big spike up, but it closed the day in negative territory.
Gold
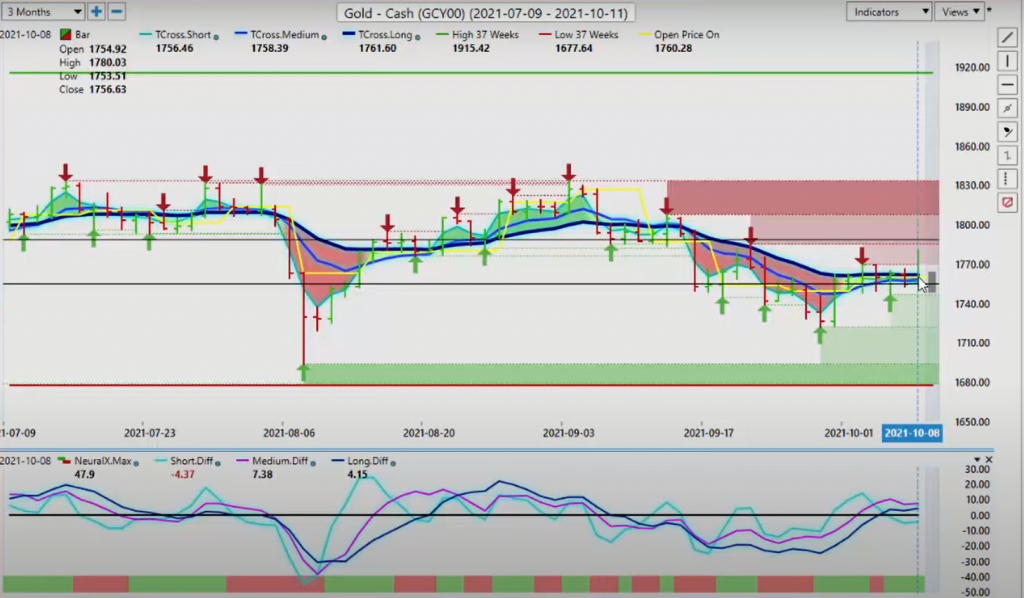
Now, gold’s arch nemesis, in my opinion only, is no longer just the dollar. It is Bitcoin. And we’ll go to that one in a minute. But right now, with gold, we are closing the week here, you can see we’ve closed at 1,756. And again, that T cross long 1,761, that’s the needle in the haystack potentially that we’re looking at, looking for, excuse me, that there is still life in the dollar here and that is not a great thing for gold. Now, our predicted differences are holding above the zero line. Our Neural Index is green. So again, we need to see how the market is going to digest a very, very important payroll number.
Bitcoin
Now, again, when we look at Bitcoin, Ethereum, some of these digital currencies, once again we’ve again taken out another resistance high at 52,902. When we look at Bitcoin, once again the number one investment in 2021 again. A close second I would argue over on an annualized basis over the last 10 years is the NASDAQ, is number two with 20% annualized returns over the last 10 years. But Bitcoin annualized returns over, again, the last 10, 11 years, 230, 240% per year, guys. So if somebody’s telling you that Bitcoin’s a scam or it’s this or that, the charts are not in support of that statement.
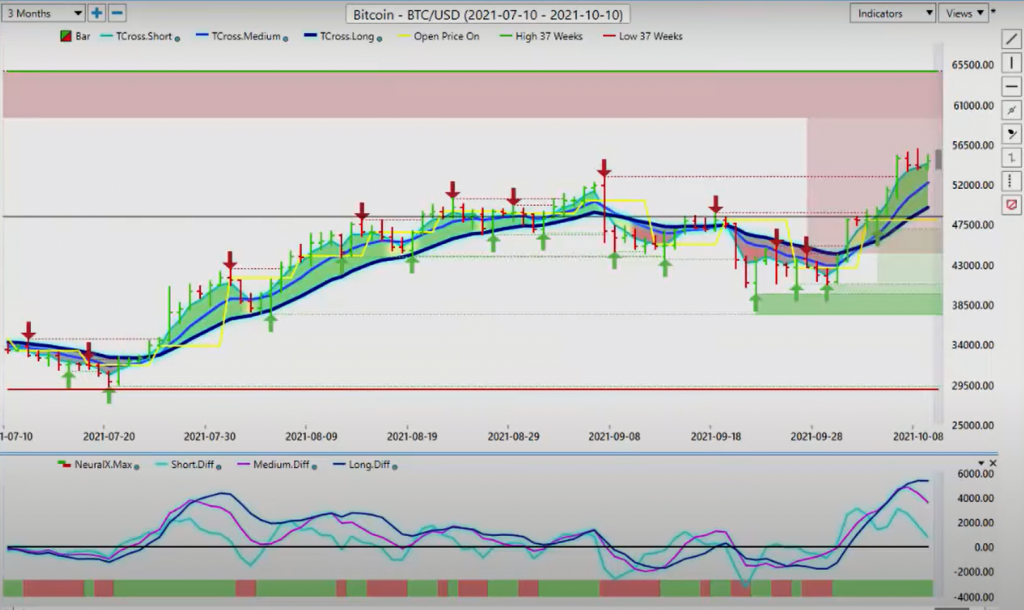
So again, when we look at this, we’re getting a pretty broad spread away from that T cross long at 49,456. So we want to be careful because, again, we have that medium-term crossing the long-term predicted difference. Now, when we’re looking at a complete analysis using some of the predictive indicators in VantagePoint, the pink line represents the medium-term crossover and the strength of it. The dark blue line represents the long-term crossover and the strength of that. So the theory here is the medium-term crosses over the long term to the downside. That’s saying that this trend up here is weakening a little bit.
It doesn’t mean it’s a trend reversal, but it points towards a corrective move coming to, likely down to one of two areas, which would be 49,456, or if we click on our F8, we can get much, much closer to price using that lone-predicted moving average by itself, removing the black line. That blue line is coming in at 53,243, which you can see is right there. When we put it on our bar, VantagePoint gives us an exact number of that predicted moving average. This blue line has the correlation to approximately 31 other markets when it does its forecast of this blue line. The slope is still strongly up, but again we would need to hold above 53,243. And I can’t rule out some dollar strength because, again, I believe the pundits on Friday are misinterpreting a large part of that rather decent unemployment number.
Now, when we look at some of the other additional markets because, again, this outlook is primarily focused on futures and currencies, and we bring stocks into that using the stock indexes, remember there’s safety in the stock index futures where the individual stocks can be very, very volatile.
Crude OIl
Now, when we look at energy, again a large part of this move in energy is coming from China buying up energy, buying up coal, buying up natural gas, buying up oil, buying up everything. And of course, we’ve got supply shortages.
So this is all likely, inevitably transitory. I hate to say it, but I almost have to agree with the Fed on this one, that we would be very, very cautious continuing to buy this. We would watch these VantagePoint indicators very, very closely, but for now they’re still strong. It’s still saying we’ve got a little bit more upside here. When we back out our charts again, before you ever take a short-term position, you always want to look at the long-term picture. So when we look at that long-term picture, at least from last year, oil really didn’t do that well at this time of year. When we go back, again bringing in seasonalities into this, oil the previous year didn’t do too bad at all. So again, there is a lot of distortion in prices around some of these commodities like oil because of the supply shortages, China buying up everything. So we’ll continue to monitor, but right now we’re basically, I think that oil will likely cool off a little bit going into next week.
Now, in the AI weekly outlook, we also want to bring some currencies into our analysis here and say, okay, well, if that dollar is getting ready potentially to break out to the upside, if it can break that long-term channel above 94.70 and start to proceed higher, what currencies would be hit the hardest by that? Well, in my respectful opinion, it would be likely the Euro, the British pound. These are two currencies that would get hit by that potentially.
Euro versus U.S. Dollar
So if we look at the Euro currency, right now we’re getting support building down here. But once again, if we look at it over the last nine-month period on the Euro or if we look at the longer-term play here, even going back, looking at that with, again, doing a comparative analysis to the Dollar Index because once again, what we need to understand here is that there’s an inverse, a 100% inverse correlation between the Dollar Index and the Euro/U.S. currency pair, you are absolutely trading the Dollar Index. So when we look at this, we’ve had some pretty heavy support here at 1.1603. So this will remain our focal point, whether we can hold above or below the 1.16 level. I would strongly advise that everybody watch that level very, very closely.
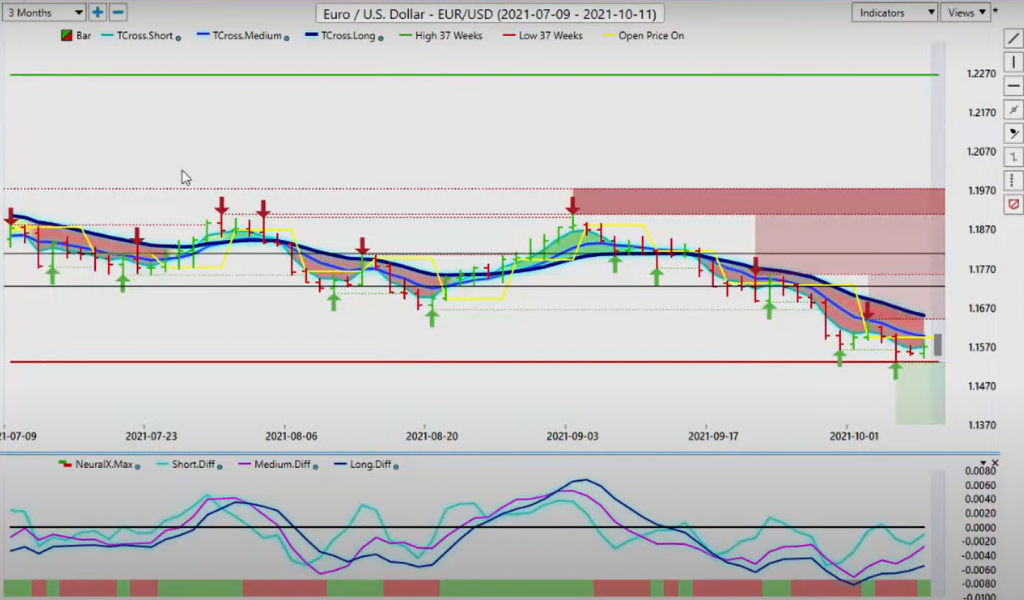
Now, our predicted differences are starting to rise. Our Neural Index is positive. But we are far, far below the T cross long at 1.1650. In my respectful opinion only, if we’re staying with the primary trend, then if there’s a corrective move on the dollar, corrective move on this pair, then we would target the high between 1.1755 and 1.1650 is where we would look for potential short entry points. If we bring in the predicted moving average by itself without the black line, to again remove some of the confusion of the crossover and everything else, and just look at this from an actual pivot standpoint, we’ve all heard people on TV talking about the 50-day moving average, 100-day moving average, 200-day moving average, this is conceptually, it’s the same thing, except we’re using a predicted moving average that is removed a considerable amount of lag out of those longer-term moving averages.
So in this particular case, we have an actual pivot area, the long predicted 1.1587. We’ve closed at 1.1570. The first crack in the armor here, so to speak, with the dollar is we would have to break above this blue line in order to take some of the pressure off the downside. That, at this particular time, seems unlikely because if gold breaks down, the Euro’s going to follow the gold down. That is the likely outcome here, or that is likely. But the one thing I will mention here is that, again, you’ve got that dollar cycle at the beginning of the month where the dollar is strong in the first week of the new month probably nine out of the 12 months per year, and then mysteriously sells off several days after the nonfarm payroll number, whether it was good or bad.
So really with the dollar, we’re trying to determine at this time whether we’re going to get a new trend or this is just part of the monthly dollar cycle of institutional buying to settle trade balances, to pay government employees, run local governments, all those things. They need dollars, right? So with the Euro, we will be watching this level of 1.1587 very closely. If we break through that, we go to the T cross long at 1.1650 where we can reassess if we want to add shorts at that particular time.
British Pound versus U.S. Dollar
Now the Pound/Dollar, again you can see the power of the T cross long, which determines whether something is bullish or bearish. Now, the pound has held above its weekly opening price. This point in time has been modified to the weekly price. So the pound, you can see made a big move up, but it was blocked by the T cross long, came back down, went back up to the T cross long on Tuesday. Did it again on Wednesday. Did it again on Thursday. Did it again on Friday. It’s very difficult not to make money when you’re using these levels as pivots or potentially entry points.
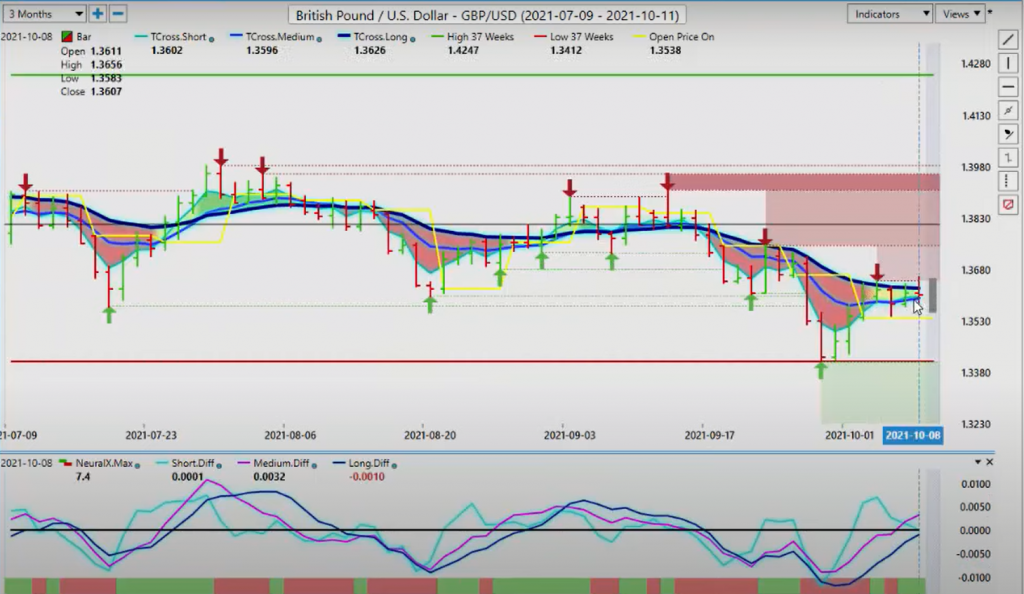
In this case, here now too for Monday, we have the VantagePoint predicted high coming in at 1.3651. We have the yearly opening price at approximately the same level. So 1.3651 for next week, guys, this is the level you want to watch. If we stay below 1.3651, the pound’s going to take a deeper dive, probably back into the lows, down around 134.12. But if we can hold above the T cross long and more specifically above 1.3651 for a couple of days in a row, at least two days in a row, then that should be it and the pound will likely start to move higher. But once again, my optimism on that remains very guarded. I will be watching that channel high of 94.30, 94.70 in the Dollar Index very, very closely if I’m going to get short on this particular pair.
U.S. Dollar versus Japanese Yen
Now, one of the lead indicators for the Dollar Index is the U.S./Japan pair. It is fully recovered after a retracement back down here towards the VantagePoint T cross long. We’re on the move again and we’re back up at the high or just above the high at 112.08 was the previous high. But the high from Friday, again, remember how they’re telling us what a horrible labor report that was, well, if that was true, then this wouldn’t be up here, would it? So again, somebody is buying this thing. We’re up here, so the Dollar/Yen is either going to take off here or it’s going to sink or swim I think would be a better terminology. But this certainly does have an underlying bullish tone to it. So again, we’re looking to see if we can break through some of these levels.
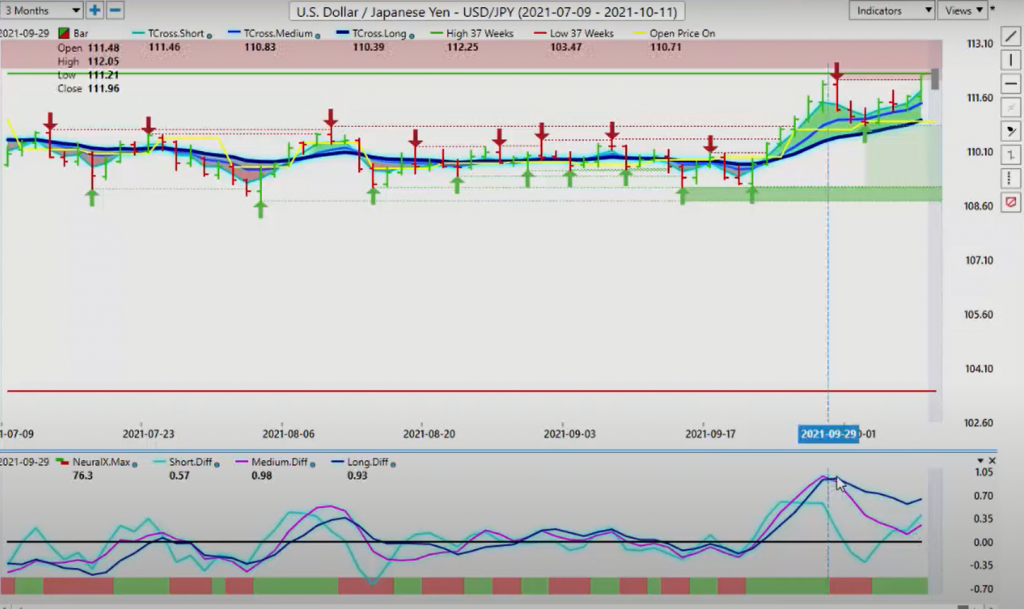
Now, I have to go back a fair ways here to find some verified zones, but there’s a lot of them sitting around this area. So the one I’ve got my eye on right now are these ones up here. Can we clear and get above and clear this 112.40 area? If we can clear 112.40, then our next viable target would be up at 113.83. So for this coming week, you want to watch the 112.40 area like a hawk to see if we can break and close above it.
Our VP indicators are saying yes to that actually. We’ve had a corrective move. The MA diff cross, the medium term crossing the long term predicted difference was spot on, telling us do not buy up here on either one of these bars, neither one of them. Then we come back down, but we start to get into a pivot level near that T cross long. And as you can see, the predicted differences are now, the slope of them are starting to turn back up, which ultimately led to a fairly significant rally from that 111 area, 110.80 area. But we’ve got to keep this thing going.
So once again, if we click on our F8 here, you can see that once we closed above that predicted moving average two days in a row, and this was all the way back on Tuesday and Wednesday, then on Thursday and Friday it was lift off. So again, 112.40, that’s the area you want to watch. And we also want to make sure that our Neural Index is holding green and our predicted differences stay above this very important zero line.
U.S. Dollar versus Canadian Dollar
Now, with the Canadian dollar for next week, the Canadian dollar had a pretty solid labor report. But I still say the U.S. labor report numbers were better. You know, the Canadian unemployment rate I think is still hovering up around 6.9%. That fails in comparison to the numbers out of the U.S. But again, we have some strong verified support down here. 1.2422 is going to come into play this week.
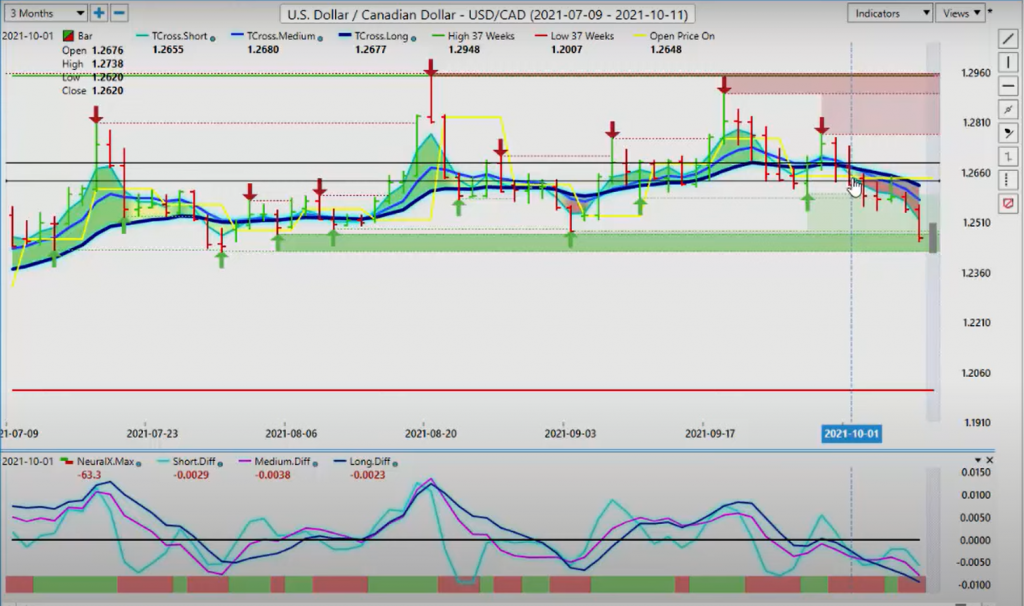
Now, the VantagePoint predicted differences, this move started over here. And again, this is an outlook, not a recap of something that already happened. I don’t like to do that. So yes, the medium term crossed over back here. And you can see that we’ve come back up and down we’ve come. So again, in this particular case, when we look at this, or let’s say, for example, we bring in our predicted high and predicted low, then there’s meat on the bone for both here in my opinion. Whether you’re a buyer or a seller, you can utilize this. But in most cases, you can see that after we have a big move like this one, there very often isn’t a lot of follow through. We didn’t hit the predicted high for the last couple of days. We’re hitting the predicted low. So ultimately, there was money lining up to get it short on this particular pair.
The Canadian dollar, they have commodities in their favor. They have equities in their favor. They’ve got a lot, the Canadian dollar has a lot of things that will help it that are not based around conventional technical indicators, waves, Gann theories, Fibonacci. They’re not always relevant when you’ve got strong intermarket correlations to oil, to the S&P 500. So again, if oil and the S&P 500 or the NASDAQ or both, they advance, then the Canadian dollar will make further gains against its U.S. counterpart. So again, we will watch this 1.2422. But just remember, order flow of traders love to buy dips down here or just outside of a channel. And let’s be clear, there’s a pretty strong channel, pretty strong channel going on this thing.
So again, when you look at this and you back it out over nine months, you can see that we’ve come right back up to where we were. We’re kind of hovering here. But this looks like it’s getting ready to potentially make a bigger drop, maybe even back towards by year end. I wouldn’t rule out, I definitely would not rule out the 1.20 area by year end. So that’s about 500 pips almost from where we are now. That’s a pretty decent trade if we can continue to hold these key VantagePoint levels.
Australian Dollar versus U.S. Dollar
Now, Aussie and New Zealand, Aussie/U.S. And New Zealand/U.S for next week, they are going to be at the mercy here, guys, of the S&P 500. If the S&P and the NASDAQ, which I showed you that fresh buy signal on the NASDAQ off that verified support low, if the stocks can recover or just hold their ground, then the Aussie could recover here. Now, again, we’ve got very stiff resistance here at the high of .7316. We need to break free and clear of that. In my respectful opinion, if I really look closer at this over a one-year period, I can see that I’m basically, what this appears to be is we’re just simply paused in the overall down trend on this pair.
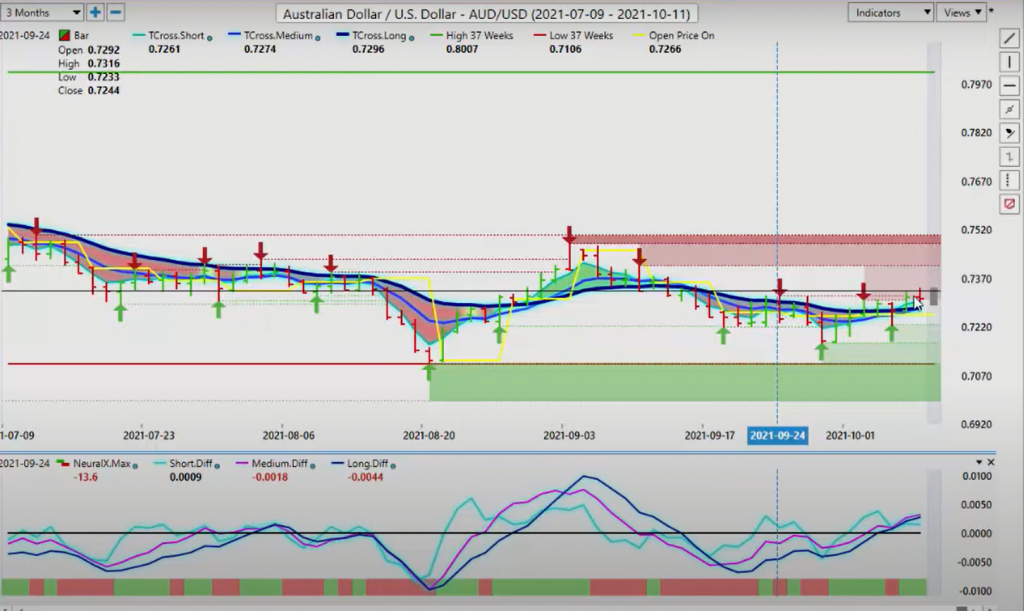
So again, we’re going to watch these VP levels very, very closely. If we can hold above the T cross long, and again this is a great step-by-step way of using VantagePoint is that we look at the T cross long and say, okay, are we above it or below it? We’re above it. So as long as we’re above .7278, then we would be long on this pair. But if you don’t agree with what I just said, then the alternate strategy is to put a sell limit order just below .7078 because, again, this is an outlook, guys, not a recap of something that’s already happened here.
We’re giving specific levels using these VantagePoint pivot areas to set up trades. So if you’re a buyer, you believe it’s going higher, then you can put your buy limit order at .7278. If you disagree and you’re a short trader on this, which I wouldn’t necessarily disagree with you, then you would put your sell limit order below .7278, right? So your long traders are going to be buying off the predicted low at .7278. That’s a perfect match, right?
Your short traders, they’re going to sell at the predicted high of .7337. Then you have the option of closing your trade out at the VantagePoint T cross long or the VantagePoint predicted low, right? Or you can just simply say I’m not sure which way this is going. It’s a little bit of a mixed bag. So I’m going to put a buy limit order above .7337. I’m going to put a sell stop limit order below .7287. And one way or the other, one of those two orders, I can tell you to a degree of about 80% that one of them is going to be triggered. And from there, we should be able to see what the next move on this pair is going to be.
New Zealand Dollar versus U.S. Dollar
The same thing would apply to New Zealand/U.S., but it’s a little clearer picture here isn’t it because it can’t get past the VantagePoint T cross long? So the difference between these two currency pairs, Aussie/U.S. and New Zealand/U.S, it’s showing me that New Zealand/U.S is the weaker of the two. If New Zealand drops, ultimately it’s likely to drag the Aussie down with it, so the T cross long .6964. But both of these pairs are determined on whether, will be determined whether stocks can regain their composure and start making gains.
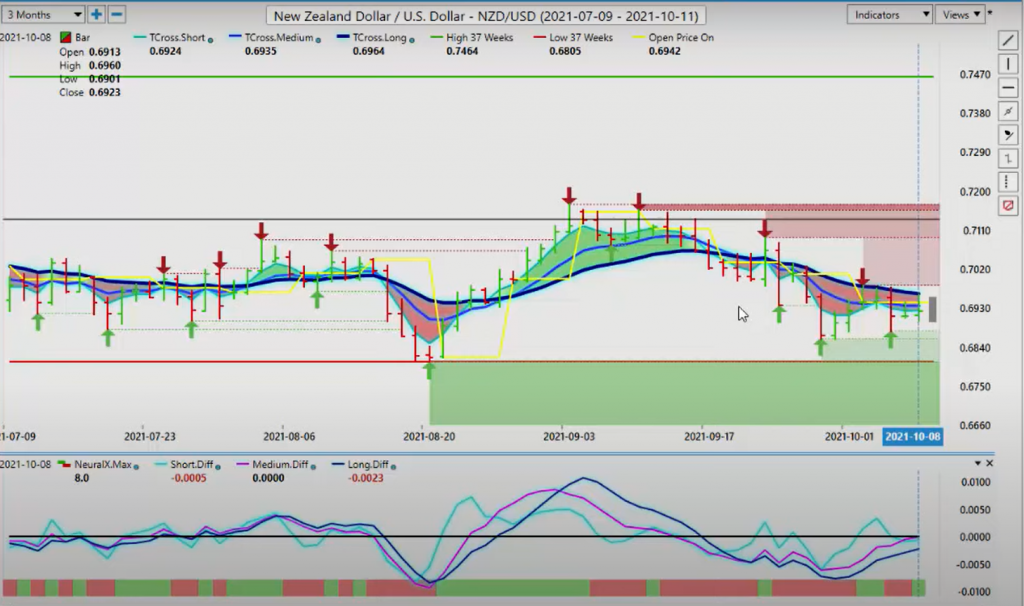
I would strongly advise that everybody look at seasonal patterns in stocks. You know, it’s amazing how many pundits are dumbfounded that the S&P and the NASDAQ have recovered when there’s a known seasonality that stocks don’t do well in September. But also, the other seasonality is stocks do do very well in October, November, and December. So if that’s the case, we could see a recovery on some of these equity-based currencies, like the Aussie, the New Zealand, and even the CAD would fall into that particular category.
So with that said, this is the VantagePoint AI Market Outlook for the week of October the 11th, 2021.


