Welcome to the Artificial Intelligence Outlook for Forex trading.
VIDEO TRANSCRIPT
U.S. Dollar Index ($DXY)
Hello everyone, and welcome back. My name is Greg Firman, and this is the VantagePoint AI Market Outlook for the week of November the 7th, 2022.
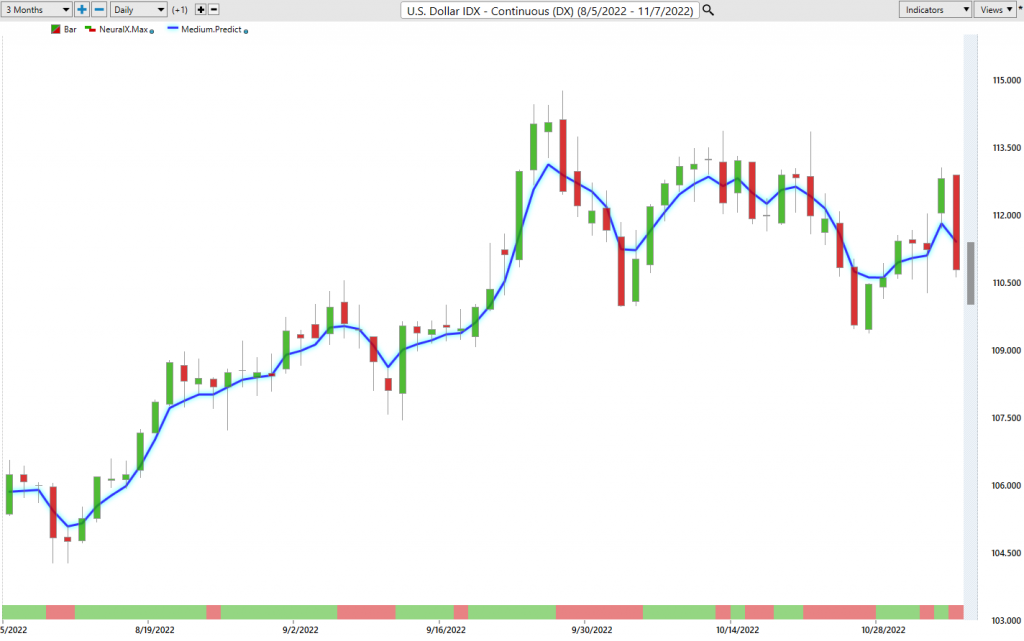
Now, to get started with this week, we’ll begin where we always do with the very important US dollar index. Now, the dollar having a pretty good week last week. Until Friday, we’ve got our payroll number. But the Fed has been crystal clear is what he’s doing going forward. They’re going to hike, they’re going to hike for longer, rates are going to stay higher for longer, but the hikes will be likely smaller into the first quarter or maybe December with a half a basis point hike. But either way, supporting the US dollar likely in the month of November.
Now, we have a large down bar. The market is gap down on profit taking on Friday. I anticipate this would likely reverse probably by Tuesday next week, so we will watch this very closely. Our predicted differences or our medium term crossover is still taking place. We’re above the zero line. The neural index and the neural index strength is pointing down for Monday, but Monday could actually be a buying opportunity in dollars, because again, when we look at the main correlation here… But before we leave there, that TCross long level 1.1160, we’re closing at about 1.1087, we’re looking to see if we can get back up above that particular level. But the dollar is still firmly above its yearly opening price at 95.64. Very, very strong year for the dollar.
S&P 500 Index
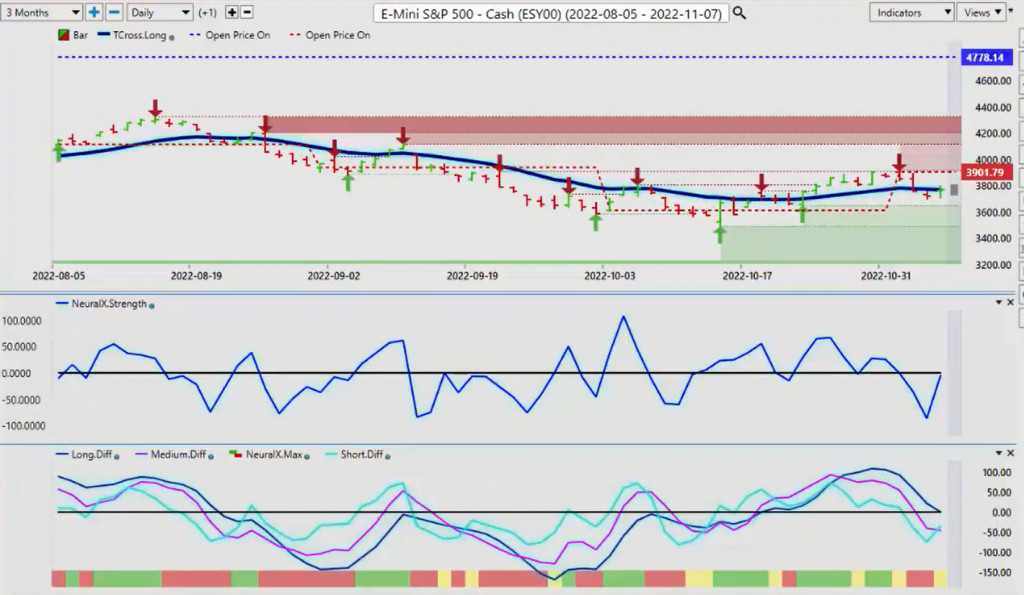
Now, the major inverse correlation that’s going on here right now is dollar down, stocks up, but a very dismal rally to say the least. Looking at what has actually happened throughout the week, the stock market down the entire week, and again, we can see that we’re sitting below the monthly opening price at 39.01, the yearly opening price. The S&P has never been positive on the year for any more than a couple of hours. So, again, very fairly strong down trend still. The market, I believe, still trying to digest what the Fed is saying, but I really don’t see that there’s that much to digest here.
He’s being as clear as he possibly can be that he’s going to continue down this path, and things like unemployment, all these things that doesn’t matter, his 2% inflation target. So, for now, we’ve stalled, closed the week out. You can see I’m using the cash price here. We’re closing 3770, TCross long, 3772, but we’re below the monthly opening price, the yearly opening price at 4778. Our predicted differences still ratcheting down below the zero line. So, we have a medium term crossover, we have a short term crossover, and the long term crossover is about to cross now. So, if we see a strong rally in the equity markets on Monday, be prepared for a potential selloff on Tuesday.
Crude Oil
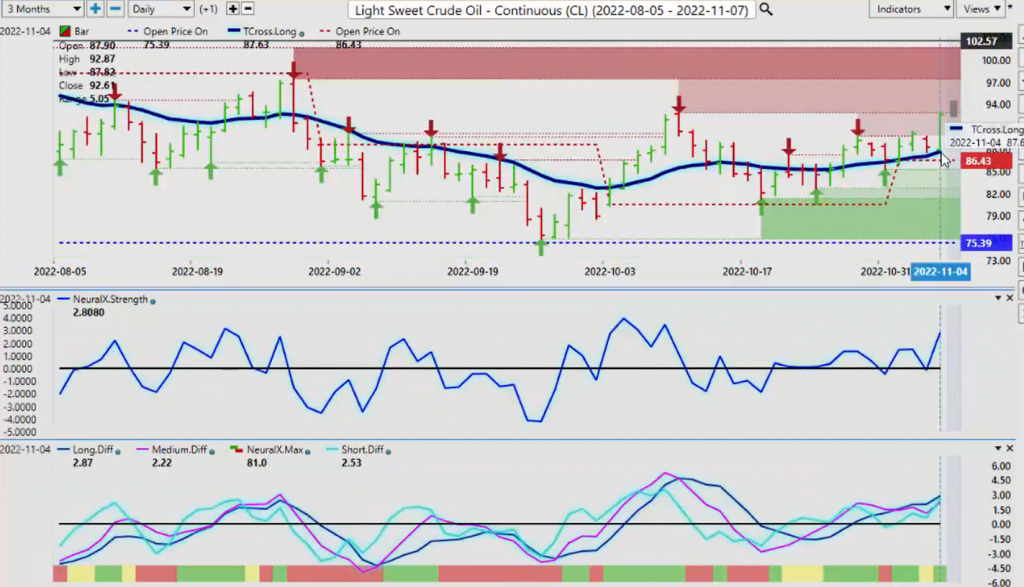
Now, when we look at light sweet crude oil, it’s had a big push up, but again, a lot of that is on dollar profit taking. So, again, when we see a large move like this on a Friday, we want to be very cautious about continuing to go in that direction. Now, I will say that oil is very bullish on the year. We’re above the yearly at 75.39, the monthly at 86.43, and again, we’re holding above that TCross long. You can see that we’ve spent the whole week bouncing off that vantage point TCross long, that critical level now coming in at 87.63, so that’s our main support level. We’re long, as long as we can hold above the monthly opening price and we can hold above the TCross long, then there is still that possibility of long.
Now, the one thing I will say, the medium term cross and the long term predicted difference, a risk off scenario can change this very quickly, so watch current events. But right now, we have a strong, verified resistance high coming in at 92.88. That is the immediate resistance that you need to watch this coming week if you’re trading these oil contracts. If we can stay above that critical 92.88, then we could maybe extend potentially a little bit higher towards the 97.44, but I think it’s very unlikely we go much past that.
Gold
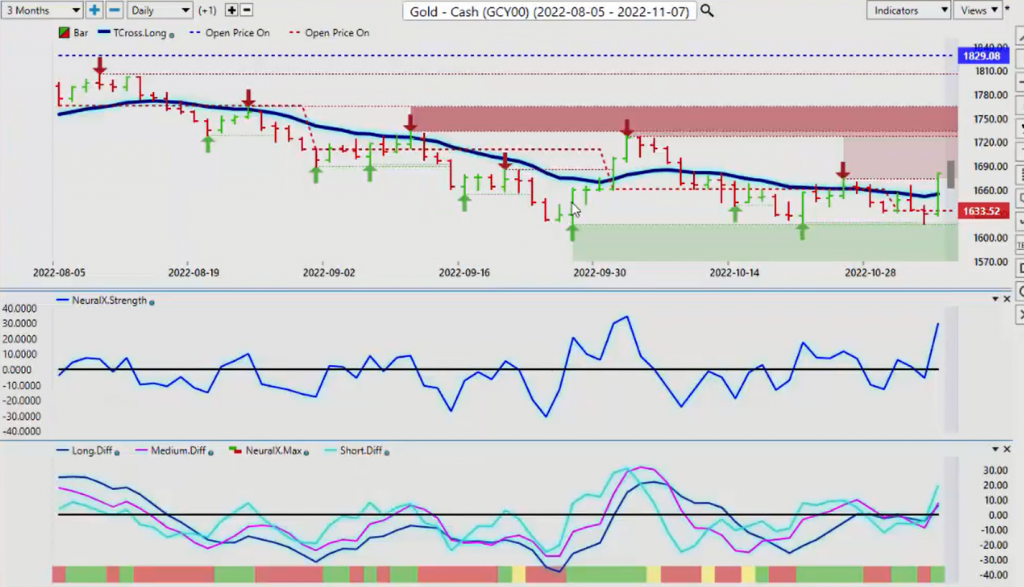
Now, when we look at gold contracts, gold again you can see having a pretty decent day on Friday only. The other days gold continuing to move lower.
We did find support down at the verified low, and that’s coming in about 1,618. You can see we bounced off of that on Thursday, and then Friday we had a significant rally, but once again, for all the wrong reasons. Guys, profit taking on the dollar after the dollar having a strong week, so you see gold reacting to that. But I don’t see any real big move up in gold until probably the end of the month or early December where the normal seasonality will kick in. The dollar will sell off in December, gold prices will likely rise, and maybe a small equity rally at that particular time.
Bitcoin
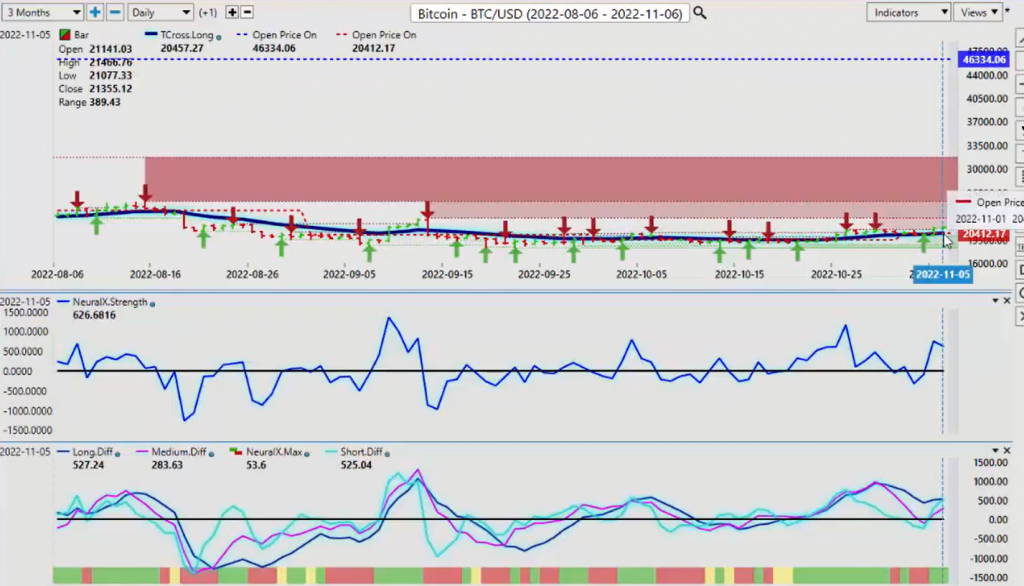
Now, we can also assess here that Bitcoin still remains bullish here, but it’s really running in a sideways channel. I would love to see a complete break of this first level, the high 22,718, but more importantly, I would prefer to see a break of 25,198. The only way this is going to happen is if the stocks turn around and they start moving consistently higher, and Bitcoin will follow the NASDAQ, it will follow the S&P 500, and it will follow the Dow. All three of those indexes are virtually the same trade. So, again, if one goes, they all go, and Bitcoin to date has been following.
Now, the indicators here are suggesting there is that possibility. Our medium term crossover is going back to the upside. Long term, short term crossovers have all crossed to the upside, so that is pointing that Bitcoin can move up. But November’s predominantly is not a great month from a seasonal standpoint on Bitcoin. Usually it’s early September to mid-October. So, we’ll monitor this one, but still, I still see Bitcoin struggling a little bit with the stock market.
Euro versus U.S. Dollar
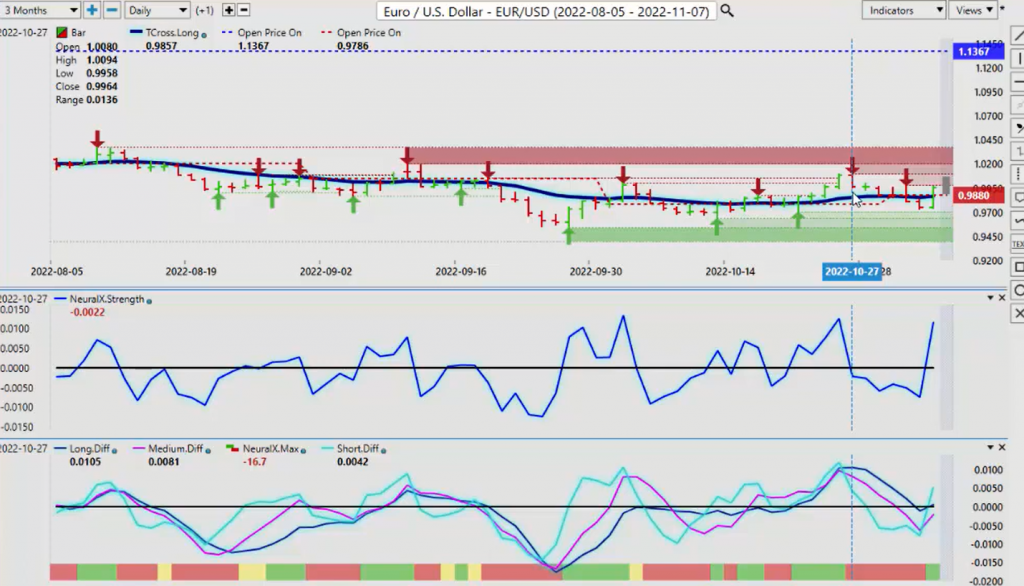
Now, when we look at the Euro, once again, the Euro finding support at the verified low, 0.9705, but we have very significant resistance up here.
Be very cautious on a Euro rally. If the Euro rallies, I think it will struggle to get over the parity mark and the 1.0094, but the high of 1.0198, that verified resistance high, I believe the Euro stops there either way. Nothing has changed in the Eurozone with the ECB, with the energy crisis over there, monetary fiscal policies in Europe, nothing really supports the Euro at this time. This certainly doesn’t mean it can’t go higher, but the Euro basically benefiting from dollar profit taking, in my respectful opinion, only on Friday and on Tuesday, look for a potential short on here, but again, the Monday, Tuesday reversal phenomena that I’ve talked about at the seminars and on here, it’s real, guys.I see this a lot. Whatever happens on Monday, a lot of these markets do the exact opposite on Tuesday. So, again, we’ll see our vantage point TCross long coming in at 0.9869. I do anticipate the Euro will retest this level this week.
U.S. Dollar versus Swiss Franc
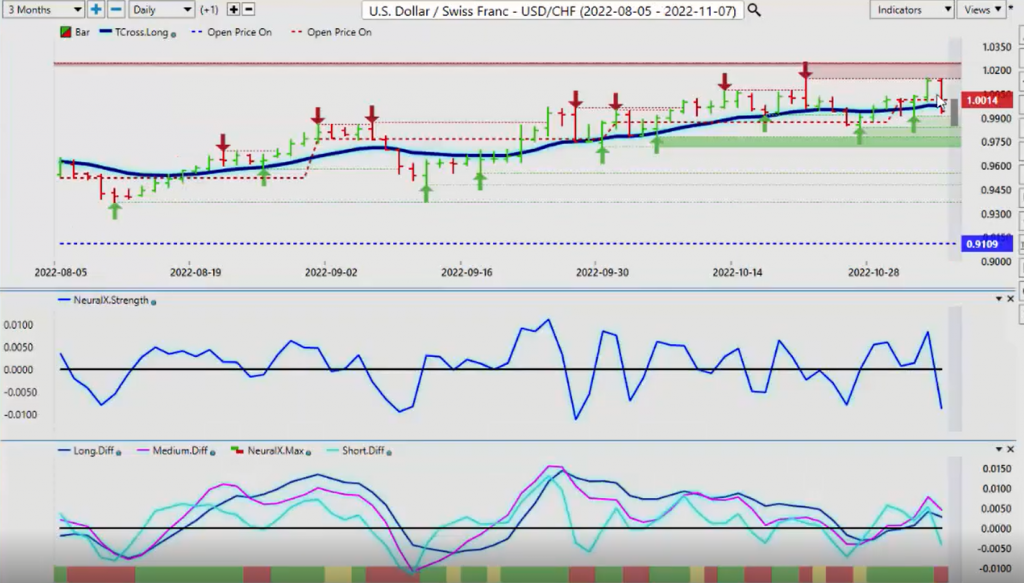
The US/Swiss franc could be a buying opportunity, here you can see again a large selloff on Friday on dollar profit taking. The bulk of the trading week was buying dollars against the Swiss Franc.
I believe that that will come up again next week and this is simply profit-taking and a corrective move lower. So watch the verified low at 0.9910 very closely. We have additional verified support at 0.9840 and if this pair is going to turn around, that’s likely where it’s going to be because as you can see, the predicted differences still remain above the zero line. But we’re expecting a down day on Monday. But once again guys, we going to have to remember that it takes time for the market to digest what the Fed has said, what’s the unemployment, the numbers in the unemployment report. So I wouldn’t be too quick to start selling dollars just yet.
British Pound versus U.S. Dollar
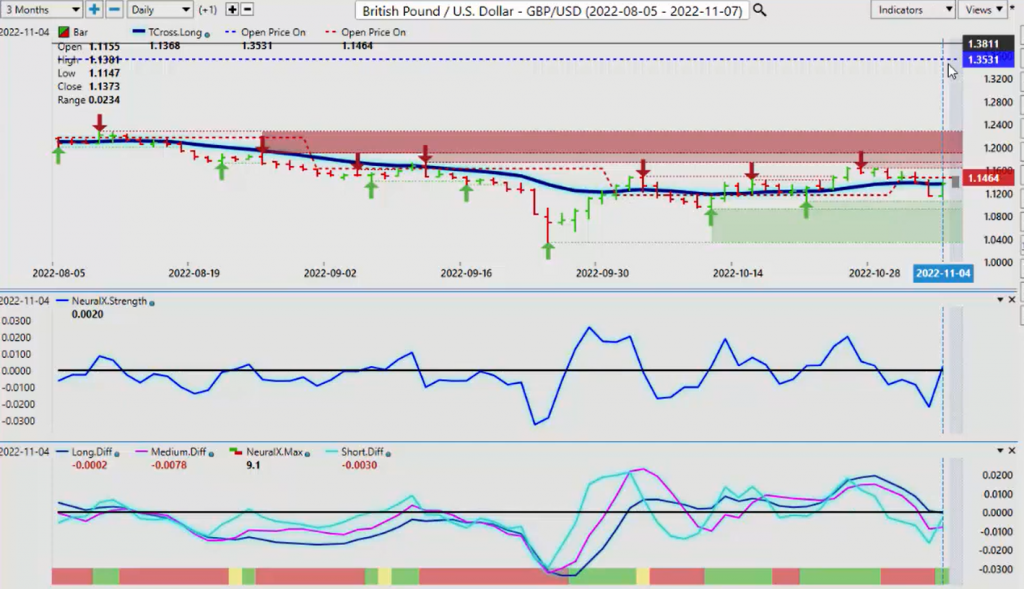
Now the pound/dollar also recovering this past week, or excuse me on Friday only. The pound basically running sideways along the monthly opening price, but still in a very strong down trend. The yearly opening price here, 1.3531, we must not lose sight of that here. That how bearish this trend actually is on the pound. So for now, the monthly opening price that’s coming in, you can see that’s this red dashed line here that’s coming in at approximately 1.1464. That’s our resistance to begin the week. We want to see if we can stay above or stay under this level. If we do, then the pound is likely to take another hit probably down towards the 1.09 area I would expect. Or at the very minimum, if we can’t get above that monthly opening price and stay above the vantage point TCross long at again that 1.1464 area. 1.1368 on the TCross long, then it would likely be more problems for the pound.
Now again, when we look at the pound, we really do look at the turmoil over there, energy problems, political problems, monetary and fiscal problems. So again, I would need a sustained break of the vantage point TCross long at 1.1368 before I really start looking at further longs on this particular pair.
U.S. Dollar versus Japanese Yen
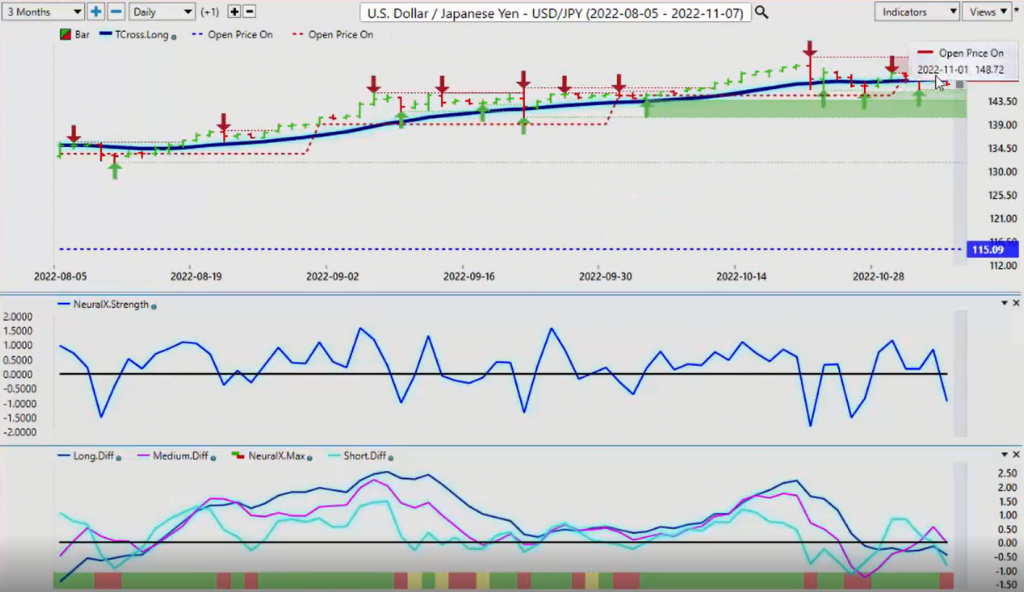
Now as we come into the dollar/yen, once again, the dollar/yen is basically running sideways here. In my respectful opinion, it’s struggling. You can see the monthly opening price and the TCross long are coming in at almost the same area. Our TCross long resistance 147.46 and our price on open for the month 148.72. Now the yearly opening price at 115.09 represents what a strong up trend this has been. But this has largely been caused by two things, the Bank of Japan trying to intervene to weaken their currency and then that blowing up in their face when the Feds started hiking like crazy. So really the Bank of Japan really did get a cake in the face, so to speak, by interfering with this. But once again, nothing goes straight up and nothing goes straight down. So if the dollar is truly going to weaken, then we’ll see it here also.
But this could possibly be a risk off building with the tensions between North and South Korea. Again, the US intervening in there. So we’ll monitor global developments, but for now still in a strong up trend. But the Bank of Japan is on the prowl. They’re going to be trying to weaken the dollar or strengthen the yen against the dollar. But I think that this is a mess that they’ve created and they may struggle to see that through.
U.S. Dollar versus Canadian Dollar
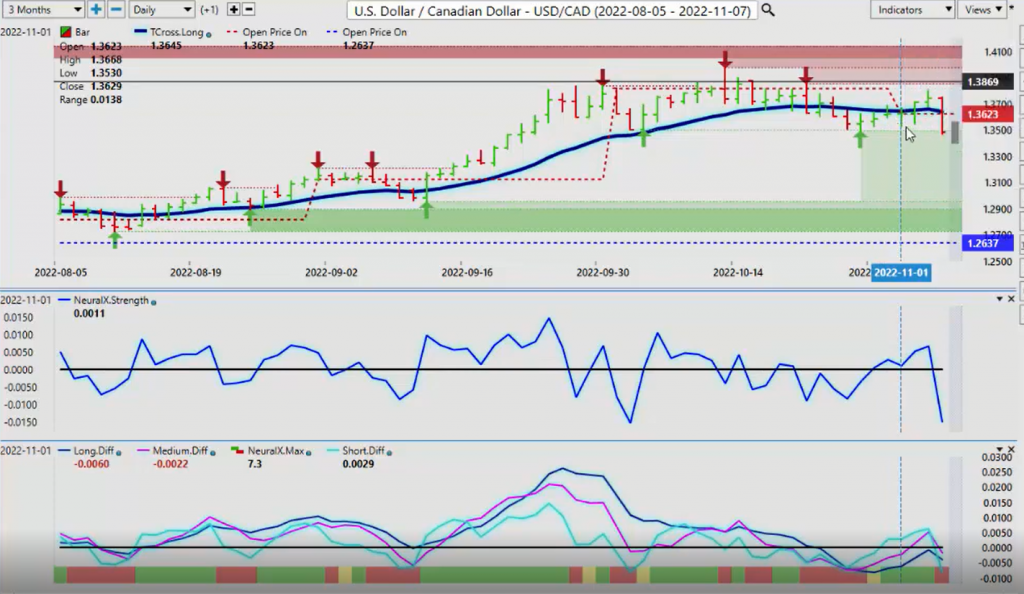
Now when we look at the infamous US Canada pair, the Monday-Tuesday reversal on this pair is really quite strong, to be perfectly blunt. You can really see it there last week. Again, we move up right away and then we just get pounded lower on Tuesday only to turn around and go back up on Wednesday. This Monday-Tuesday reversal on this pair is very strong.
So finishing the week the Canadian unemployment report was better. It beat expectations considerably, but it’s still not going to change anything that’s going on in Canada with inflation, with monetary and fiscal policy out of Canada. Again, very problematic for the Bank of Canada. So we’ve got a new budget, they’ve tabled a new budget. It’s just more the same political nonsense from the governing party in Canada. So we’ll see where this goes. But for now, the Canadian dollar will be at the mercy of the stock market and the commodity oil market specifically. So if stocks continue to advance in the month of November, that’s what will push US/Canada to lower. But if stocks remain at a down trend, then you may have a buying opportunity down at the low of 1.3496. But if you see a big push on this pair to the downside on Monday, the probability is it reverses and goes higher on Tuesday.
And if you get a big move up on Monday, then chances are it’s going to move down on Tuesday. This pair does this 90% of the time guys, so it can be very easy pickings with this Monday, Tuesday reversal with this pair. But the main support we’ll be keeping our eye on will be 1.3496. The vantage point TCross long coming in at approximately at 1.3640. But our predicted differences are pointing lower, the neural index, the neural index strength, both also moving lower.
Australian Dollar versus U.S. Dollar
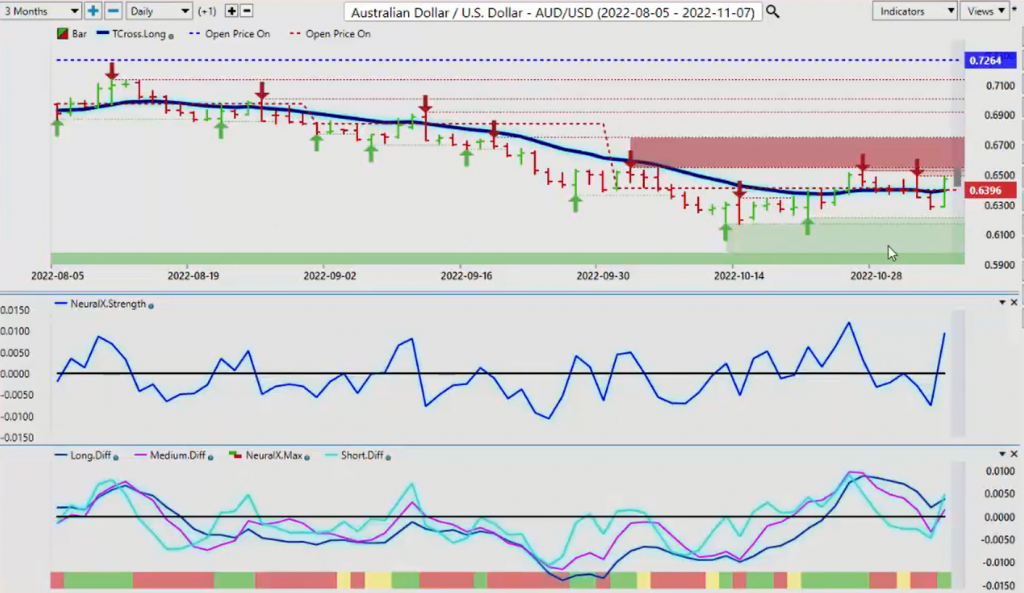
Now the Aussie and the New Zealand, again, the New Zealand taking a hit basically all week. And then when I see price action like this on a Friday and the payroll number out of the US for the most part was very solid. The upward revisions were good, everything was pretty solid in that report for the most part.
So this is a lot of times is you’ll have people taking profit just before or just after the announcement of the non-farm payroll number. Then on Friday the same people that close these trades out tend to reenter the initial trade, which is obviously short. So our verified resistance highs come in at 0.6491 and this is your big one up here, 0.6522. And then there’s another lingering verified resistance at 0.6547. So only a sustained break of that will take the pressure off the downside because as we can assess here, we are firmly below the yearly opening price at 0.7264. The Aussie in a very significant down trend.
New Zealand Dollar versus U.S. Dollar
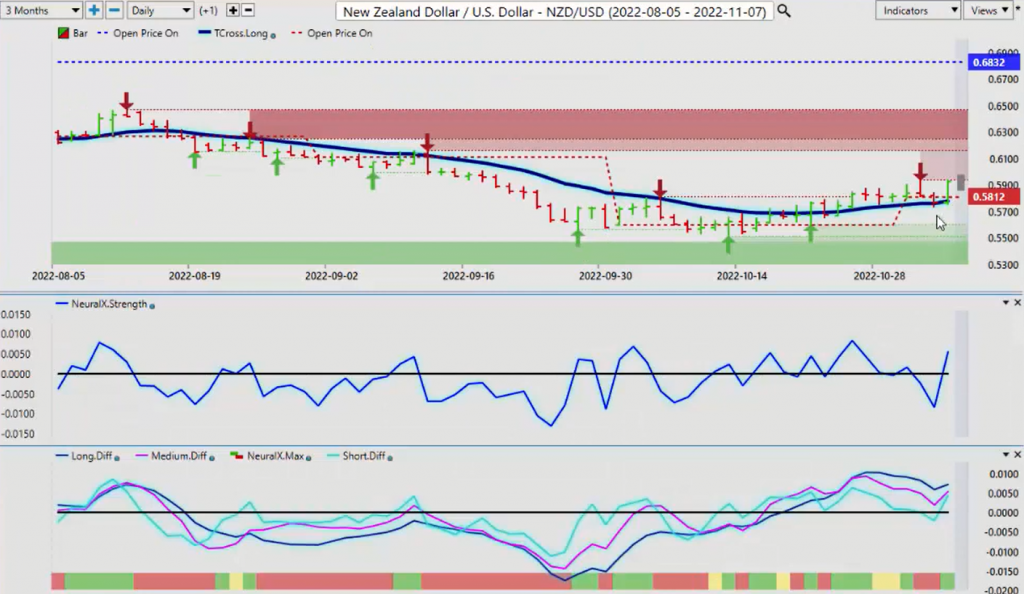
The Kiwi is not that much different, but the Kiwi is a little bit stronger. Now I’ve talked about this one with my own direct client base. This is being driven by the selloff in Aussie/New Zealand. So if you’re going long on one of these two pairs this month, there’s a slight advantage to New Zealand/US because Aussie/New Zealand, the seasonality is very strong to the downside with the Aussie/New Zealand pair. Always remember they have to sell Aussie/US and buy New Zealand/US to short Aussie/New Zealand. So I believe that the New Zealand is the stronger, or maybe a better way to say it, is the prettiest horse in this particular glue factory. So what that said, this is the VantagePoint AI market outlook for the week of November the 7th-