Welcome to the Artificial Intelligence Outlook for Forex trading.
VIDEO TRANSCRIPT
Hello, everyone, and welcome back. My name is Greg Firman and this is the VantagePoint AI Market Outlook for the week of April the 24th, 2023. Now, to get started this week, we’ll first begin to look at the equity markets, specifically the SPYs.
SPDR SPY ETF $ ($SPY)
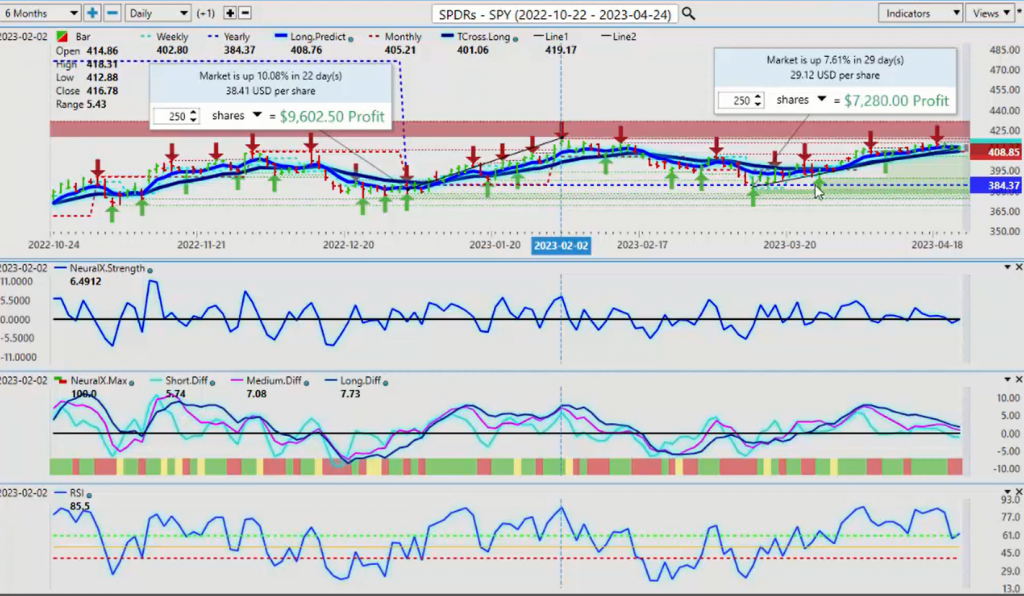
Now, what we want to look at here is where the bulk of the gains have come from in 2023. Very important that we accurately identify this. The bulk of the rally in the SPYs and the S&P 500. We can see we’ve been up about 9, 10% in the first 30 days of trading, from January 1st to, again, February the 2nd. We then came into a period of known dollar strength, that’s a very strong seasonal pattern, between February the 2nd and approximately March the 13th.
Now, a lot of market analyst participants extremely bearish on the markets at that time. But we can see the importance of looking at the yearly opening price. We then rallied another 7.6% to where we are as of Friday. So again, the bulk of the gains in the SPYs and the S&P 500 coming in that first 30 days of the calendar year, and then the process repeated itself from the exact same point. Looking back from one year to date, looking at going back to basically April 21st, 2022 has no relevance here, guys. That’s a complete nother world back then. What we had back in ’22 was essentially, when we look at that, we had an unprecedented level of rate hikes coming from the Fed, the Russia-Ukraine War, but mainly those rate hikes that sent the equity markets lower. So again, rolling performance, very much a lagging methodology in current market conditions. Because when we look at this, it’s simply, you can see clear as day where these rallies are coming from. But the main point is they’re coming from the exact same point.
So when we’re looking at talking about whether something’s bullish or bearish, we must use year-to-date, not a rolling performance because it’s misleading. It’s a lagging indicator that very often can be very, very misleading, or the fundamentals from a previous calendar year do not match the current fundamentals in the market conditions we’re dealing with today. So once again, we’re largely running in a significant channel right now, I would argue, between 418 and approximately the low of 380. This is what we’re dealing with right now. We’re looking for a break of this area. Now, the PMIs on Friday, they were a little bit better. There’s a possibility that the US and globally we’re not going to go into a recession. That’s still a possibility, so we will look at that. But for now, our main support level on our T cross long that’s coming in at 409.23, we’re looking to hold above that, or again, we’re at the top of the current range.
But to be clear, the bulk of the gains in 2023, looking at this accurately from a year-to-date, have been to the upside. So again, when we look forward right now, yes, there’s possibility of some pressure on the equity markets next week, until such time as we break out of this tight channel that we’re currently in.
U.S. Dollar Index
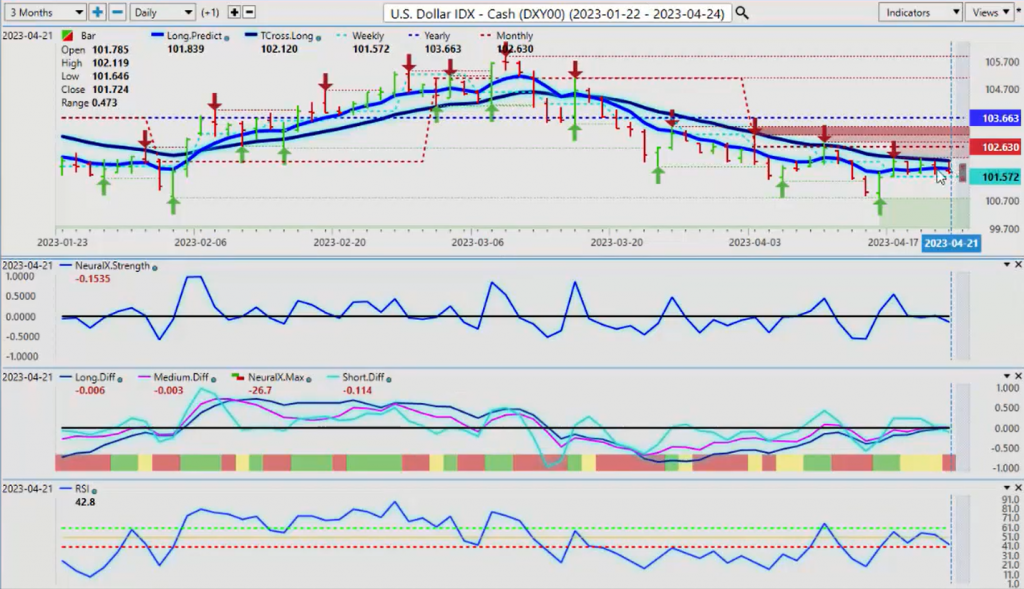
Now, when we look at the dollar for next week, again, the dollar has tried very hard to get through here. We can assess that talking about this in last week’s Weekly Outlook we have predicted levels, so that T cross long, we have hit into this level every single day this past week. Now, what I also would suggest, as I’ve talked about in the VantagePoint Live training room, is leveraging the yearly, the monthly and the weekly opening price. We can see that the entire week, the dollar index moved between the weekly opening price and the VantagePoint predicted moving average, but it was unable to break that.
But actually the dollar didn’t do too bad. It remained positive to start the week, and it finished the week above where it opened. So again, we will look to repeat this process next week. The approximate weekly opening price will come from the close, 101.72. So we must break through this T cross long that’s coming in at 102.12 to take the pressure off the downside. But we still have to look at that very important monthly opening price at 102.63, and we are firmly negative on the year at 103.66 on that yearly opening price. So again, to start the week, the indicators in VantagePoint are negative. The neural index, the neural index strength. The predicted RSI, though, with a 60/40 split and modifying the predicted RSI to a nine period, we’re lacking downward momentum, and that’s evidenced by using that weekly opening price.
The theory here is the same as the yearly and the monthly. If we break down below it, then we’ve got a bear signal here. But the dollar was unable to do that, and I would respectfully submit that that’s why the Euro-US could not break above and stay above 110 this past week.
S&P 500 Index
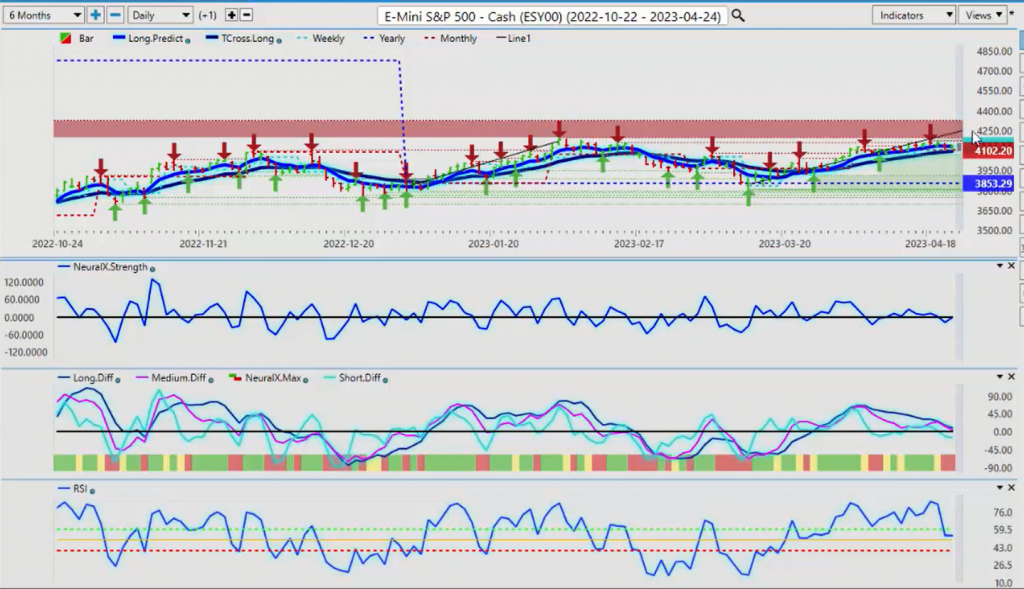
Now, looking at the S&P 500, we can see that it’s virtually identical to the SPY ETF. But when we look at this more accurately, using the year-to-date and measuring these price points, then we can see that we’ve got a very repetitive market here. When we look at that coming from the exact same point, we see basically the exact same signal. On the S&P we’re up 8.9% in the first 22 trading days. And then this simply repeated itself from the exact same level.
Now, your less experienced analysts and traders, they were caught short down here at the bottom. We don’t want to short the S&P below that yearly opening price until such time as we have a sustained break of it. But again, the bulk of the move on both the SPYs and the S&P 500 coming in that first 30 days of the year, and then simply repeating the exact same move in the last… Well, basically since October the 13th. Now, again, using that rolling performance calculation, we can see all the fake signals that we got around this level. But using a year-to-date, we can see that we actually were holding above that yearly opening price, and that represents a very strong buying opportunity. We can see that the predicted difference cross and the VantagePoint predicted moving average, the neural index, the neural index strength are rising. Predicted RSI right in this level right here, holding above 50 and then breaking above the 60 level.
We had a very significant move from March the 28th to today. But that move started way back here, guys. That didn’t start in the last 30 days, it started back here on March the 13th, and it’s a repeat from the original move from January 1st to February the 2nd. So again, with the S&P 500, very similar. We would look at it the same way. Our T cross long, 40.95. We’re looking to hold above that. But again, it is dangerous to buy up here because of this channel that we’re running in. We need to break free and clear of this channel. Be careful of a bull trap up here. We need a sustained break of the yearly high, which would be 41.95, and we need to hold above that particular level. Now, again, when we look at that dollar index here, we’re going to do a comparative. And the comparative is if the dollar index can break higher above that level, then that would be our trigger that the S&P 500 is going to hold within that channel and break down and start moving lower.
Gold
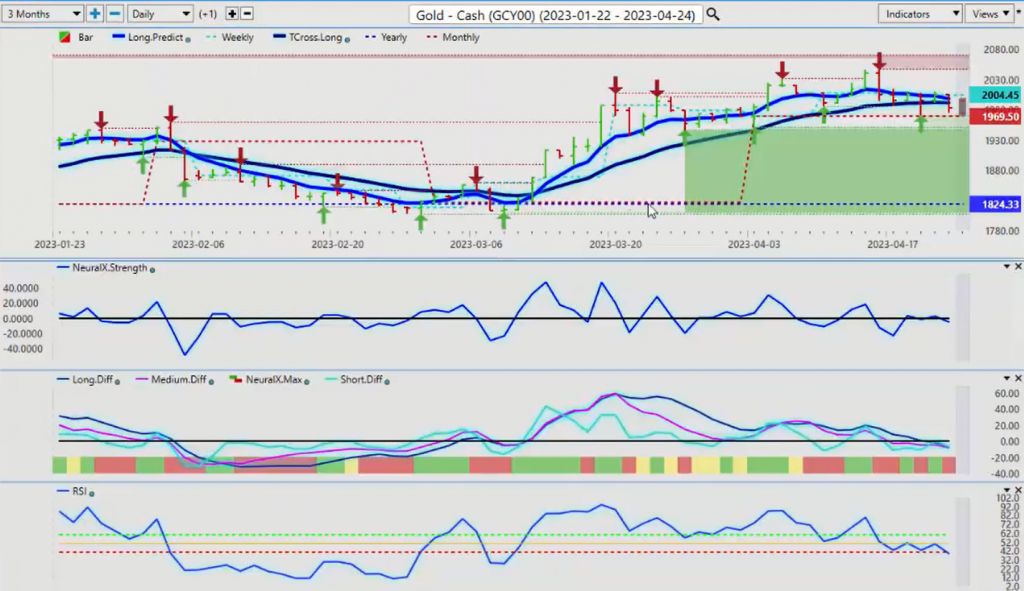
But my optimism on that right now remains heavily guarded. When we look at gold prices going into next week, we can assess the exact same thing. Gold actually didn’t really have that great of a week. We can see that our weekly opening price, 2004.55, we basically ran right along that weekly opening price the entire week. Now, that is a bearish close on Friday, but I would argue that that is a Friday and price on Friday is often not true. But the indicators in VantagePoint are turning negative. The neural index strength, the predicted differences are below the zero line. Neural index is red. And again, we’re at 38.8. So this is warning me that basically gold is getting ready for potentially a deeper corrective move. The monthly opening price here, 19.69. We really do need to maintain above this particular level, or it could open the door to a deeper corrective move.
I’m not convinced we’ll get to 18.24, but it is possible if the indicators continue to point toward this bearish move.
Light Sweet Crude Oil
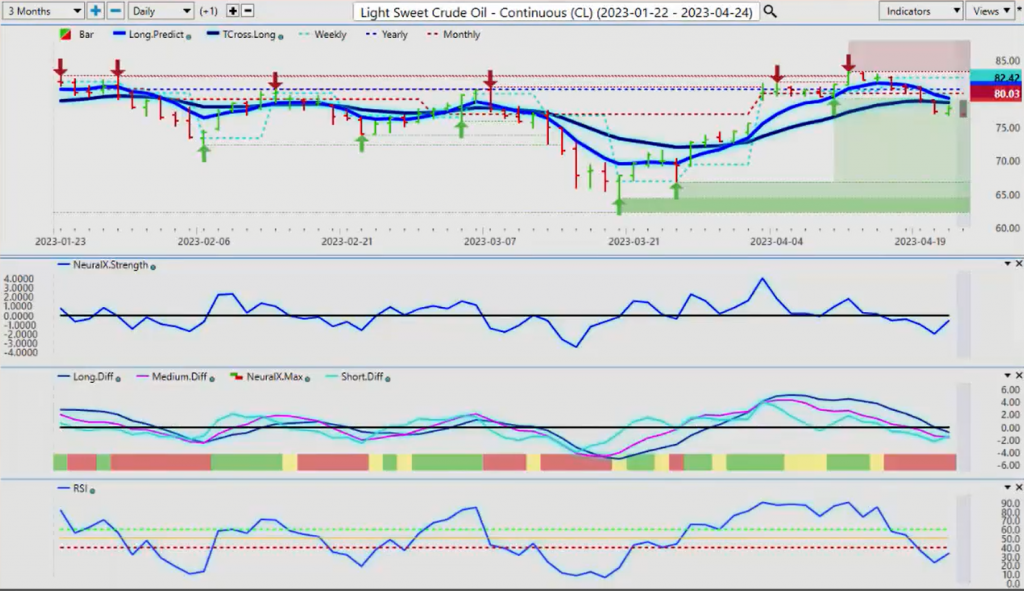
Now, light sweet crude oil last week going into this week, we’ve had a bit of a pullback, but there is a known seasonal pattern at the end of April here, guys. Going into May, which is a strong period for oil. Very often what happens is price goes in the opposite direction of what the real price is. So a strong seasonal pattern coming up in that first week of May. I expect a little bit more downside, but we can see that we’ve got a reverse check mark on the neural index strength. This is a potential problem for any further downside. Now, we’re starting to recover a little bit on Friday, but we need again to get back up above the VantagePoint T cross long at 78.74, and I would still look for that.
Again, those PMIs on Friday are not really pointing to a confirmed recession. So oil could respond positively to that next week. But I believe either way, towards the end of the month following that known 20-year seasonal pattern in oil that we’re likely to extend higher, but maybe not for another week or two. But again, we’re looking for those indicators to roll over. We see, once again, a reverse check mark here suggesting we could be going higher.
Bitcoin
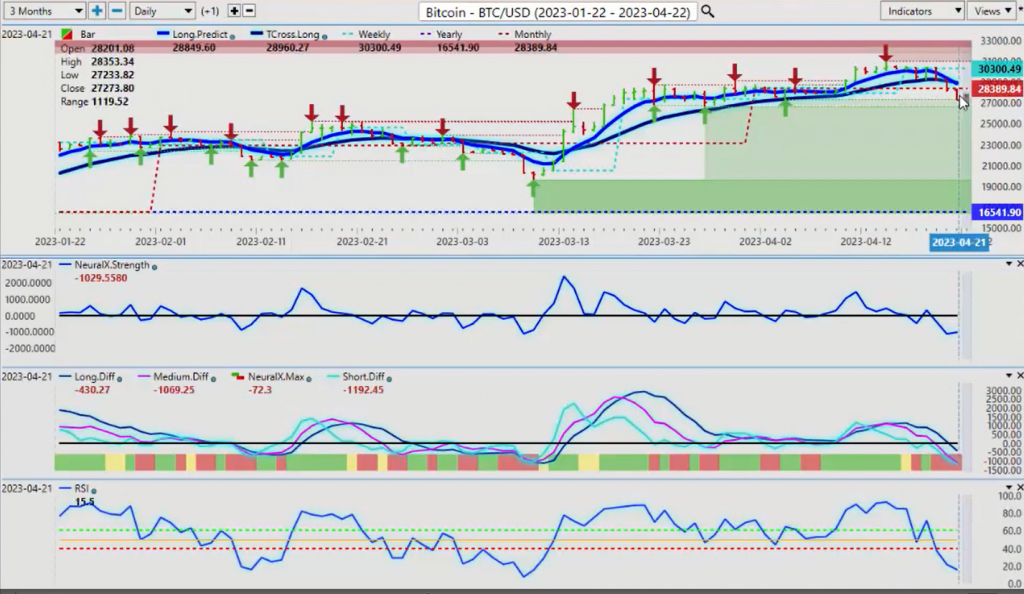
Now, when we look at Bitcoin, Bitcoin taking a pause here. You can see once again, leveraging your weekly opening price and then doing a comparative analysis to the predictive indicators I can assess here that unable to break above the weekly opening price the entire week. We’re coming down, testing the VantagePoint T cross long three days in a row, but then on Thursday you can see we snap lower.
But again, in my respectful opinion, only if we can’t get above the weekly opening price, then the open interest tells us that basically we don’t have any buyers up here. So, sure enough, anybody who’s long takes profit and that move accelerates to the downside. But again, we’ll keep a very close eye on this. Any turnaround in the equity markets and a softer dollar, we will see Bitcoin turn back up. But I would further argue, based on the most recent positive correlation between Bitcoin and gold, that it’s likely gold that’s getting ready to move lower and Bitcoin is a leading indicator.
Euro versus U.S. Dollar
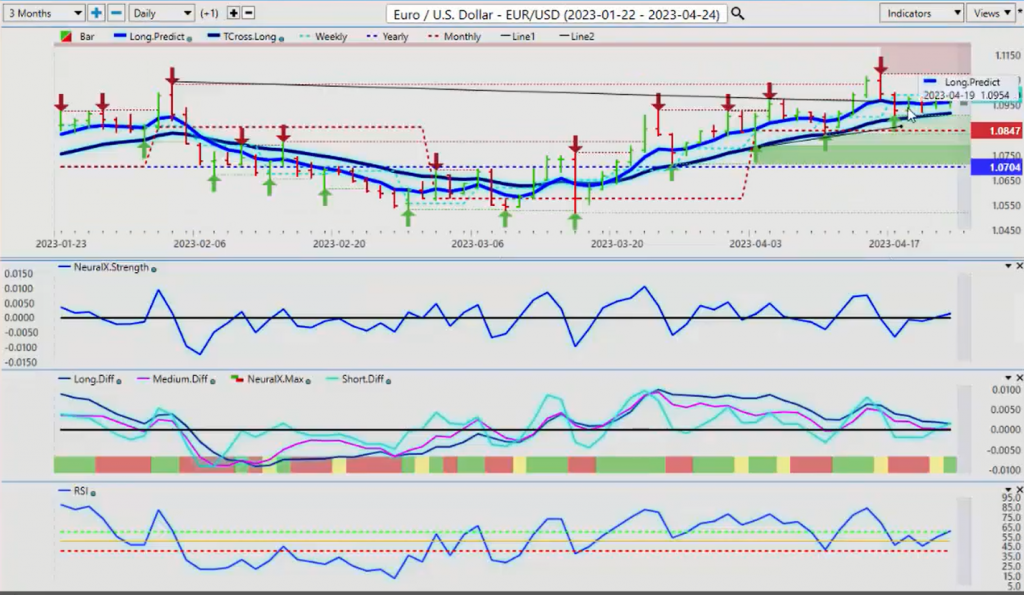
Now, as we look at some of our main Forex pairs going into next week, once again cross-referencing the Euro pair to the dollar index, we can see that there’s a 100% inverse correlation. There’s enough meat on the bone here last week for longs and shorts.
I can play both sides of this, sell into the weekly opening price and then buy as close to the VantagePoint T cross long as humanly possible. But again, you can see how this game works, that we just simply have no buyers at or above that weekly opening price that is coming in at 109.90. So smaller moves, but I would say an average ADR range per day is about 50 PIPs to the downside. But you’ve also got 50 to 80 PIPs to the upside. Now, in one day that may not sound like much, but over four or five days, that’s actually, those PIPs, those price interest points start to really add up. So again, we’ll look to repeat this next week, but the Euro, as you can see, had a very strong close at 109.90. So at the beginning of the week, you can take your VP software and basically just draw a line on there.
And if we’re holding above this next week, then we would look to go long Euro. But if we can’t maintain a move above that weekly opening, then the Euro could be pressured to the downside. And the inner market correlation here that you want to watch for is the positive correlation between the Euro and gold contracts and the inverse correlation to the dollar index. These intermarket correlations are driving factors of every single market. So right now, the only indicator positive for the Euro is the neural index strength. The predicted differences are holding above the zero line. But this is pointing at 60.6 on the predicted RSI is pointing towards some sort of upside momentum. Could be just fake price on Friday, but it will definitely be something to watch. But if you know the level, the breaking point of the weekly opening, then we can assess it from there.
But make no mistake, despite what they’re saying about the Euro, this is very bullish on the year. We’re above the yearly opening price at 107. We’re above the monthly at 108.47. If we can maintain leverage above the weekly, then that would trigger a move up. But if we can’t, then we should expect a deeper pullback towards 108.47.
U.S. Dollar versus Swiss Franc
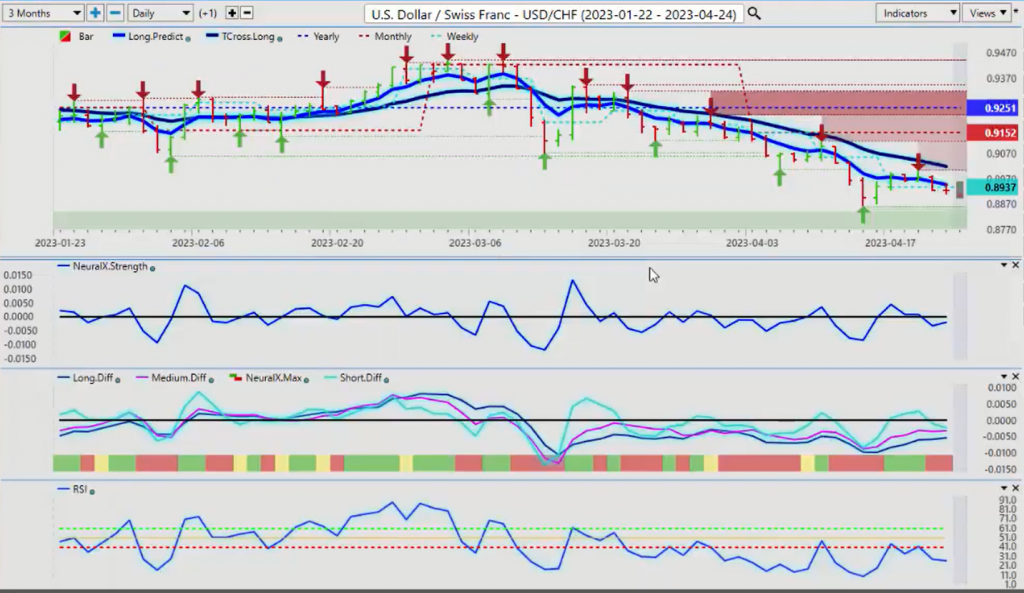
Now, should the dollar recover next week, then US-Swiss Franc is also likely to recover higher. But we need those indicators from VantagePoint to confirm that and right now we’re not there yet. But I would anticipate, if nothing else, a retracement to the T cross long at 109.19. So we have those upside targets. When and if we get to that level next week, we can then say, “Okay, maybe I should take some profit at the T cross long until such time as I can break and stay above that particular level.”
That is possible. But the dollar is really showing depreciation against the Swiss Franc. Even through everything that happened last year with the interest rate hikes. When we go back again, we look at what went on last year. The best that this pair could do, shockingly, is around the 101, 104 area. I too am somewhat surprised by this. I think we got up to about maybe 104 or so on that. But again, with an unprecedented rate hikes, and this pair still couldn’t break through and get above 105, 108, 110, where I’ve been used to trading this pair over the year. It still points, again, it points towards further depreciation in the US dollar.
British Pound versus U.S. Dollar
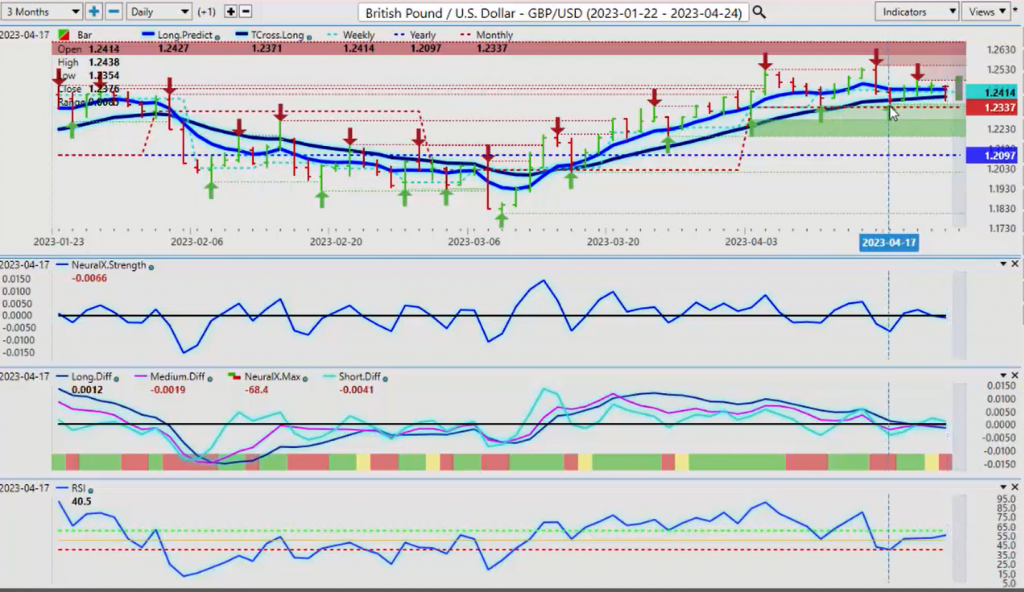
Now, with the pound, going into next week, we can assess the same thing again. When we look at the weekly opening price from last week, 124.14, if it comes down and hits the weekly opening price once or twice, that’s one thing.
But when it repeatedly cannot get, again, above or below something, then we’ve got a problem here. So when we look at that resistance, 245, we look at the weekly opening price from 124.14, we can see that the entire week it’s failing at or about that particular level. And by the end of the week, it had simply pulled all the way back down. So again, the indicators on this particular pair for next week are, I would say, flat to neutral. But keep a very close eye on equities on the dollar index, and even gold for that matter, because these intermarket correlations will ultimately dictate. But right now we’ve closed the week at 124.42 so that’s where our sticking point for the week is going to be. The indicators in VantagePoint are suggesting that the initial move by Tuesday will actually be down. And you can see this entire week we’ve been hitting into that T cross long, while at the same time simultaneously failing into the weekly open.
So we’re looking to repeat this next week, identify the weekly opening price and then leverage our trades against that T cross long.
U.S. Dollar versus Canadian Dollar
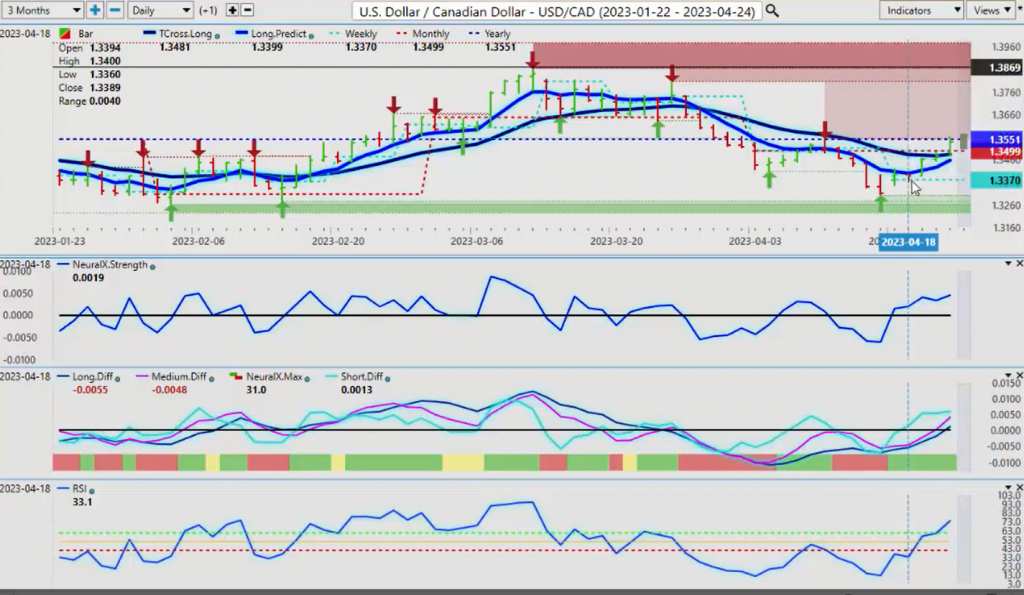
Now, the US-Canada, once again, a pair that’s notorious for a Monday-Tuesday reversal. So you can see that this move on Monday last week, we initially pushed up, then we pulled back on Tuesday. This is perfectly normal. This pair does this 80 to 90% of the time every week regardless of the trend. But then you can see a very sideways day, very little movement on this particular pair. But it holds above the weekly opening price. That led to an accelerated move by the end of the week, all the way up where it inevitably stopped and hit a brick wall at the yearly opening price, 135.51. So for next week, we’ve got to be cautious here, because if those equity markets turn around and the chatter in the market is no recession, then this pair will drop pretty hard off this particular level.
Now, if there’s recession fears, more hikes from the Fed, then obviously we blow through this level. But be very cautious on this pair on Monday, because often, whatever it does, it will do the exact opposite on Tuesday and potentially the rest of the week, just like it did this past week. I see this more often on this particular pair. So right now, if and only if we can maintain above 135.51. If not, then this is a short, guys. And again, the depreciation in the dollar is evident right across the board here. So whatever tools you’re using, make sure that you identify 135.51. This number will come into play, I would anticipate, just about every day next week, unless we have a significant failure from this particular area. Now, the Aussie and the New Zealand, the Kiwi, will follow the CAD. The CAD goes down, these two go up. That’s the way this works, guys.
Australian Dollar versus U.S. Dollar
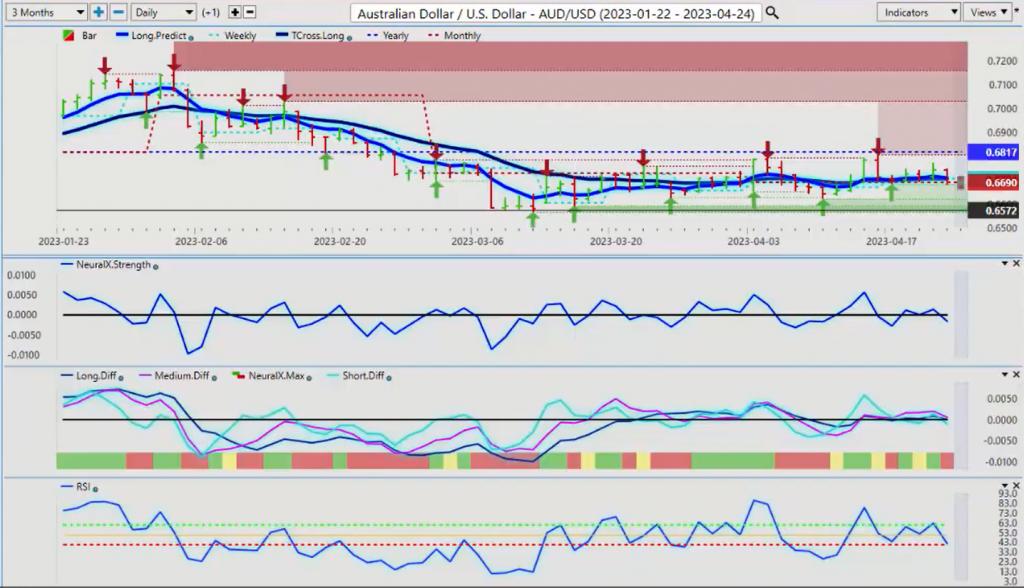
The intermarket correlations between these equity-based currencies, the CAD, the Aussie, and the Kiwi. So right now we’re closing out on the monthly opening, but you can see this entire week that basically we stayed. And it kept coming back to that weekly opening price over and over and over again at 67.04. Now, we’ve closed the week surprisingly at 66.91. So that is basically going to be your week, depending on what kind of gap we get on Sunday night. Because again, this presentation is done while the market is closed, because this is an outlook, not a recap of something that already happened. So we already know these levels. As long as we don’t get a huge gap in the market, then 66.91 would be our focal point to start the week. Can we hold above it? Can we not hold above it?
New Zealand Dollar versus U.S. Dollar
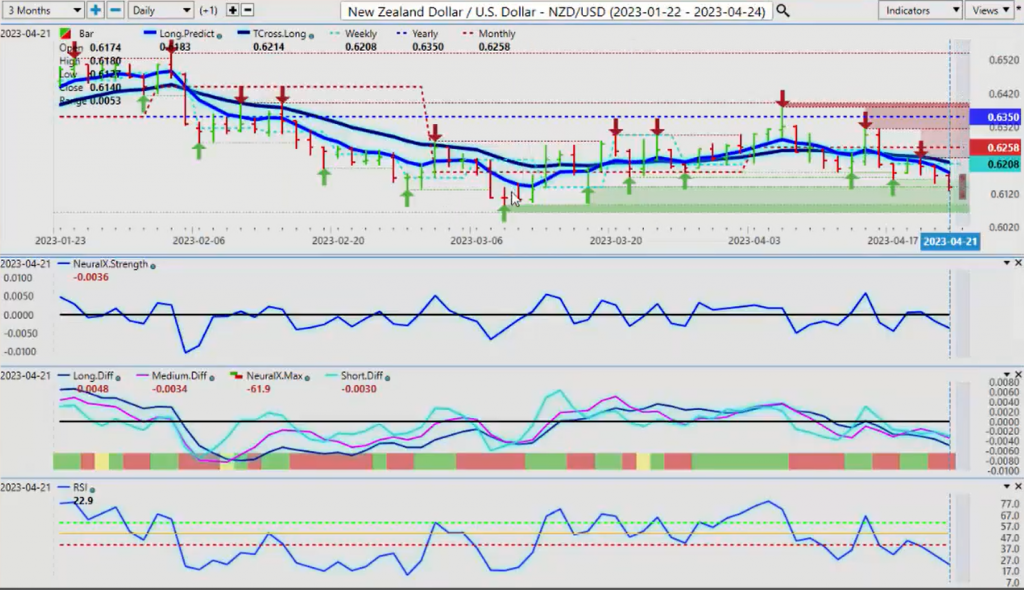
So right now, the indicators on VantagePoint are suggesting the initial push at the beginning on Monday will be down. But again, we need to see where this pair is come Tuesday. And I would argue the exact same thing for the Kiwi. We need to basically hold. We’re moving into the lower end of this range, 60.85, approximately. But we’re looking for reversal indicators that would warn us. The biggest real-time inner market correlation that will point to a reversal is if the equity markets, the S&P, the SPYs, the NASDAQ, if they turn back up, then the Aussie, the Kiwi and the CAD are very much likely to follow. So with that said, this is the VantagePoint AI Market Outlook for the week of April the 24th, 2023