Welcome to the Artificial Intelligence Outlook for Forex trading.
VIDEO TRANSCRIPT
Hello, everyone. Welcome back. My name is Greg Firman and this is the VantagePoint AI market outlook for the week of November, the 22nd, 2021.
U.S. Dollar Index
Now, to get started this week, we’re going to begin where we always do, with that very important US dollar index. But first, let’s look at the indicators we’re going to be using in this week’s presentation. We’re going to be using the 44 week look back to get our overall range. We’re using bars, not candles. We’ve got our long term crossover, which I’ll explain in a minute without the black line. Just the blue line. We have our predicted short, medium, and long term differences with our neural index. And of course, the very important point in time.
Now, we’ll also be using the triple AMA cross using our T cross long only to give ourselves a pivot level. And of course, the very, very popular, verified support and resistance zones.
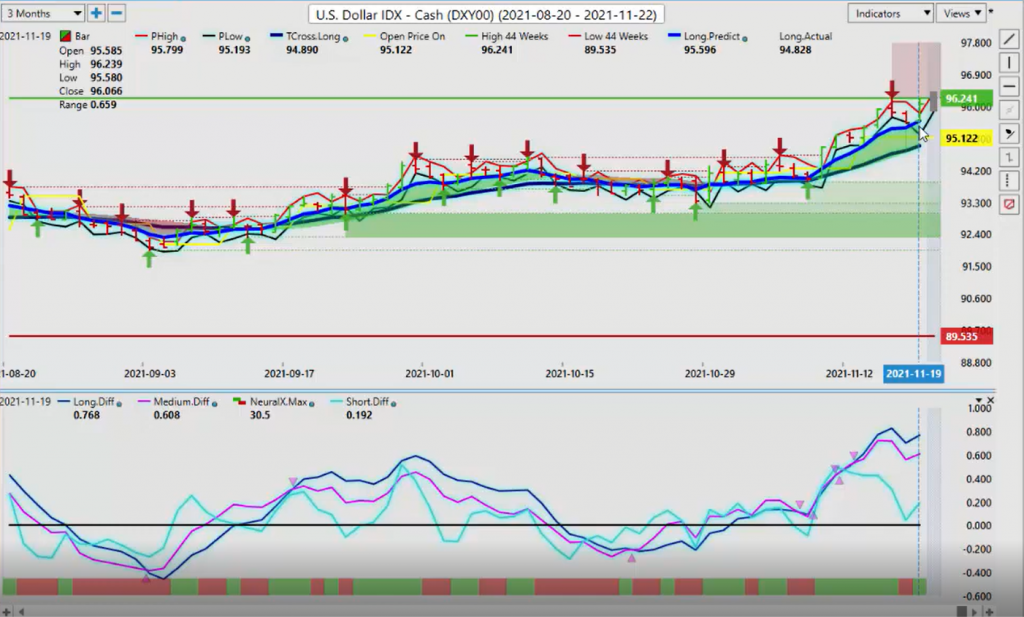
So when we look at this past week on the dollar, once again, we’re looking for further dollar strength from this past week. When we look at, we can see where we’ve held above our weekly opening price at 95.12 for the entire week. Now, what I’m seeing here is a little bit troublesome for further dollar strength. Now, in most cases, the dollar is weaker around the 20th of the month. The dollar predominantly on a seasonality basis, doesn’t do that, doesn’t fare that well in the month of December. So when we look at this, we’ve got what appears to be a short term top in place at 96.24. We’ve come back up and tested that level again on Friday. However, only after comments from one of the Fed members about ending QAE sooner hiking rates, sooner, all these things. So the dollar got a boost from that.
But what we’re looking at here is this lighter colored blue line, is our long predicted. Now our T cross long, another term for it, is the long term crossover without the black line, just the blue line; and our T cross long, our major level, our pivot level for support or resistance, in this particular case support, we can see that as long as the market is holding above, both of these two lines were bullish.
Now, to finish the week, the dollar has finished bullish. But again, you’re coming into a holiday short week next week. The first level of support that we want to watch is the T cross long at 94.89, that’s followed up by the long predicted at 95.59. So again, this is an outlook, not a recap of something that already happened. The strategies presented here are things that you can replicate with your VantagePoint software and apply, wash, rinse, and repeat daily by simply doing the same analysis each day in the evening when your software is updated.
So for now, when we look at our most recent MA diff cross, that is to the downside. I believe that the dollar had pretty much tapped out at about 96.24. And my further view is that the further we move away from the T cross long or the long predicted, either one of them, but mainly the T cross long, the further we move away from that, you’re going to have a mean revision kick in here where it’s going to try and come back to it. I believe that that could be as early as next week.
Gold
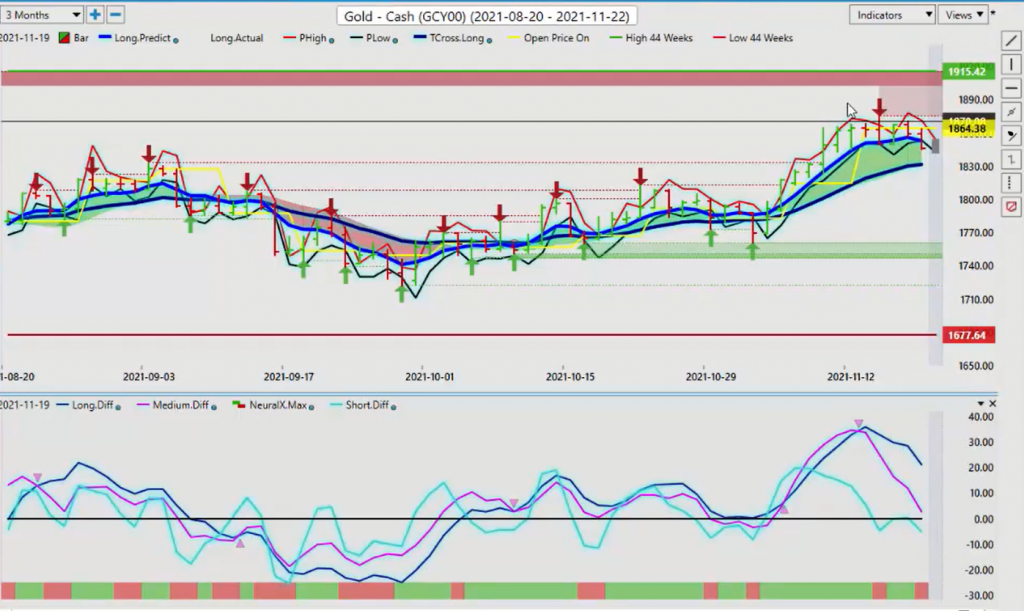
Now, when we look at gold prices, again, we’ll do the same analysis here. You can see that using the point in time as the weekly opening price gold has remained below that weekly opening price, or at least closing below it, 80% of the time last week, the comments from the one Fed member were a little too much for gold to digest on Friday and it started to sell off more aggressively.
Now, what we want to look for in our software is predicting these moves before not after they happen. So when we look at this, our MA diff cross, it crossed to the downside at the beginning of the week as per last week’s presentation that I did not anticipate gold would clear the yearly opening price, which we identified between 18.85 and the 19.04 levels. So, gold struggling up here. We get our MA diff cross. This is our medium term crossover, the strength of the medium term crossover, versus the strength of the long term crossover that is turned to the downside. And immediately, gold started pushing lower, but we basically, it’s warning us that we don’t have any buyers. Now, we’ve closed on Friday below the long predicted at 18.52, but we must still push down below 18.31 to confirm further downside on gold.
Because again, going into the month of December, predominantly, the dollar has not fared very well. So keep a very close eye on 18.31. I suspect we will test this on Monday, but the question is, will we go below that on Tuesday and Wednesday? But again, you can repeat these methodologies each day with your VantagePoint software just by identifying these key levels.
S&P 500 Index
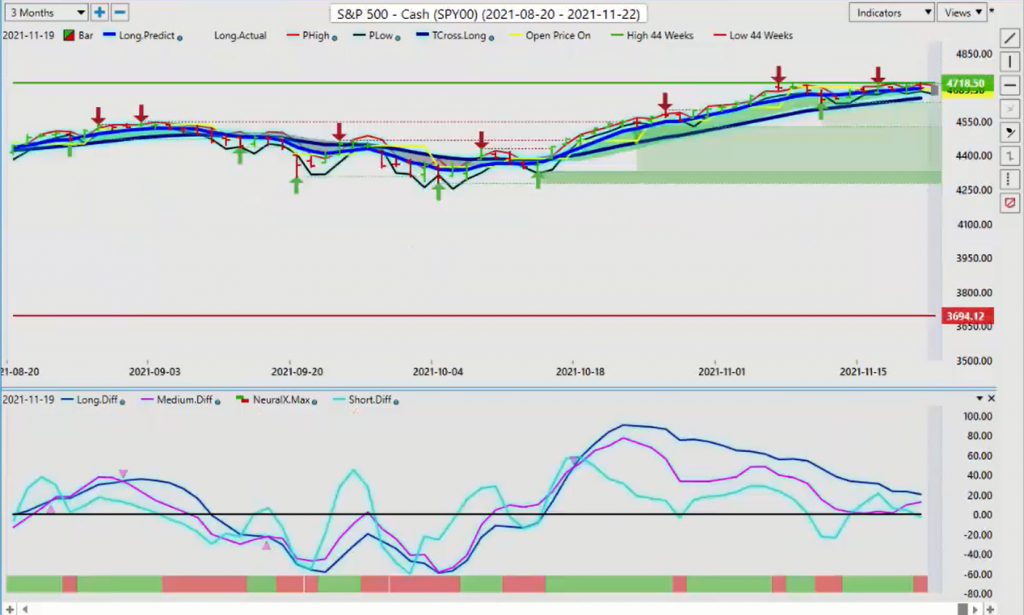
Now, when we look at stocks, stocks again holding firm, basically hugging the T cross long at 46.95 for the better part of the week. We remain long while above 46.51, our T cross long. Our predicted differences are coming off the zero line and the pink line is moving back towards the blue line, which is suggesting that equities are getting ready to move higher. I would anticipate further volatility to begin the week, but again, focus your trading Tuesday, Wednesday, and Thursday, and be very, very cautious on Monday because very often it’s not a true price. We see a true price once all markets are in after 8:30 AM Eastern standard time on Monday morning. Then, we start to see the real price going into Tuesday and Wednesday in higher volume. But again, we want to identify our long predicted 46.95; T cross long, 46.51. And we’re getting a warning sign here that equities after probably one more down day are getting ready to turn back to the upside.
Bitcoin
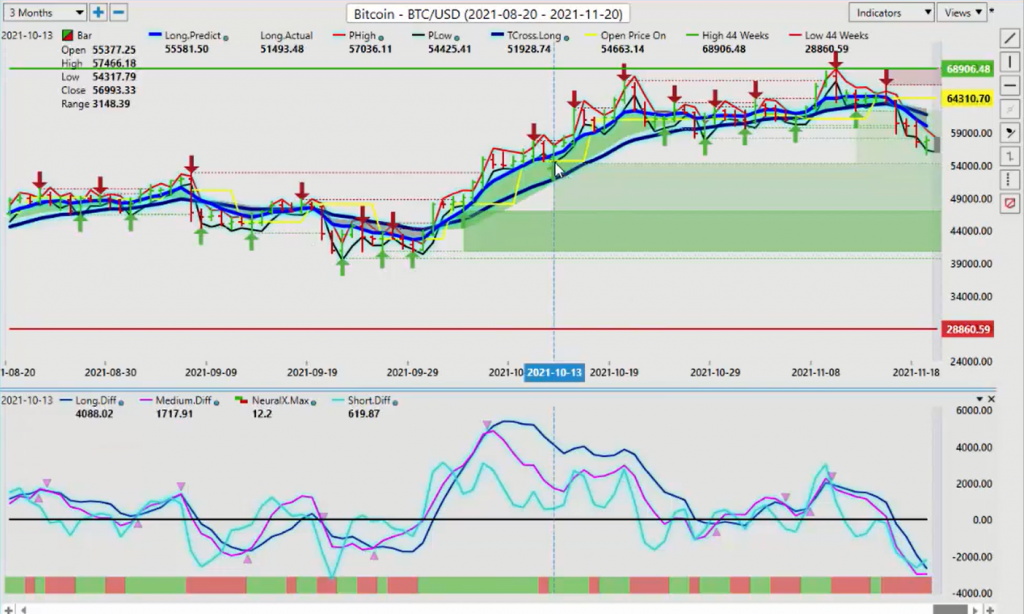
Now, when we look at Bitcoin trading over the course of the weekend, we’ve come down, holding above a major support low at 54,003.17. We worked on this in the VantagePoint Live Training Room this past week. That we would hold as long as we’re staying above this particular level. This is perfectly normal for Bitcoin to take a bit of a pull back. Now, our upside pivot now, because we’ve closed below our long predicted at 60,068 and our T cross long at 61,800. These are two levels that we have to overtake. I would anticipate that we are going to try or possibly will overtake these levels by Tuesday or Wednesday of this coming week. We’re looking for about a dollar strength, even if it’s just corrective. That will push Bitcoin back to the upside.
So to begin the week, we can see that long predicted at 60,068. That’s the key level we want to watch. If we look at our predicted differences, the pink line is flattening out here. So, when it’s gone flat like that, or going flat like this, it’s a warning sign that we’re running out of sellers here, that a long trade is coming. Once again, if we look at our T cross long from this previous week or about a week and a half ago, you can see that when we hit into this level, around 68,900, our MA diff cross to the downside and down we went.
So the same thing that would have some people short this would be the same signal that would have us go long on this. We’re looking for the neural index to turn green and the pink line to cross the blue line. And then, of course, overtake these two very powerful pivot areas, the T cross long, and the long predicted.
Crude Oil
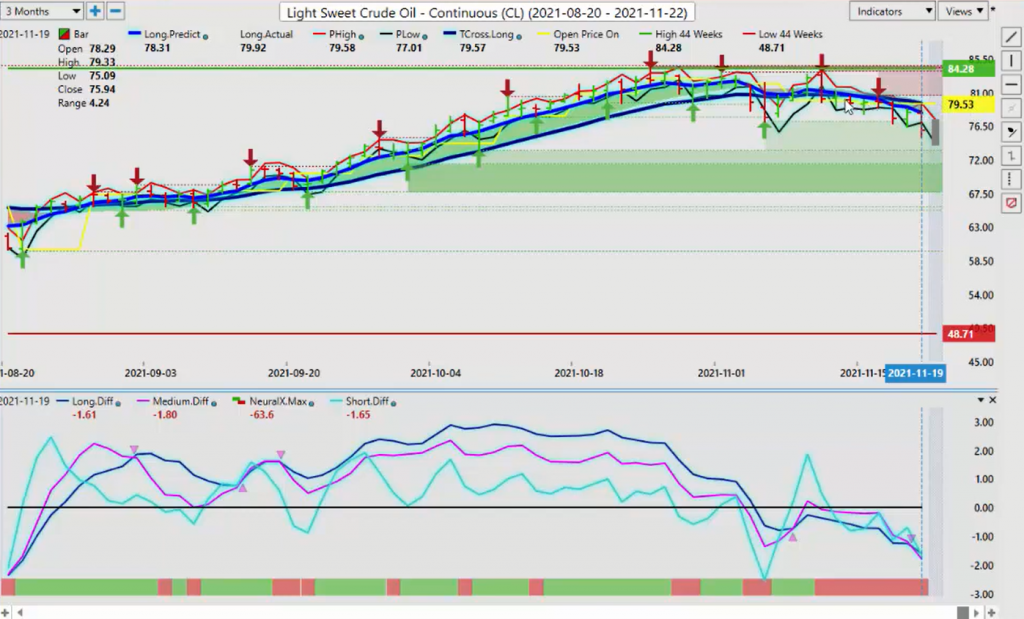
Now, oil prices again, fluctuating wildly throughout the week, but predominantly down to start the week. Now, if we look at our weekly opening price, our point in time set to the weekly opening price, that plays a major factor in whether we go long or short. So we’re closing below the long predicted and the T cross long. Each day we come back up to this level and hit it. So to begin the week, those two main levels that we’re watching are the long predicted, the first one at 78.31, and our T cross long at 79.57. We’re short while below these levels so if we break above these levels, then again, oil will continue its upside move.
As COVID fear start to raise their head again, my optimism on that remains heavily guarded at this time. Our MA diff cross, as you can see this free update in our VantagePoint software, this little arrow here, the pink line crossing the blue line that took place on Thursday, which led to a bigger move to the downside on Friday coming right back up to that long predicted or the T cross long, and then a very dramatic selloff going into the close.
So again, we do have very strong verified support here at the low of 73.29. So watch this level very closely to begin the week, because if equities turn higher more specifically the S&P 500, there’s a strong possibility that the oil contracts will follow.
Euro versus U.S. Dollar
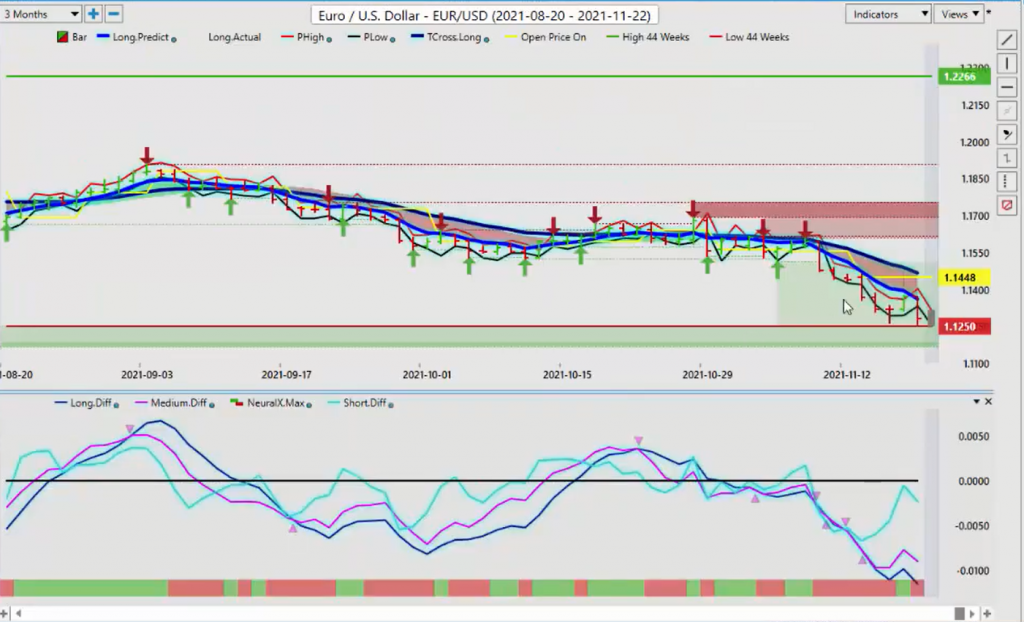
Now, as we look at our first main Forex pair for next week, the Euro-US currency pair, a very, very tough week for the Euro. But again, as forecasting in last week’s weekly outlook, we assess that there are no buyers on the Euro up here, and finally the Euro succumbed to that dollar strength and down it went.
However, we do appears at first glance to potentially have a short term bottom in place around 112.50. But again, we’re looking for that MA diff cross, both of them, to start turning back to the upside. So the seasonality of the weakness in the US dollar in December, that could indirectly help the Euro. But next week, we’re going to have a lot more Fed speaking next week. Any kind of hawkish tone coming out of additional members of the FOMC is going to put potentially additional downward pressure on this particular pair.
So again, these are very repetitive strategies that I’m discussing here. We’ve got our long predicted at 113.59, and our T cross long that’s coming in at 114.66. So you’re hot zone for shorts are going to be between 113.59 and 114.66 provided that is supported by the additional VantagePoint indicators. We’ll also, again to start the week, where we will set our weekly opening price on Friday’s close. That price is 112.81. So, 112.81 will be your weekly opening price going into Monday’s trade. If we continue to hold above 112.81, then that will tell us we’ve got a short term bottom in place and the Euro is getting ready to correct higher. Not necessarily a new trend here, guys, but a corrective move at the very least back between somewhere between 113.59, I suspect, and 114.66.
U.S. Dollar versus Swiss Franc
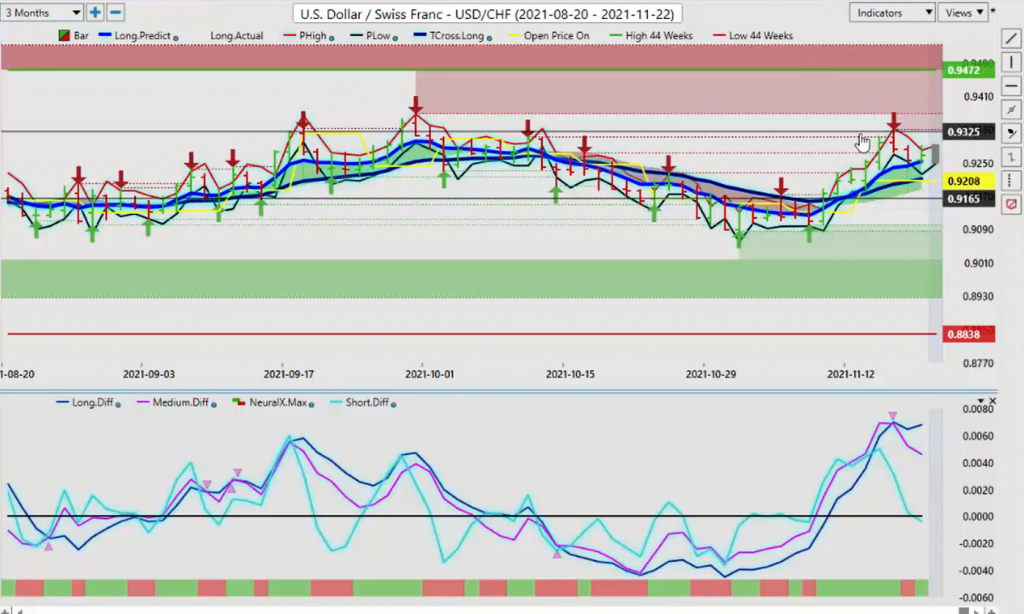
Now, if the dollar index does start to sell off, then US-Swiss franc would also potentially have a short term top in place here too. But again, the Swiss franc is a funny currency. It’s very highly correlated to two things: the gold contracts and the S&P 500. So, if gold continues to move lower and equities go higher, meaning the S&P 500, that will weaken the Swiss franc. Even if the US dollar is not holding its gains, the Swiss franc is unlikely to hold its gains either. So we’ll be watching the T cross long.
The same deal here, guys, very repetitive strategies using these pivot levels, going into trading because again, this is an outlook here, not a recap. We’re looking at next week’s trading. Our key level, 92.53, the long predicted followed by 92.12, the the T cross long. Very important pivot levels. If we’re above that, we’re long. If we break down and close below it, we’re short. But for now, there is a very ominous signal right there. Our MA diff cross is warning us that potential dollar weakness is coming. So again, this is, for now it’s simply a corrective move. It’s not a new trend until such time we break down below the T cross long at 92.12.
British Pound versus U.S. Dollar
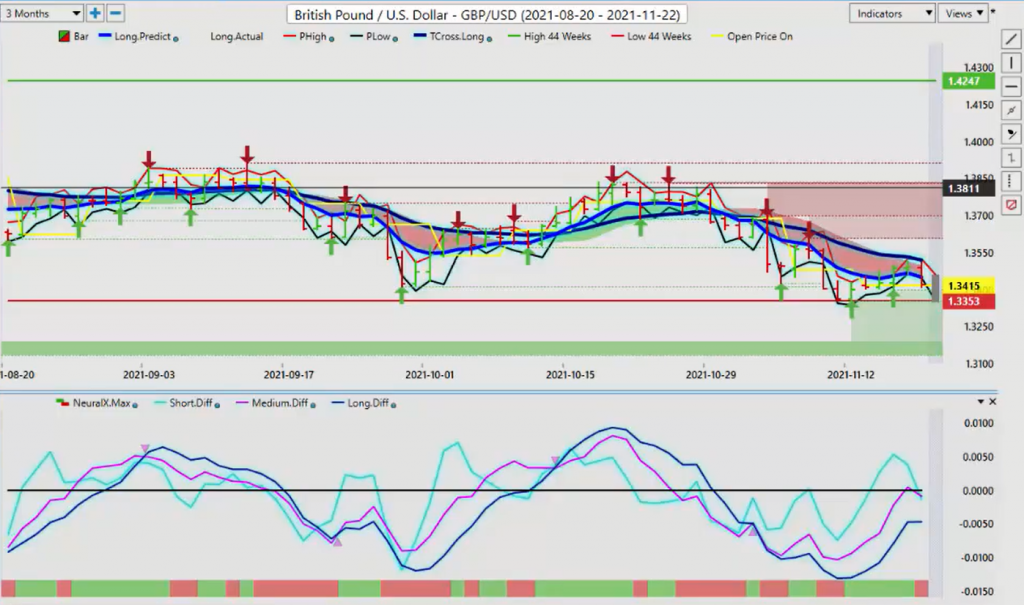
Now, with the British pound, again, it’s struggled, but it’s done far better than the Euro. Now, this is a classic example of the strategy that I’m laying out here using these predicted moving averages as pivot levels in the market. So this key pivot level are, again our T cross long, 135.31. We can see on Thursday and Friday, we came right up to that exact number of the VantagePoint T cross long and failed and sold off. Now, we do have support forming down here, but it’s not that strong. The support I’m talking about is coming off the December 29th low. That number is 134.12. Keep an eye on 134.12 to begin the week. Our predicted differences are trying to rise higher, but they’re stalling out again and it’s starting to roll down. This could be just from that Fed comment was made on Friday, but again, we’re going to have further Fed comments coming out this week and a holiday short week.
So this is a make or break week for the pound. If it cannot get back up above our T cross long at 135.18, then we are likely to see further downside. So watch this level. That’s the line in the sand if you want to go long. Or an additional strategy using the VantagePoint software, is you can put your buy limit orders just above the T cross long at 135.18, say, 135.25. And once we clear that, if we can even clear that, you would then have a pretty easy run, I would anticipate, up to the high of 136.05. But again, first of all, we must clear that T cross long.
U.S. Dollar versus Japanese Yen
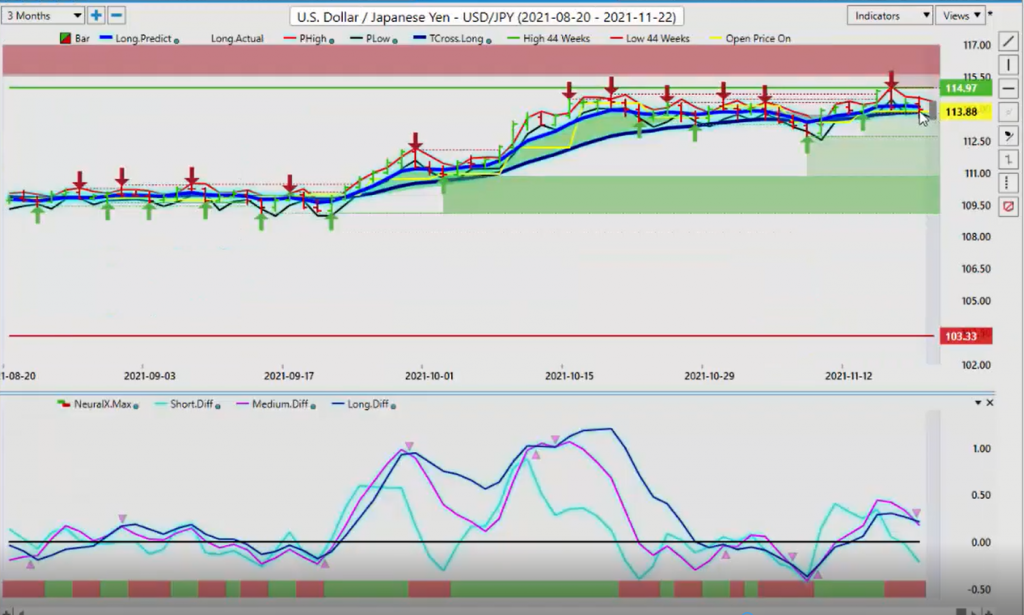
Now, the dollar-yen, again, I suspect it could turn around back to the upside this week, providing gold contracts continue to move lower and equities move higher. The US-Swiss franc and the dollar-yen is virtually the same trade here, guys. Almost identical. So right now, our T cross long, 113.83. We’re closing out the week at about 113.97. That’s our starting point for the week, the weekly opening price. If we’re holding above, I’m going to round it out to 114, then longs are definitely going to be in play. But once again, we see that MA diff cross right there, warning us that we are losing upside momentum. We’re in a very tight channel here. We’ve hit a high this week, all the way up to almost 115 and failed.
But here’s the deal, guys. I’ve seen this before. That would tell me that we failed just under 115. There could be exotic barrier options sitting at that 115 level and they’re protecting the 115 level. If that’s the case, then like a moth to a flame, this thing is going to go back up there until they knock that option out. I’m not saying there is one there, but I suspect that there is. So again, watch your gold contracts. Even if the dollar sells off against some of the other currencies, it could still continue to make gains against the Swiss franc and the Japanese yen. But that signal is warning us that initially out of the gate, the dollar’s going to come under a little bit of pressure.
U.S. Dollar versus Canadian Dollar
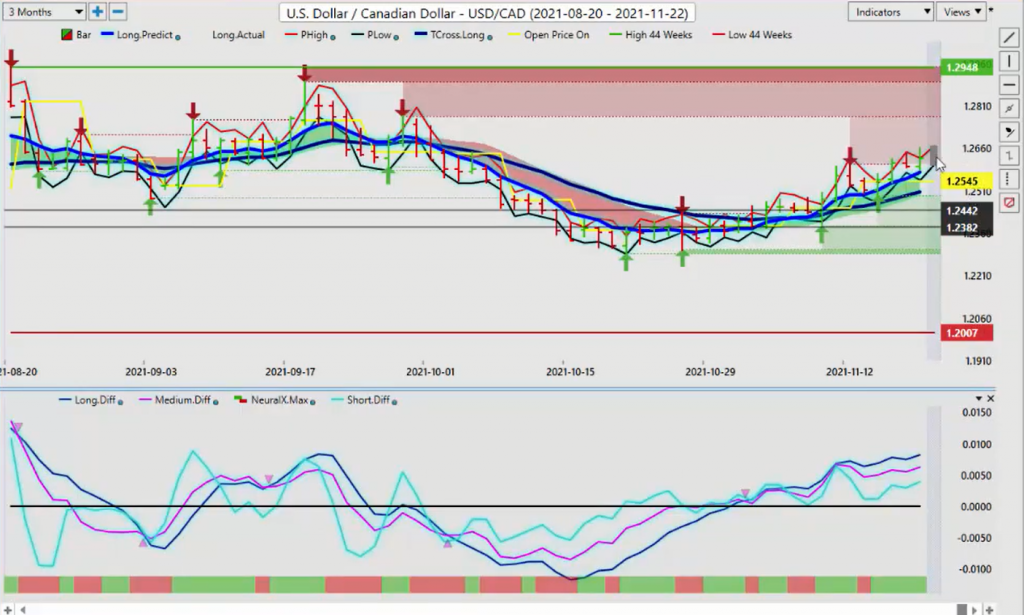
Now, with the US-Canadian pair going into next week, very popular pair to trade. Just be careful with this one. Again, if equities and oil recover, then the CAD is going to strengthen, pushing this back down. Our yearly opening price on the US-Canada pair coming in at about 127.19. They’re still technically a short while below that level because it’s still bearish on the year. But our T cross long coming in at 125.07, we have had rock solid buying off the T cross long and the long predicted at 125.12. The better part of this week. You can see that every single day. We’re in contact with this blue line virtually every day. We’re using that blue line as a pivot level to buy from because the indicators in VantagePoint are saying our neural index is a solid green all week here. But as soon as that neural index turns red and we start failing just below 127.20, that would be a prime opportunity for an upcoming short going into, probably I would guesstimate, around Wednesday.
Australian Dollar versus U.S. Dollar
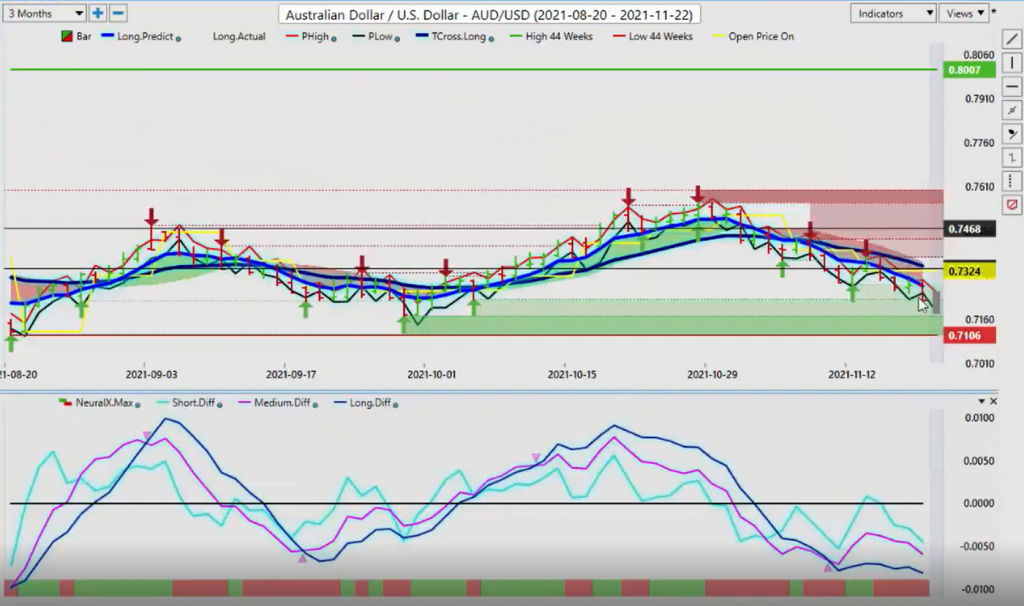
Now, Aussie-US and New Zealand-US, again, taking a real beating this past week but we are coming into some verified support zones. That low is 71.70. I anticipate we could have some kind of a bounce here. But as you can see, we’ve got our MA diff crossing here warning us that we’re losing downward momentum, but we need the neural index turning from red to green. If we turn green, then it’s telling us, that’s the signal we’re looking for, that we’re finding a bottom. So keep try and match for next week the low of 71.70 to a neural index that goes from red to green. But if we don’t get that neural index on board, then be very, very cautious. We could have further downside.
New Zealand Dollar versus U.S. Dollar
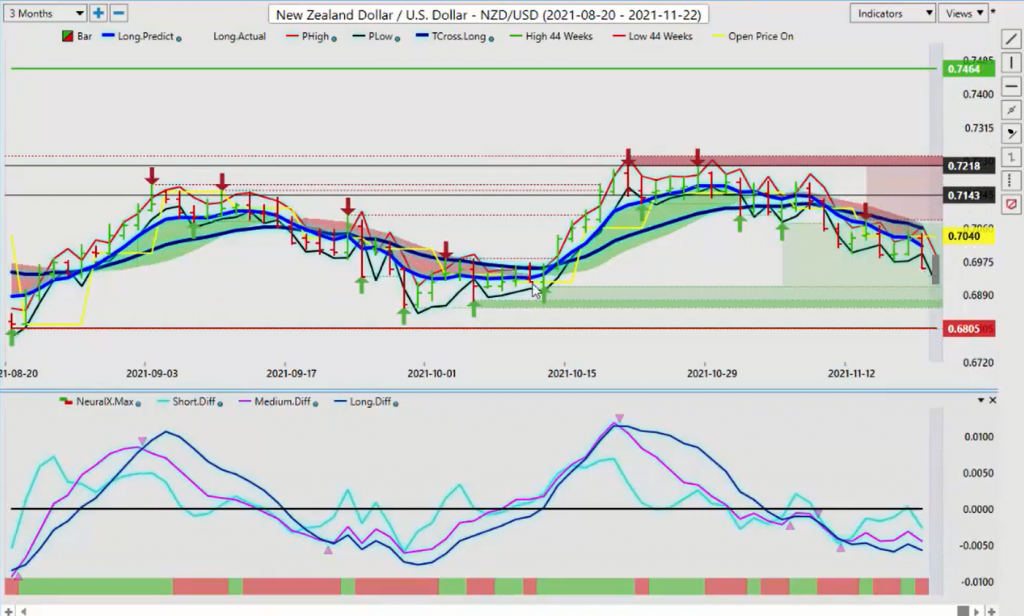
The same thing would apply to New Zealand going into next week. Good strong support coming down here at the low of 69.11, and additional, very strong support at 68.66. But if we can get that neural index turning around, we also have an MA diff cross to the upside here too, down off this low around 69.97.
So, if we can get moving on this thing, I would say that the Aussie and the New Zealand have a chance for a corrective move higher if the dollar comes under selling pressure with that seasonality. So we do have a very busy week, a holiday short week, and a volatile week coming up. But there will be an underlying trend if we identify these key pivot levels from VantagePoint, combine them with our MA diff cross, and of course, that very powerful neural index. With that said, this is the VantagePoint AI Market Outlook for the week of November, the 22nd, 2021.