


Welcome to the Artificial Intelligence Outlook for Forex trading.
VIDEO TRANSCRIPT
U.S. Dollar Index ($DXY)
Hello, everyone. And welcome back. My name is Greg Firman, and this is the VantagePoint AI Market Outlook for the week of November 14, 2022.
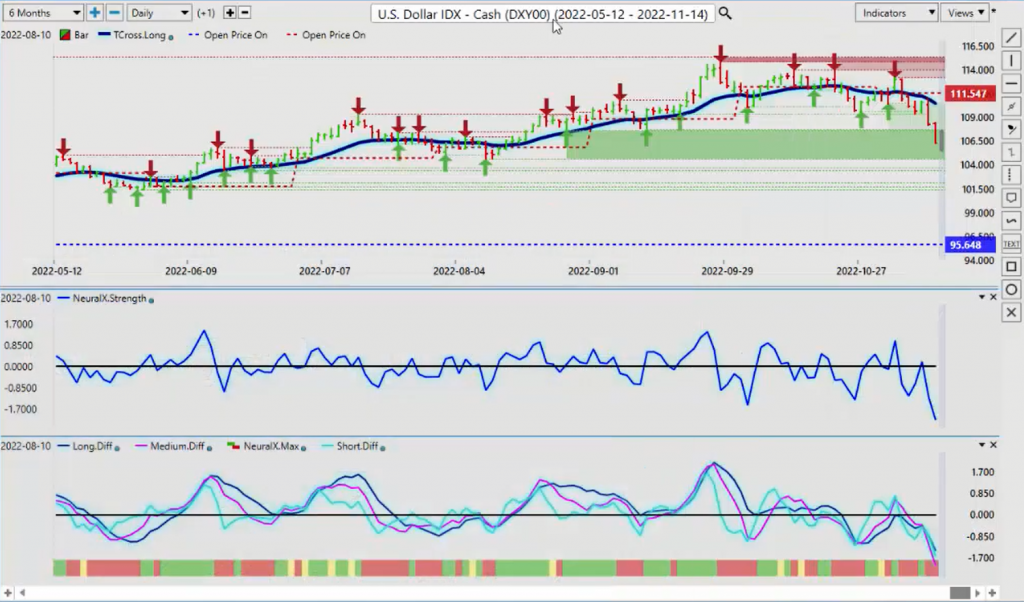
Now, to get started this week, we’re going to begin where we always do with the US Dollar Index. Now, the dollar surprisingly coming under heavy selling pressure when in actual fact the inflation numbers moderated slightly, but certainly not enough to change the Fed’s course. The Fed has been absolutely crystal clear on his inflation targets. And again, after all of these rate hikes, inflation has only come down about 1.3%. So this suggests profit-taking. The media’s spinning that CPI number a little bit. But again, only in my respectful opinion, nothing in that CPI report will change the Fed’s current path, so to speak. He may hike less at 50 basis points, but he’s been clear that he’s going to keep hiking. It’s going to be higher rates for longer. So these are his words, not mine. And until such time as he changes those words, then the dollar is likely to remain firm.
Now, we did have a holiday, short week last week. That would’ve triggered some profit-taking. So we shall see if the dollar can actually rebound here. Now, we’ve got a significant low, the verified resistance low, that’s coming back into our August 10th low, which would be approximately the 104.63 area. And that would leave us in this broader overall range of the Dollar Index. The indicators are definitely oversold. That doesn’t mean it can’t go lower. But again, I think it’s more what we have to wait and see here now is when real money comes back into the market by end of day Monday or Tuesday, whether the same people are profit-taking are looking to get a discount to go back into dollar longs. This is what we would watch for.
Now, our T cross long coming in at 110.44. The further we move away from this number, the more likely it is we’re going to retrace back to it at some point, sooner rather than later. The economic calendar is very light next week. I believe most of it’s out of the UK next week. I think that largely, the only real number that is concerning I think is on Thursday, which would be the US retail sales. But again, when we look at this, we do need to remember that the yearly opening price on the dollar 95.68. The dollar is still in a significant up trend, but there’s been a lot of heavy buying based around the Fed’s announcement. And again, nothing in that CPI report, in my respectful opinion, will cause the Fed to pause or the infamous word pivot. Neither one of those two will happen in the month of December.
Now, when we look at this, most of your major asset classes have benefited from that dollar sell-off or what I suspect could be dollar profit-taking.
Gold
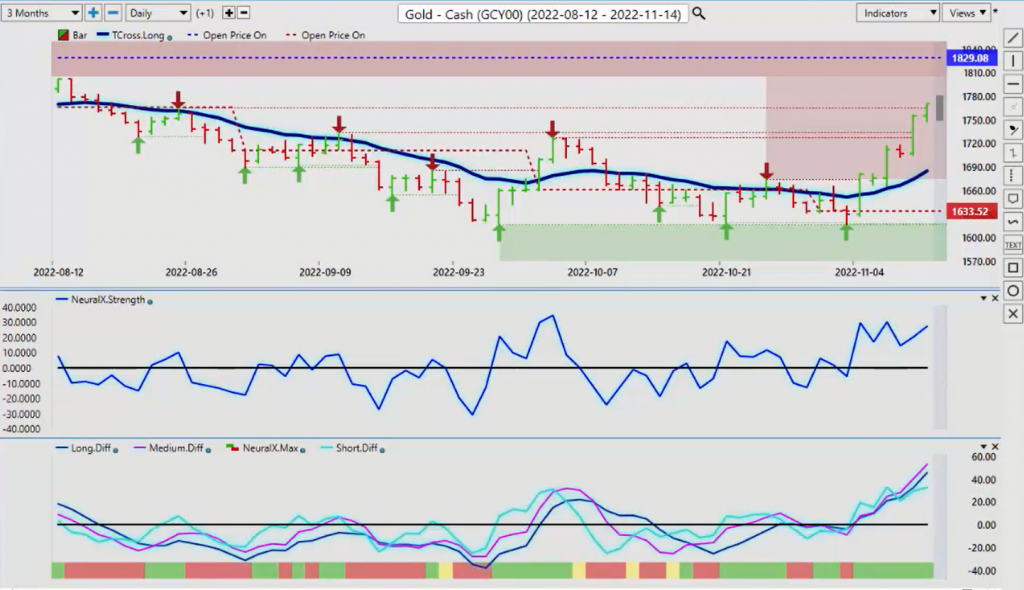
So when we look at this, gold making a bigger move up over the last few days. This, if anything, points towards a potential recession in the US or globally, we shall see. But for now, we’ve had a significant verified resistance high. That coming in at 1764. This is the level you want to keep your eye on this week. Gold still in a significant down trend on the year. 1829 is the yearly opening price. But as you can see, holding above the monthly opening price this past week, the market actually used that monthly opening price to springboard up. Once we crossed over the VantagePoint T cross long, we were traced back to it and then accelerated higher.
But I’m not convinced that gold has a lot of legs up here until we see how the market’s going to digest the CPI number for last week and whether they’re going to look at that number and say, “Well, you know what? I’m not sure that anything has actually changed here. Should we be long gold? Should we be short, the dollar? Should we be long equity?” This will be the question that we will have to monitor. But without any significant economic releases next week, then we’re likely going to see sideways trading.
But again, gold I think will struggle to advance from here. Gold, usually the seasonal pattern is gold is stronger in the month of December when the dollar is weaker. So there is the possibility this is happening earlier than normal. But again, would this have happened without the market’s interpretation of that CPI number? I would have to say probably not.
S&P 500 Index
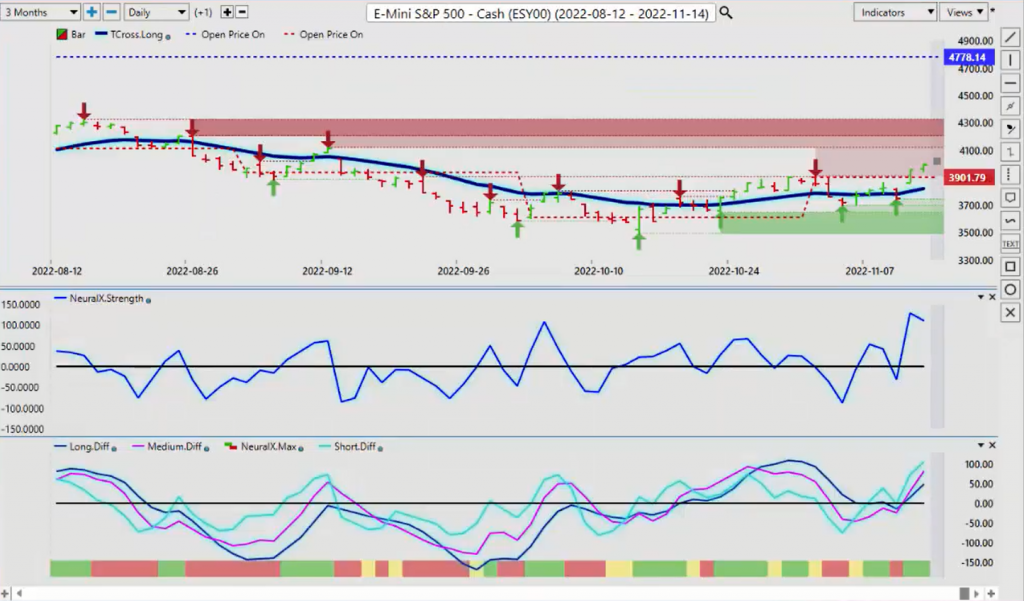
So when we look at that, we also want to cross- reference this to this big move that we’ve seen on the stock market. But we have to remember that we had a big move down first before we had this surprising move higher. But as you can see, in the month of November, the S&P 500, our monthly opening price here comes in at 3901. So closing at the high of 4000. We’ve only been above the monthly opening price or positive in the month of November for actually two days. And we’re coming up to even more significant resistance here at about the 4119.
But again, we want to see how the market reacts once they’ve had a few days to digest the CPI number and they look a little bit closer at it. That would be my argument that, again, very little has changed. And with the amount of rate hikes that we’ve had to only bring inflation down that very, very small amount of about 1.3, 1.4%, I believe, it certainly doesn’t support the Fed pausing or changing his path anytime soon.
So I think right now we have a shot, at least a shot of 4119. But again, I think the equity markets still are in a very, very substantial downtrend. When we look at this over the last nine months or even over the last year, you can see here going back into this, there’s the beginning of the calendar year using the point in time indicator from VantagePoint, the S&P 500 has actually never been positive on this calendar year. This is the first time I’ve seen this in about 15 years where the S&P was only positive for couple of hours in 2022. The rest of the time it’s been going significantly lower, consistently making lower lows and lower highs. This is not me. This is not opinion-based. The charts are very clear in this.
So you can see we have a significant amount of resistance that the S&P would have to overtake. The top of the current range, I would argue, likely around the 4300 mark, but long before we get to 4300. You can see that we have the staggered at 4037 is strong resistance, 4062 is very strong resistance, and then we come up here and then we have 4302, if we can even get this high, that’s likely where we would fail.
But again, we’ll keep an eye on it this week. But the main intermarket correlation that everybody needs to understand here is dollar down, stocks up. So the dollar turns back up, the stocks will go back down either way. That is what we need to keep a very, very close eye on.
Crude Oil
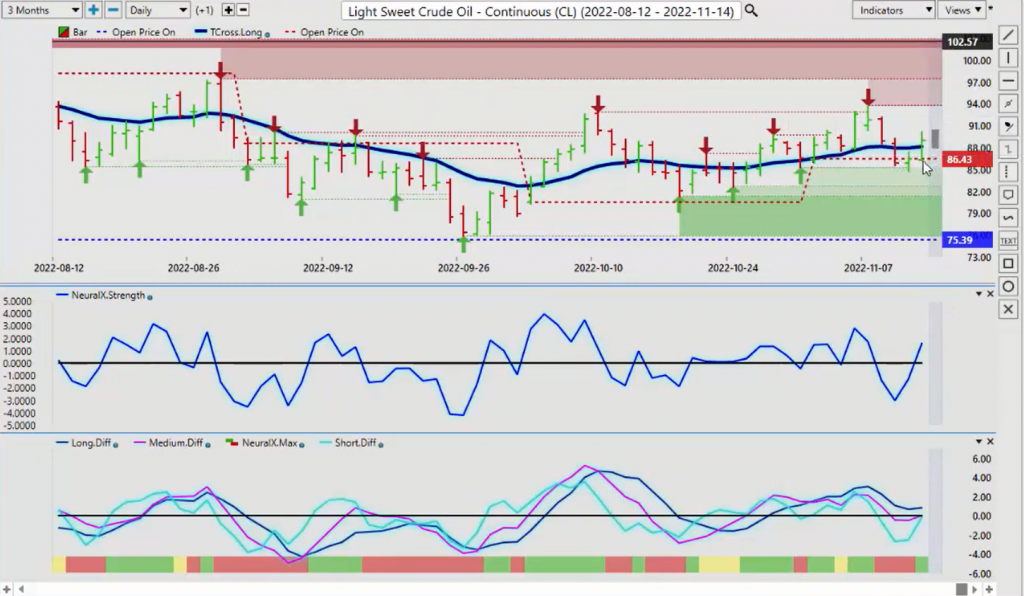
Now, oil also benefiting from that dollar weakness. As you can see, all of these asset classes are inversely correlated to the dollar or the Dollar Index, the dollar in general. So if the dollar turns back to the upside, stocks down, gold down, Bitcoin down, oil down. This is the game, guys. This is the current market conditions we’re dealing with. So right now, oil has managed to creep back over on a Friday trade. But remember, the bond markets were closed on Friday. A lot of the banks were closed on Friday. So a lot of these big moves we’ve seen against the dollar came on late-day Thursday and Friday. And if you see a big move like this on a Friday, very seldomly is there any follow through by Tuesday. We see the same fake move going into Monday, then on Tuesday we reverse. So again, the indicators here are still supporting longs on oil at the current time, but we need to hold above that T cross long at 88.14.
Bitcoin
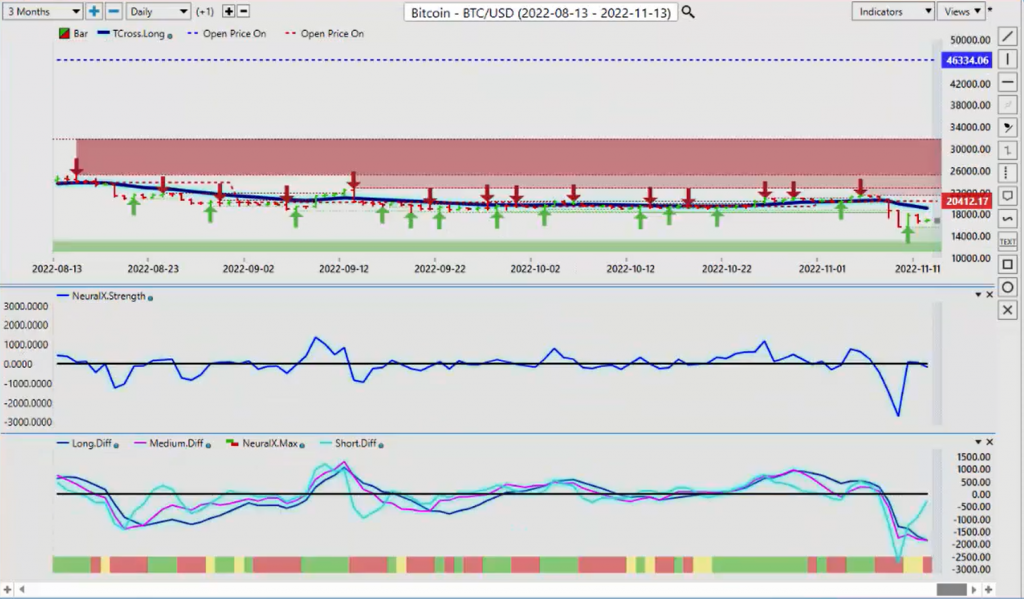
Now, when we look at some of the things happening in Bitcoin, it was, I guess I would have to say somewhat comical when they said that we… I was watching Jim Cramer on TV saying, “Oh, Bitcoin, I never… First of all, he said he never bought it at all. Then he said on Thursday that he did buy it, but he was just playing on momentum and see, I told you it was a scam and blah, blah, blah. But then Bitcoin turned around, and as you can see turned around and actually rallied right back up after they said that. Bitcoin had hit a low of 15619, and then rallied almost $3,000 after that when the stock market rallied.
So you still have that intermarket correlation between Bitcoin and the global equity markets. So if the equity markets do turn higher, then Bitcoin will still likely follow. But if the stock markets turn back down, which I suspect they very well might, then that would put additional pressure on Bitcoin.
We’ve broken down through this channel, but we’re lingering around that particular area. So once some of the issues get resolved, I think that either way, if stocks go back up, there’s a high probability that Bitcoin will follow because that’s been the intermarket correlation. Bitcoin’s been about 95%, 98% correlated to the S&P 500. And this again, even with all the turmoil that’s going on, you can see that it immediately responded positively by a stock market rally.
So right now with Bitcoin, our T cross long 19039, still in a down trend. While below this, you can see that our yearly opening price 46300. The monthly opening price is the one we really want to keep our eye on, guys, 20412. So you’ve got a significant gap between the monthly and the yearly opening price. And this particular setup is certainly bearish. And Bitcoin notoriously doesn’t do that well in the latter part of November and December anyway. So I would expect a little bit more downside here. But I’m going to be watching the medium-term, long-term predicted cross to see if I can get across back to the upside, because if I get that, that would also tell me that the global stock markets are going to turn back up if Bitcoin does.
Euro versus U.S. Dollar
Now, when we look at some of our main Forex pairs, I think that once again, the market gets ahead of itself, you get a slightly softer print on that inflation data. But I think what we really need to ask ourselves here, is anything changed in the eurozone? Have they magically fixed their energy problems? Has the UK fixed their energy problems? Is their economies doing better? Are any of these things happening across the pond? I think the answer would be a hard no, they’re not. None of that has changed over there. And the Fed still has the advantage over the Bank of England and certainly over the ECB.
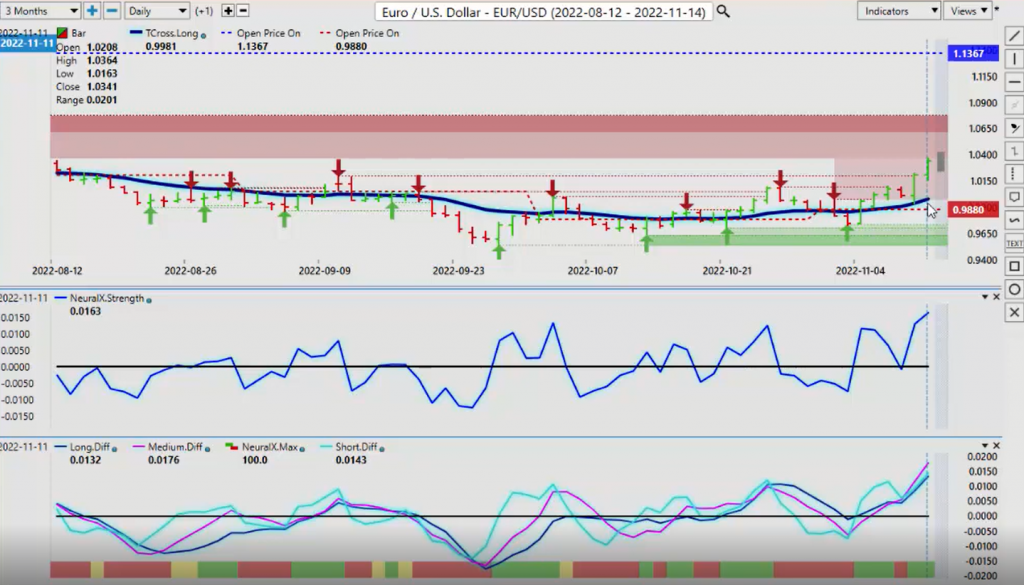
So when we look at this, again we want to question, is this just a stop-loss hunt in thin illiquid markets? We’ve closed the week at the high. We’re closing out about 1.0341. Now, our VantagePoint T cross long is coming in at .9981. So once again here, be cautious of a bold trap up here because once again, I’ll reiterate this through the presentation that I’m not quite sure that they’ve really looked close enough at that CP data and looked close enough at what the Fed is actually saying. And he was quite aggressive in his last press conference when he said, “I’m not pivoting. I’m not pausing. Stop saying that.”
And sure enough, within a matter of days, the media’s back at it again. So I can’t stop them from saying what they’re saying, but I can point out the actual facts here, right? So nothing has changed in the eurozone. So my strong advice would be to be cautious up here because I’m certainly not convinced that the problems in the eurozone are fixed.
So our indicators, they’re definitely overextended. I don’t like to use the term overbought and oversold. Overextended, yes. The further that we move away from the VantagePoint T cross long, the more likely it is we’re going to retrace to it. So we’ve made a big push off of that level. But if we look at the primary trend on the Euro, 1.1367, the Euro is significantly down still on the calendar year. We’re coming up into some additional verified resistance. But the break of this verified at 1.0221, I would anticipate a retest of this level very early in the week.
U.S. Dollar versus Swiss Franc
Now, if the dollar does turn back to the upside, once again, you can see that the bulk of the dollar losses came on Thursday and Friday. But remember, guys, the bond markets were closed. A lot of the big banks were not in there on Friday. So you have thin illiquid markets. When the cats away, the mice will play. So right now, the Swiss Franc, .9109 is the yearly opening price. So potentially some very good long opportunities coming up if the dollar turns. And this would be one of those pairs.
We have the additional verified resistance down here coming in around approximately the .9350 area approximately, or actually I’ll rescind that, excuse me, about the .94 area. So the VantagePoint predicted low at .9314, could be some opportunities to start the week. Let all markets come in, if everything looks good, because again, we’re grossly overextended on this. And it’s extremely important to point out the fact that the bulk of these losses came in thin illiquid markets.
British Pound versus U.S. Dollar
Now, with the UK, once again here, guys, you have to ask yourself from a fundamental standpoint, because fundamentals in trading still matter, has anything changed in the UK? Are they avoiding an energy crisis? No. Is the Bank of England, is the government, they’re changing leaders like we’re changing our underwear here. So this usually doesn’t bode well for a currency.
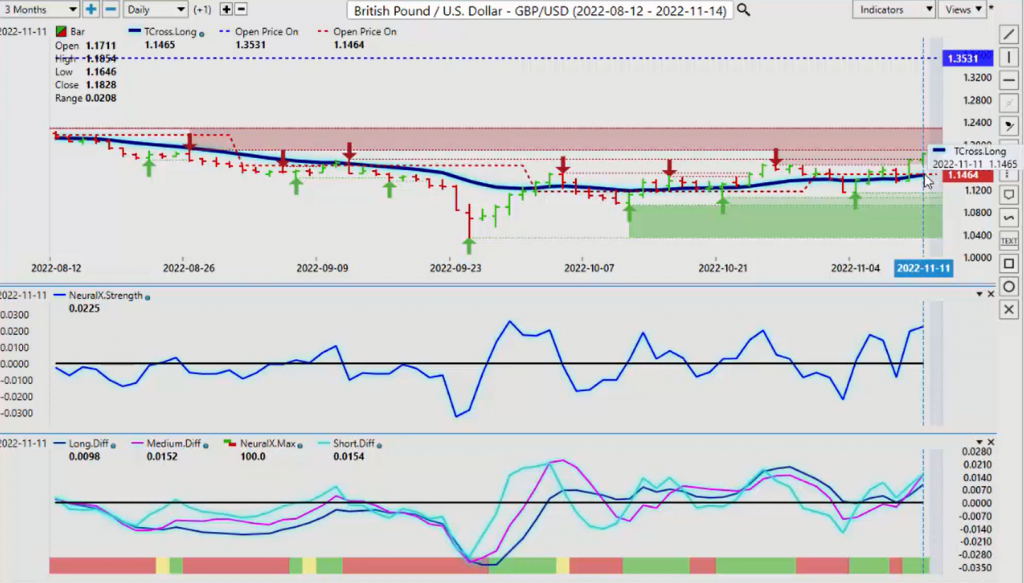
So the pound, once again, has made significant gains on thin illiquid, likely profit-taking. So again, we’ve got a verified resistance high, and I would suggest if nothing else here, guys, caution coming into this area. This high that’s coming in about 1.1730. Then we have this additional verified resistance up here, and that’s about 1.1896. A scenario that I’ve seen with this pair, like US/Canada, many times is that we go higher or we follow the trend from Thursday and Friday into Monday, but then by early Tuesday it starts to violently turn the other way. And this is the classic setup of a bull trap.
Because again, when we look at the Fed, we look at the CPI number, then we look at the Bank of England, we look at the winter coming, the potential energy crisis, we’ve got a lot of things going on here, which in fact, very little has changed. So certainly I would love to short the dollar more than anyone, but that has been a very difficult trade this year. And I don’t think the pound is out of the woods here.
So be very cautious around the 1.19 mark. If the pound is going to turn, then that is likely where that’s going to happen. The indicators here are suggesting more upside, but keep a close eye on your Neural Index Strength indicator because the slope of that Neural Index Strength often paints a very different picture than what the Neural Index itself does, meaning green and red. We can actually visually see inside that Neural Index and see if momentum is pointing up or momentum is pointing down. Right now, we’re still looking at a little bit of upside. That would be consistent with Monday trading.
U.S. Dollar versus Japanese Yen
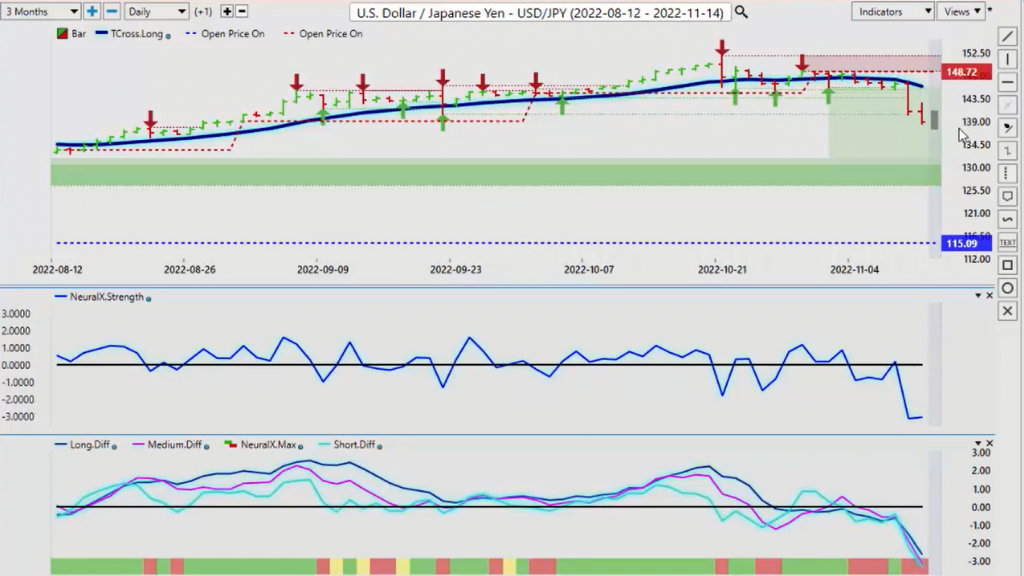
Now, when we look at the dollar/yen, the dollar/yen finally coming into some selling pressure here. But once again, the bulk of these losses came on Thursday, and then a little bit of minor follow through on Friday with the bond markets, the banks closed. But that low, that verified support low I would be watching this very closely around this 140 area because again, the Japanese yen is nothing more than a funding currency here, guys. The Fed, the interest rates, they all favor the US dollar. Yes, this has gone up a crazy amount because of the Bank of Japan, there’s all these other factors, but this is still, the yen is nothing more than a funding currency in the carry trade, meaning the interest rate differential between the US and Bank of Japan is huge. So they’re only looking to use the yen as a funding currency, meaning buy dollars, sell yen, get paid interest every day times three on Wednesday. That’s what they’re looking to do. So there’s always that probability or that possibility it’s going to turn back up.
The yearly opening price 115.09. A very, very strong up trend, so you want to question how much you want to bite this. But keep an eye and see if we can retake this 140 level. We’re closing out at 138.74, but this pair could turn higher very, very quickly.
U.S. Dollar versus Canadian Dollar
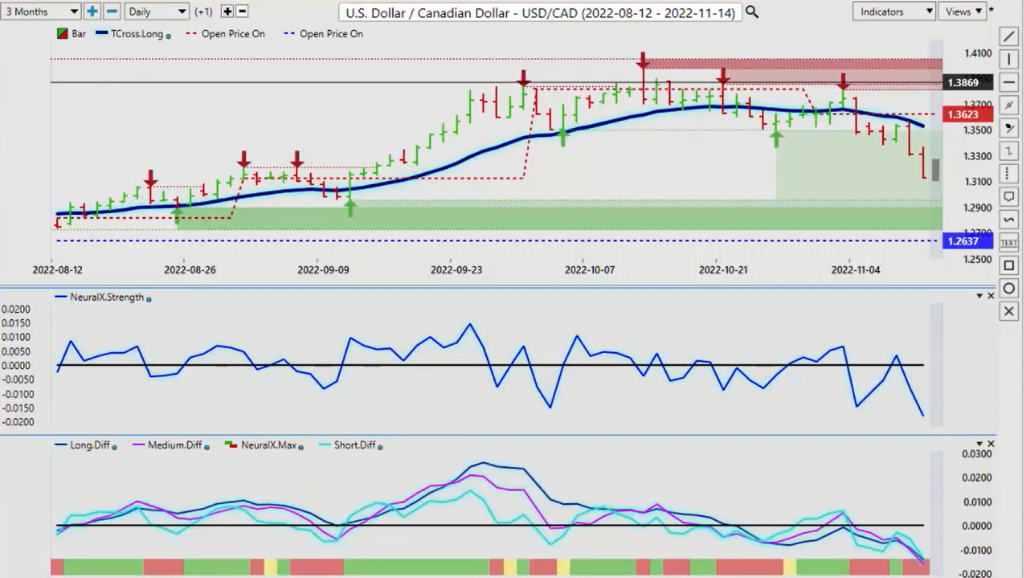
Now, when we look at our three main equity-based currencies, I don’t even call these commodity currencies anymore, guys, because they’re simply following the S&P 500. So when the S&P 500 made a big push to the upside, that’s what sent US/Canada lower, plain and simple. Oil, yes, that helped. But this is the big one here is the S&P 500, the correlation. You’ll see the same thing with the Aussie, the same thing with the Kiwi.
So right now, we’ve made a big push off of the VantagePoint T cross long, but that level is 1.3531. We’re overextended on the month. The Bank of Canada is already blinked. I don’t think the Fed is going to blink here at all next month. Based on his press conference, this one we just saw a week or two ago, I don’t think he’s blinking at all. In fact, I think the volatility around the December meeting is going to be potentially unprecedented. But I also think that the Fed is going to say, “Look, I didn’t say anything that these media pundits said. This is what I said. This is what we’re doing. Nothing has changed.”
Now, we are going to get another CPI print before that Fed meeting. But once again, the CPI is lagging data no matter how you look at it. So things could change very quickly the closer we get to December. But right now, US/Canada 1.2637. This is in a very strong up trend this calendar year. So a little bit of profit-taking. But once again, most of these pairs are overextended from last week.
So the next verified level of support is around 1.2953. I think we may have a shot at hitting that early in the week, but I also don’t think it will stay there for long. It will likely start turning back up. So again, this will be dependent, to be clearer, on what happens with the global equity markets. If they turn higher, that is what will push the US/CAD down.
Australian Dollar versus U.S. Dollar
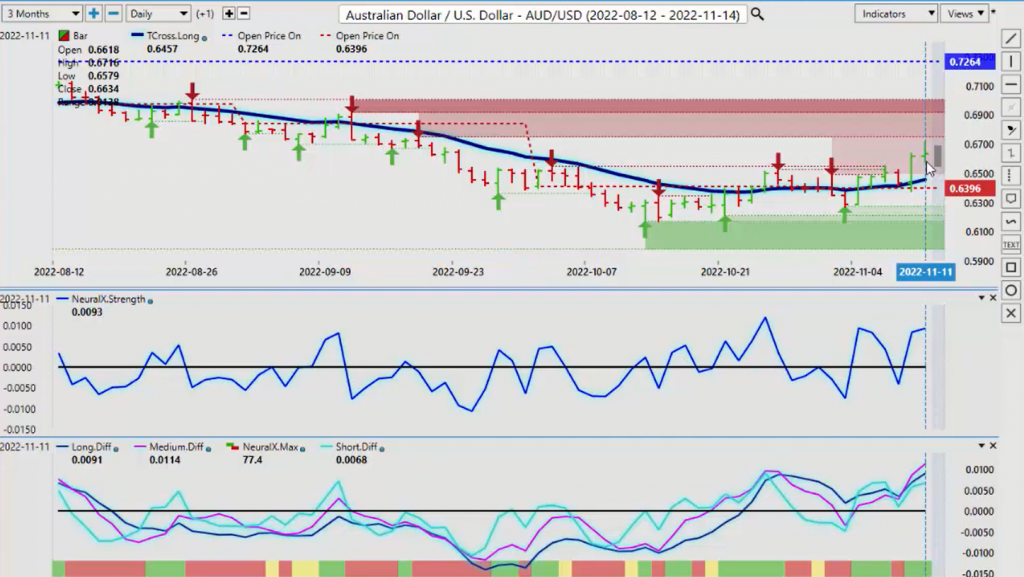
The same thing what will happen with Aussie/US. If the global stock markets rally, continue to rally, then the Aussie will go higher and the US/CAD will go lower, New Zealand/US will go higher. So right now, we’ve got a pretty significant target up here, guys, .6747. We’re closing the week out at approximately .65. So this verified resistance high, you can see that they pushed into that on Friday, and then soon as it got near it, it immediately backed away from it.
So this level, in my respectful opinion only, we need to make a sustained break of .6747 and we need the global equity markets moving towards the 4300 mark to support Aussie buying.
New Zealand Dollar versus U.S. Dollar
The same thing would be applicable specifically to the Kiwi against the dollar. That verified high coming in at .6161. But again, I think that the New Zealand has a slight edge over the Aussie this month because of the selling in Aussie/New Zealand. But either way, both of these pairs need the S&P 500 going up. Both are overextended at the current time, as is US/Canada. So it will be a very, very interesting start to the week.
So with that said, this is the VantagePoint AI Market Outlook for the week of November 14, 2022


