Register for a Free Live Training
The Hot Stocks Outlook uses VantagePoint’s market forecasts that are up to 87.4% accurate, demonstrating how traders can improve their timing and direction. In this week’s video, VantagePoint Software reviews forecasts for Wolverine World Wide($WWW), Microsoft ($MSFT), Electronic Arts ($EA), HESS ($HES), Baker-Hughes ($BKR), and Workday ($WDAY).
Hello again traders and welcome back to the Hot Stocks Outlook for June 3rd, 2022. Hope y’all are having a excellent week out there in the financial markets, and as always plenty to cover here in today’s outlook. Now we’re going to start out with shares of Wolverine Worldwide. We’ll also revisit Microsoft here. We’ve got EA. A couple of energy companies here, and lastly, we’ll go ahead and end on Workday and really highlight really the differences in some of these socks that we’re seeing throughout the market.
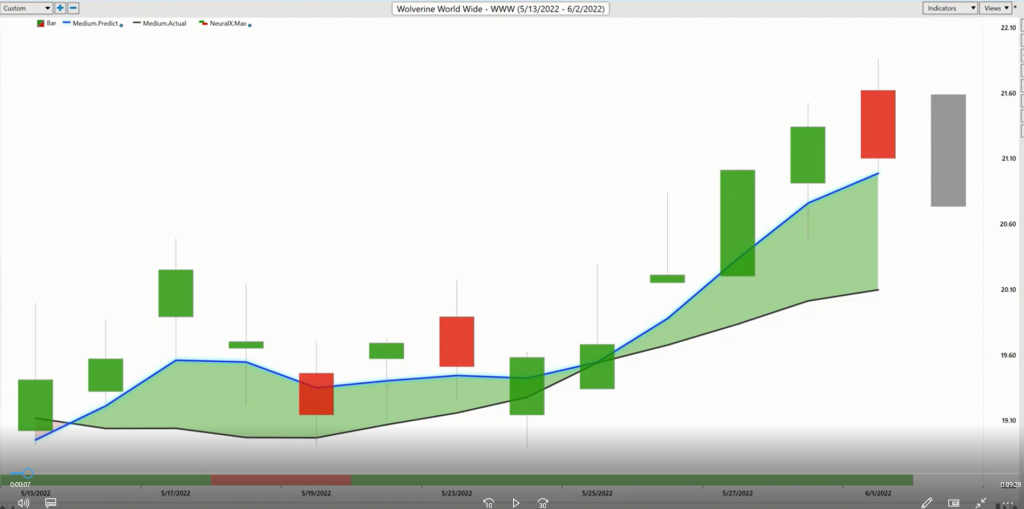
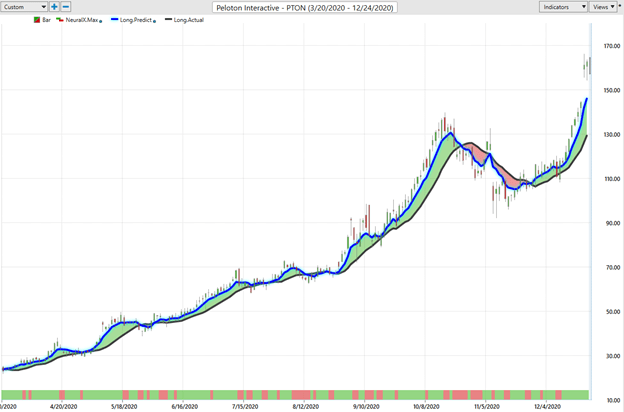
So starting out here with shares of Wolverine Worldwide, what we have here is daily price action. Just like every week, all of these bars and candles represent a full and complete trading day and you can see this is going back to about mid-May. So right up against that price data, though, you’ll notice that there is a black line there and also a blue line. So the black line that you’re seeing on the chart is actually a simple moving average. So it’s a very common technical indicator. In this case, what it’s doing is actually looking back over the previous 10 close prices, adds those all together and divides by 10. So that smooths out the market data for us and lets us know where market price has been over a given period of time.
But obviously a trader wants to know where is price going next? So what we’re able to do is actually compare a couple of things. Well that black lagging moving average, that simple moving average, we actually compare that to this blue line. So for that number to get plotted and calculated against the chart each and every trading day, this is where Vantagepoint’s proprietary technology of artificial neural networks are performing what’s called intermarket analysis. So it’s looking at relationships between markets and it uses that information to generate highly accurate predictive forecasts.
So in the case of Wolverine Worldwide, what these neural networks are able to do is look at things like the S&P 500. The dollar index is rattling around the S&P broadly and stocks. We’ve got things like ETF groups. We’ve got other individual stocks in this space, as well as global interest rates or oil prices. So all of these things are factoring into the markets that you’re trading. When you have a tool like this, that’s able to update every single day, understand those nuances and give you a extremely accurate prediction of where are things headed next.
So in the case of Wolverine Worldwide, as long as that blue line crosses above the black line, it’s suggesting that those average prices are going to move higher than where they have been in the past and you might want to look to take bullish opportunities here. Now, in addition to that predicted moving average, you’ll notice that there is a bar here at the very bottom of the chart, and this could go from green to red, back to green, but this gets updated every single trading day. So we get the close of the day, you’ll get a new prediction here. What this neural index is predicting is very short term strength or weakness over the next 48 hours. So just two trading days, short term strength or weakness, and it gets this right with an extremely high level of accuracy, upwards of 80 plus percent, 86, 87% in some cases.
So you’re getting it right about four out of five times there. So what traders can do is really use the combination of these tools to understand the overall trend, but also when some short term weakness may rear its head within that longer position. So as long as you pair… What are you going for with this trade? What is your trade style and timeframe? You can pair these tools to help you make these better decisions.
Now, lastly, and what we look at every week is actually a predicted high and low. So neural networks are really great at solving different problems. So as a trader, the problem is what’s the predicted high going to be? What’s the upper portion of the range? What about the low? What about the next 48 hours? What about average prices over that span? This is how this technology is solving all these different problems for the trader to make better trading decisions. So when we go ahead and bring up those predicted highs and lows, we can actually see how accurate all of these predictions are against the actual market data.
So when you understand that, okay, well, here’s a stock that’s moving higher. If I want to buy, might want to look towards these predicted low levels to accumulate a position. Potentially when you notice that hey, the S&P in Microsoft, a lot of stocks are actually looking really bullish. You’ve already got a stock on your radar that is in an up trend, looking strong. Especially over that time period, strong neural index, strength to the upside, and you see you really get an acceleration as far as that overall trend.
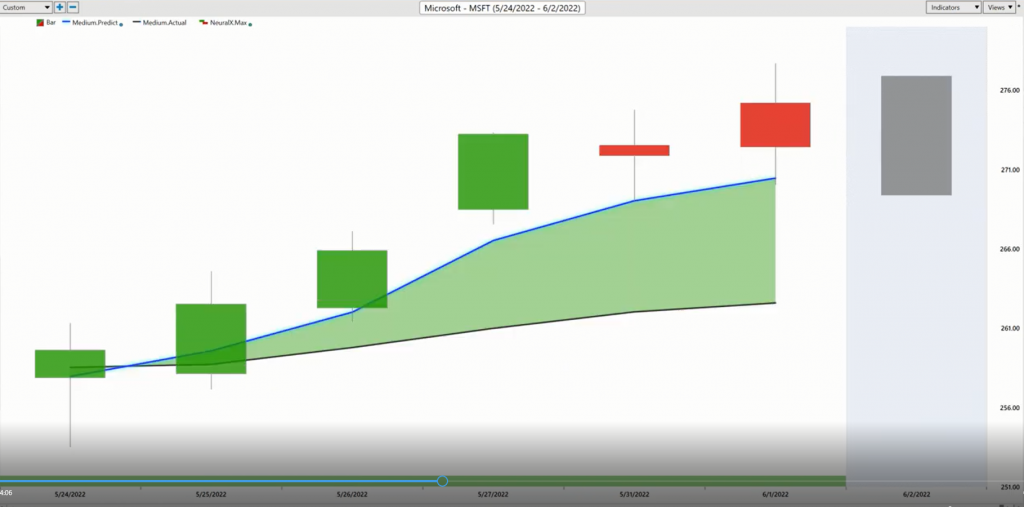
So let’s move on to Microsoft. Again, just highlighting from last week, seeing that, okay, well, we’re starting to see stocks move higher in these things breaking out. We can use this to not only recognize the broad based strength in the market, but potentially trade Microsoft directly if we so choose, but you have the opportunity to pick really whatever market you want to trade that may come through the IntelliScan. So you can really pick your spots and try to find the absolute best opportunity where those forecasts are the strongest. I just bring this in the highlight that we’ve had this nice run up and you’ve seen the S&P 500 run up, and this volatility around really the dollar index more recently as things rattle around or go sideways, but you’re seeing a lot of bullish trends here.
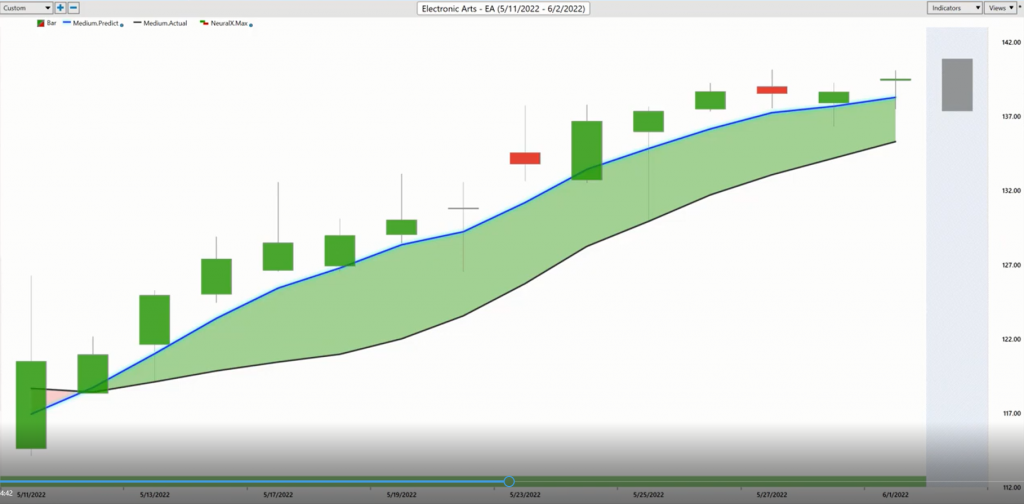
Here’s Electronic Arts. Again, just sticking towards that adaptive approach. So you got to get into a market. You may have to make some adjustments while you’re in the trade, but you want that accurate information that says, okay, well, should I expect some weakness? Are we expecting more strength? What are those predicted highs and lows looking like? Before every trading day, you have this level. So at 6:00 PM the night before you have this level for the next trading day, in addition to the predicted high, if you want to go ahead and take profits. But you really have an excellent tool that if you’re using the information that says, okay, well, Electronic Arts that’s in an up trend, the neural index stays bullish here. So not even a wink of weakness here in this stock, even while there’s certainly been a lot of volatility in shares generally, but really nice opportunity there in EA.
You got to be selective here. It’s not that every single market is moving higher. We we’ll take a look at Workday here and there’s certainly a broad list of markets that are not really in up trends here, but you got a 15% rally in shares of Electronic Arts. So even speaking the last week with Microsoft, if you’ve had been short in previous months, you have a lot of short opportunities in the portfolio, cover and try to short at better levels and make those adjustments. If you get better level shorts in the forecast update and say, look, you shouldn’t stay short here, you can make those adjustments and even position to the long side. Get some things bullish.
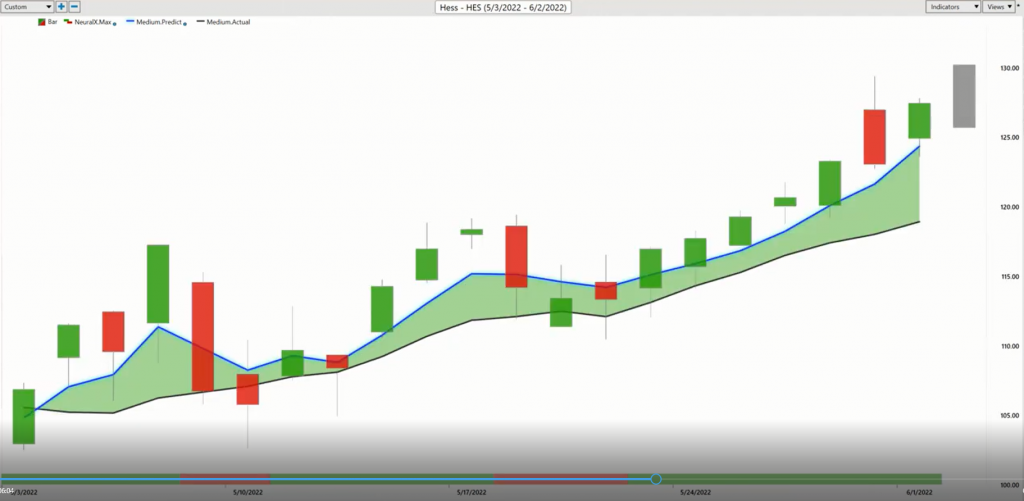
Now here’s energy and just a couple of energy stocks where certainly if broadly stocks aren’t doing well, well, energy’s doing well and that’s where you’ve seen a little bit of an uptick here in shares naturally. But this is one of these obvious sort of correlations where it’s like, look, when you’re trying to trade something like HES, that’s going to be driven by the S&P 500, the dollar index, crude oil futures, natural gas prices, heating oil prices. All of these things factor in and this is what’s making these updated forecasts for the traders so they can understand, look, energy’s looking very bullish. You see, we constantly look at these days where sometimes it looks like you’re coming way out of the range there, but you’ll often see that you’re just moving right to the previous days’ predicted low. Sometimes you get all the buying in one day and then all the selling the next day. But the overall trend, you see updated forecasts do a very good job here of updating this and getting you back on track.
So you understand hey, where is there strength in the market? Where should I look to be a buyer inside of that strength? Where should I be looking at these predicted loads to get the best entry possible?
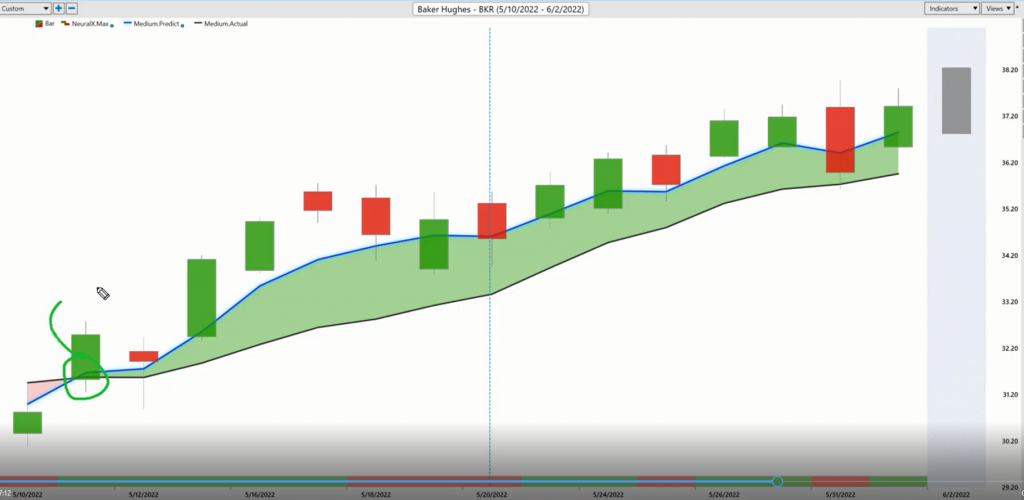
Baker Hughes is going to be very similar because that’s how things work. There’s these relationships that constantly play out and when energy shares broadly do well, you’re going to see a lot of individual stocks within that space do well as well. So here you see the crossover at 511, moving to the upside. We can hit those predicted highs and lows. Again, you see the guidance and you got to understand that if you get involved in a market, you may have a position, but you may need to make adjustments on that position. So if you know to be long, you’ll say, okay, I can take profits along the way, but know that hey, you want to be scooping up shares down here. Again, taking profits as that advance continues.
Here, you get a big move lower, but yep, right back up and the trend continuing. So again, just really good opportunities here. You got to be certainly aware of what’s going on out there and really be a little cautious with the portfolio. There’s some great opportunities to get long, but you want really the tools to be as selective as possible and pick your spots. Because if we do get volatility, you don’t want to be in those things that really aren’t set up well. So here we see another 16% move out of the energies, but here’s Workday shares. There’s a lot of stocks like this, where it’s not like Microsoft or EA. You’ve gotten those crossovers. You’ve gotten that support that says, okay, this is at least in an up trend.
Some of these things just stay in down trends and you see the past couple of weeks have just really not been kind here in shares of Workday. Overall, huge move to the downside and we’ll just go ahead and end on bringing up those predicted highs and lows.
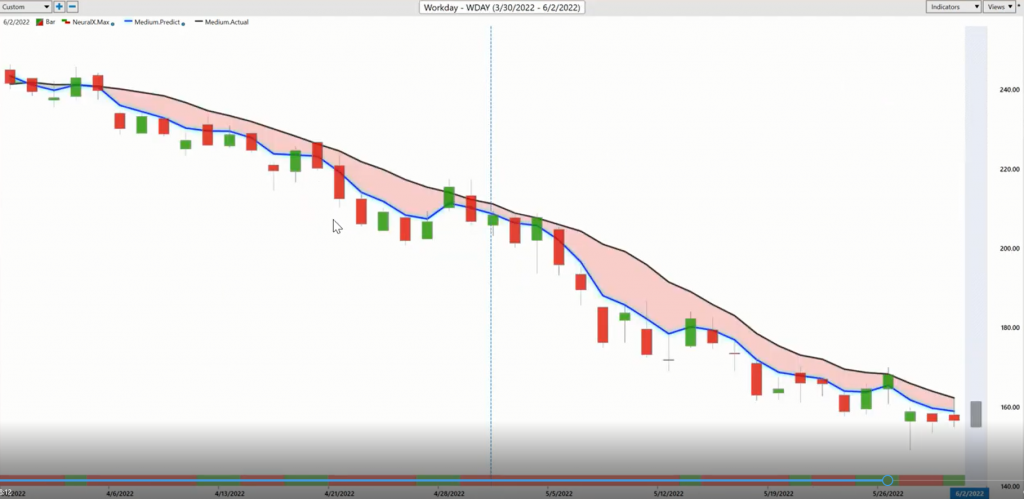
So over this 43 day decline of about 35%, how many entries along the way are there to potentially get short positions into the portfolio to maybe compliment your long positions? I actually just listened to an interview recently with Jim Chanos, a big short seller and he talks about holding your short position sometimes let you stay more long. When you have these things that are really working, you can go ahead and when those opportunities to the bullish side come in, take them with some confidence to know that you’ve got things balanced out appropriately to really make some money and protect yourself.
So here in Workday, just a absolutely huge decline, again, about 35% move lower, but we are starting to see some glimmers of hope. But you want to make sure that, okay, well, once that individual forecast gets in alignment, you’ll have the help of those predicted highs and lows and those other tools to help you get the best entry possible and make the most of that trading opportunity. So once again, this has been the Hot Stocks Outlook for June 3rd, 2022. Thank you all for watching. Best of luck and bye for now.