


Welcome to the Artificial Intelligence Outlook for Forex trading.
VIDEO TRANSCRIPT
Hello everyone and welcome back. My name is Greg Ferman, and this is the VantagePoint AI Market Outlook for the week of March 14, 2022.
Now, to get started this week, we’re going to begin where we always do with that very important US Dollar Index. Just a quick recap, however, of the indicators we’ll be using for this week’s presentation. We’re using bars, not candles, our long-term crossover, our long-term predicted difference with our medium-term predicted difference crossover, our Neural Index, and of course, the Neural Index Strength; point in time set to the yearly opening price, short-term predicted difference, triple EMA cross modified where I’ve left only the T cross long, and of course, we’re using that with our long-term predicted crossover and our verified zones.
U.S. Dollar Index
Now, the dollar continues to shine here, but the question is for how much longer? In most cases, the dollar completely runs out of steam by the end of March. We’ve got the Fed coming up this week, but the Fed has already stated what he’s go going to do, which is a quarter basis point hike. I am not anticipating a 50 basis point hike. I believe he stated this to Congress to calm the equity markets down, the big sell-off we’ve had in stocks for the better part of the calendar year but accelerating as of late.
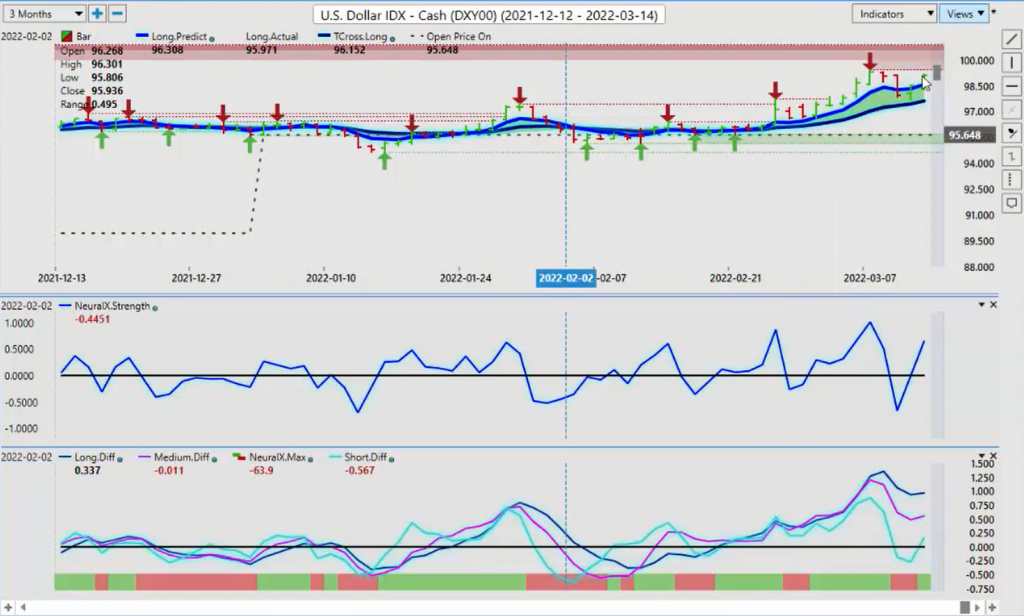
So right now, we have a newly formed verified resistance zone. That’s coming in at 99.41. Now, to start the week, the dollar has a tall order here because we’ve closed the week at or about the 99.12 area, so that sets our weekly opening price at 99.12. We’re looking to see if we can hold above this to break through this zone. But again, when we start going back and we look at the dollar over the last several years, you can see that seasonal right there, at the end of March, where basically the dollar tanks right through till about mid-June and then it starts to recover. This is not a one-off event here, guys. I see this in most years. You can see it right there again, March 20th. That was a much steeper decline.
Now, the dollar is doing well based on risk-off flows, but the question is how much longer is that going to continue? Our indicators, at least to start the week, show the dollar strong with our Neural Index and our Neural Index Strength both positive. Our predicted differences are a little mixed. But our two key support levels now will come in at the long predicted 98.56 and of course, the T cross long at 97.64. In order to take the pressure off the top side, we would have to close below 97.64. But our main indicators are saying we still have momentum here.
Gold
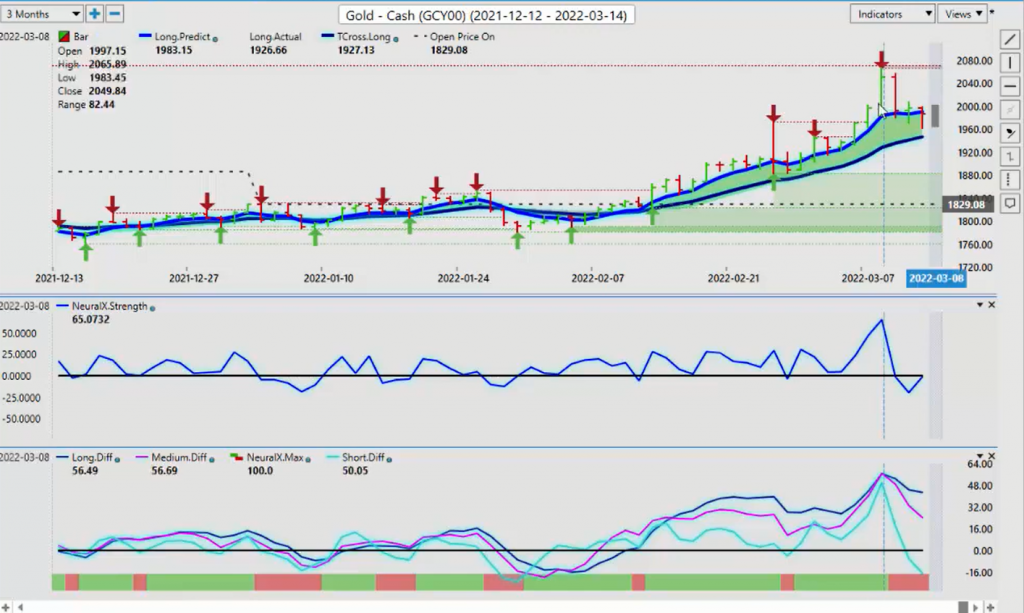
Now, when we do a comparative to gold, we can see that gold also… This red line that you see up here in the VantagePoint software, what we’re doing is taking that verified zone and going back in time to find where that point was and we can pinpoint that date using the software. That date, of course, is on August 7, 2020 where gold peaked. Now, the normal seasonality, I would argue, with gold, is gold is usually strong at the end of March. So I think with the Russian-Ukraine conflict, gold has come into this seasonality maybe a little bit early. So the question is does it have any legs to continue?
The first thing we need to do is identify that 2067 is the high here. And we are yet to breach that. We’re very close at 2065. But we’re still right there. So again, if gold is going to fail, it would be at this level or slightly higher. Now, as long as we still have the problem with Russia, then gold will likely remain strong. But ultimately, I anticipate it will move lower in the weeks and months ahead. But the question is how much lower and will it be just corrective in nature? So we look at our VP levels to try and define that.
Our long predicted is at 1990, but our T cross long at 1945, still long while we hold above this particular level. Our Neural Index is down, but our Neural Index Strength, you can see that reverse first check mark and it’s pointing up. This tells me that we’re likely to have a pretty decent day again to start the week, even with the Fed. But again, the Fed has tipped his hand. So with money coming out of, would naturally come out of gold if the Fed is going to hike. We’ve got a hawkish Fed. But he’s already tipped his hand. So I’m not expecting a huge sell-off in gold, unless there is some kind of meaningful settlement between Russia and the Ukraine. So watch that 1944 level, 1945 level very closely.
S&P 500 Index
Now, when we look at the S&P 500, once again really struggling in the calendar year here, down as much as, I think just over 13% on the year. We’re right down at these levels again last week, down about 12% on the year. But here’s the yearly opening price, our price on open. That price coming in at 4771.
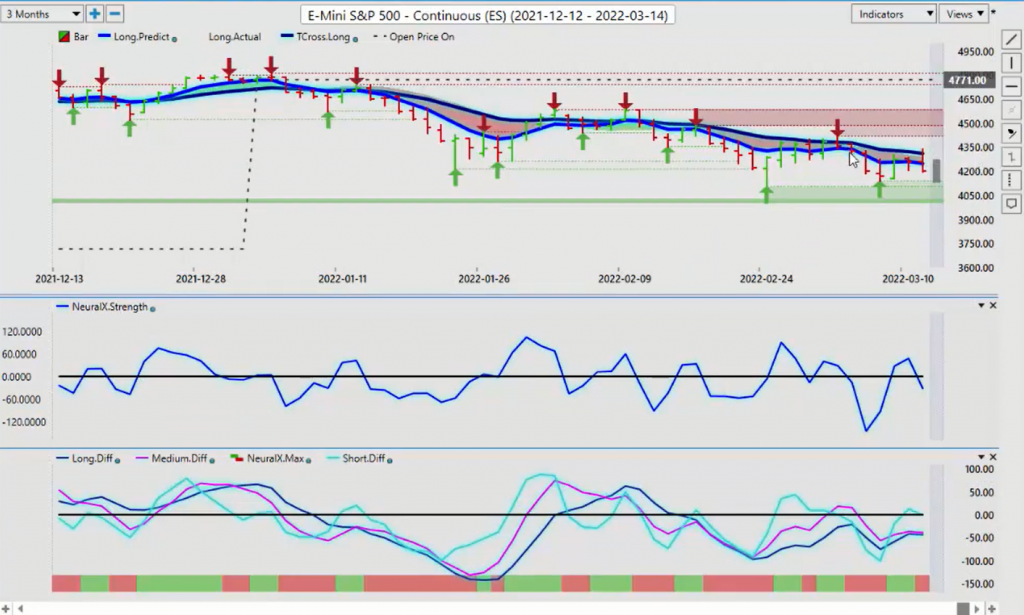
Now, in order to buy this, I would recommend, or what I would not recommend, but what I can tell you what I’ve been doing is the only time I’ll look for longs on the S&P is usually on Wednesday in higher volume when there’s a bit of a safety net there. But all longs have struggled. They’re corrective in nature, and they keep getting blocked by the VantagePoint T cross long. That’s why I’ve made the choice to eliminate the short term and the medium term in the triple EMA cross so we can all focus on that key pivot level, the T cross long. 4311, we’re coming into that. Now, we’ve come up. We’ve banged right into that on Friday and down we go again, closing the week out at 4201. That’s a big drop.
Now, I’ve talked about this before, the other week, where multiple short trades into that VPT cross, T cross long and ultimately failing. So once again, we would have to get above, the very first point of us getting long would be a close above the 4311 mark. And again, under the current conditions, that’s going to be a tall order.
Now, our Neural Index is down, but our Neural Index Strength is also down here, pointing down and breaking down below the zero line. The Neural Index Strength allows us to see inside the Neural Index, inside those calculations before, not after they happen. So this is pointing to another potential rough open here for the global stock markets. But again, keep a very close eye on this level here. Because once again, that T cross long at 4311, once it closes above that, then we have a real shot at a stronger corrective move higher. In most cases, the seasonal play would be to buy equities towards the 24th, or the 23rd actually of this month. So I’m expecting further downside until closer to the end of the month.
Bitcoin
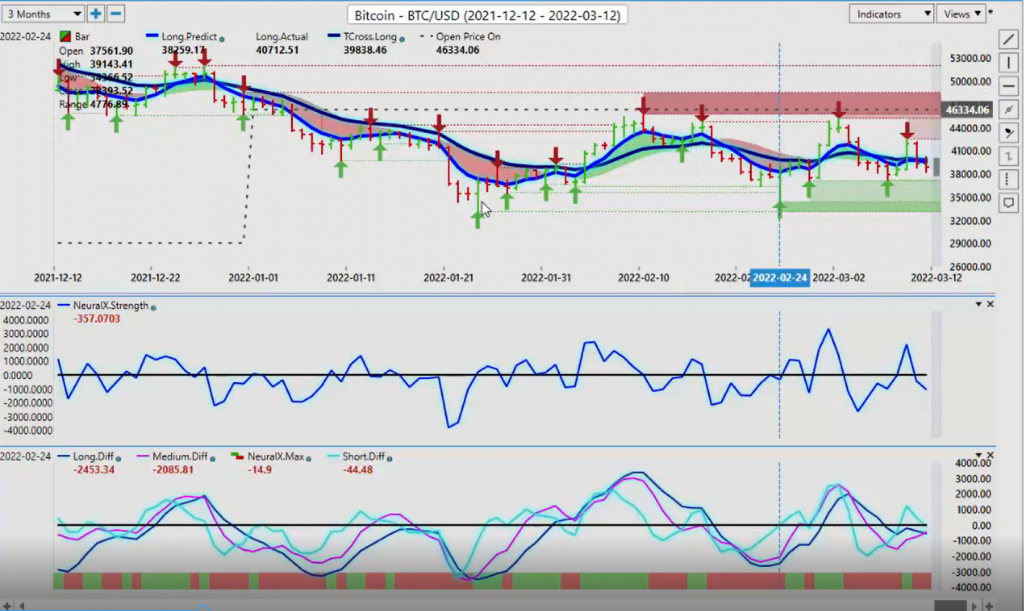
Now with Bitcoin, Bitcoin continues to hold its own here despite these big sell-offs in the stock market almost every day. Bitcoin is still holding in there in this overall channel. That channel low is coming in around 33876. And the top end of that channel is consistent with the yearly opening price at about 45734. If we get the NASDAQ turning around, the S&P 500 turning around towards the end of the month, in my respectful opinion Bitcoin will follow. So watch for a potential long here. The verified zones to start the week, they’re sitting down here right around the 37438 mark. But our indicators on Bitcoin are still down. The Neural Index is down. The Neural Index Strength is down. And we are again closing below that T cross long at 39887.
Crude Oil
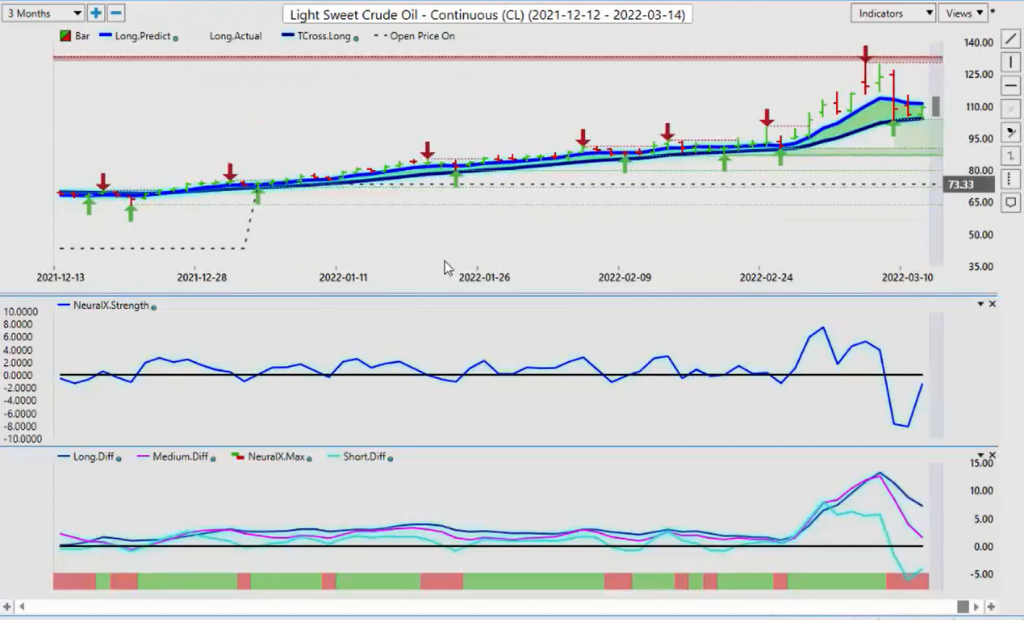
Now, when we look at oil for next week, again I’ve basically stayed away from oil under these kind of conditions because it’s just moving all over the place. But it is holding above the VantagePoint T cross long, which is very impressive. After this big move down, we’re now consolidating right along the T cross long at 104.27. If we continue to hold above that, then longs are still viable, but we are losing momentum here. But this can change very, very quickly. So under the current circumstances, while there may be some opportunity, you’re going to need a lower position size and a much wider stop to survive it. But were long while we stay above 104.27. The yearly opening price, the price on open, 73.33. So there’s a considerable amount of room for a retracement if things do settle down in Europe.
Euro versus U.S. Dollar
Now, as we move into our main Forex pairs to begin the week, the Euro just getting decimated. And again, we have talked about this in the VantagePoint Live Training Room. This is what, a lot of people use the term death cross. And this is the most popular one I’ve seen in the first quarter of the trading year. And what the death cross really is is the long predicted crossing over the T cross long exactly on the yearly opening price. I usually see this throughout the calendar year, seven, eight, nine times during the course of the year. But every time that this type of cross has taken place right on the yearly opening price, whether it be to the upside or the downside, there has been a substantial move.
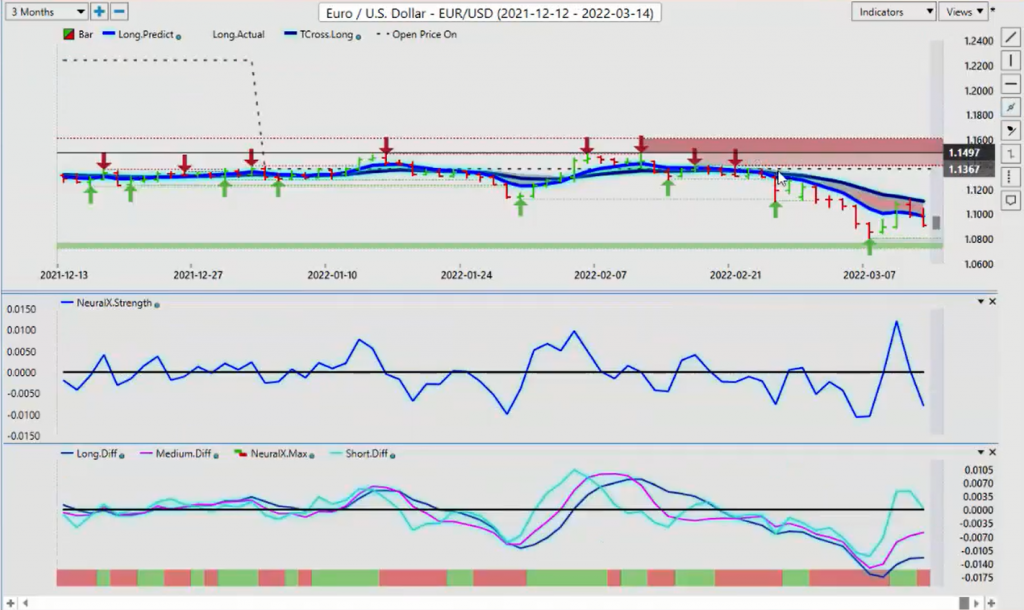
So we see the same thing happen, which I discussed in the Room this week, with Great Britain/US, that a lot of people were trying to buy it, but it was a very difficult trade. So for now, that death cross appears to have completed. We’re moving all the way down to a low of 1.0806. So we have a short-term bottom in place. And usually what happens when we get a short- term bottom in place, we retrace back to the T cross long. That’s what we’ve done. So that would tell me we’re going to take another run probably at the 1.08 level.
But again, you can be a strong Euro buyer. And I would certainly respect that, guys. So if you’re going to be a buyer of the Euro, I would highly recommend that buy limit orders be set just above the T cross long at 1.11, say 111.20. If we can close above the T cross long, then we can look at targeting the yearly opening price at 1.1367. But again, the seasonality with the Euro, the month of March is not a good month to be buying the Euro against most pairs. But towards the end of March, it actually comes alive again. More towards after the first week of April, I usually see a pretty strong rally in the Euro. Now, that could come early. If, again, Russia and the Ukraine, if that all settles down, then the Euro currency is likely to stabilize. But it’s still going to be behind the eight ball against the dollar hiking rates.
But again, if we look at all the other countries that have hiked rates so far, after they’ve hiked their currency has moved lower. So we’ll continue to monitor this. But being able to pinpoint a certain point in the market where you’re looking to go the other way, that’s where the T cross long and the long predicted come into play. We know if we close above 1.1106, the pressure’s off the downside. But we certainly want to be cautious about getting caught in a potential bear trap down here.
U.S. Dollar versus Swiss Franc
Now US/Swiss franc has been a solid long trade right from January one. We can see the yearly opening price. We’ve had moves up, moves back down, but they keeps getting tangled up along the yearly opening price. But every time it comes down here, it moves higher. So we’ve got some resistance on the verified zone, .9343. If we can clear that, then maybe we can go a little bit higher.
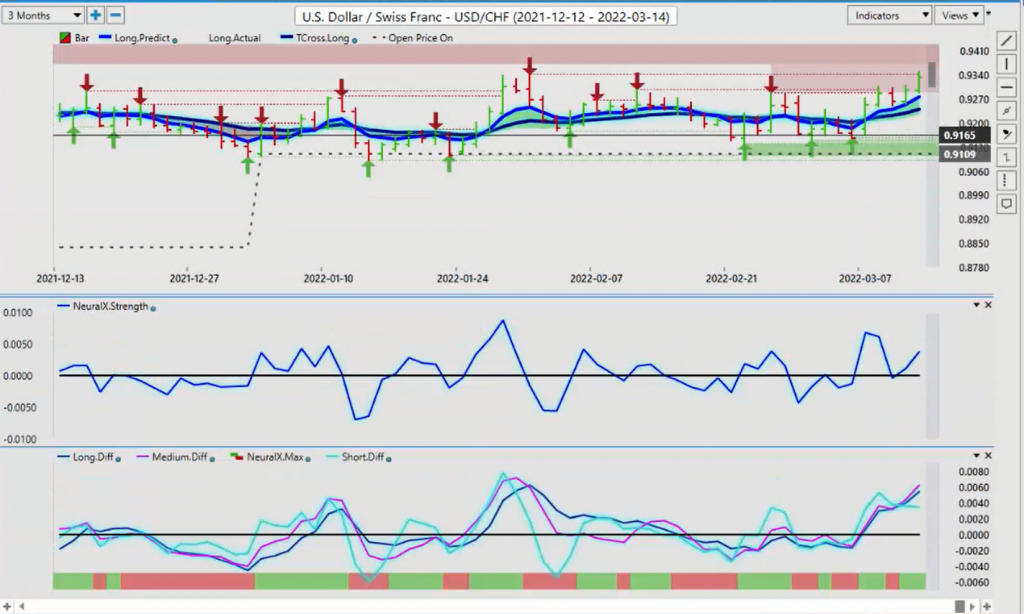
So if we look at that seasonal pattern, this pair is usually strong right into, more towards the 1st of April, then it starts its decline. That’s the easy way to view the seasonal pattern there. So I think we have further upside. It’s just a question whether we can clear this significant resistance here around .9361, .9368. But we’ve cleared this one here, and this one’s coming in at the high of .9277. So I think we’re going to get .9368 or above at the very minimum. But this is where I would be a little bit more cautious, up around this .9433 area.
British Pound versus U.S. Dollar
Now, once again, with the pound, still no love for the pound here whatsoever. But there’s a very good visual of the death cross that I just mentioned previously. And again, this is a rare thing when it does happen. But when you get the blue line crossing the black line, and this is a modified predicted moving average, the long predicted and the T cross long, when that cross takes place and the blue line separates itself from the black line and the yearly opening price is sitting right there, again this is usually a very substantial move. So when we come back a little bit further here, I can run a quick seasonal check here. The pound/dollar still shows it’s a little soft until about the end of the month. Then as we get into the first couple of weeks of April, we see the pound recovering, but then moving lower again.
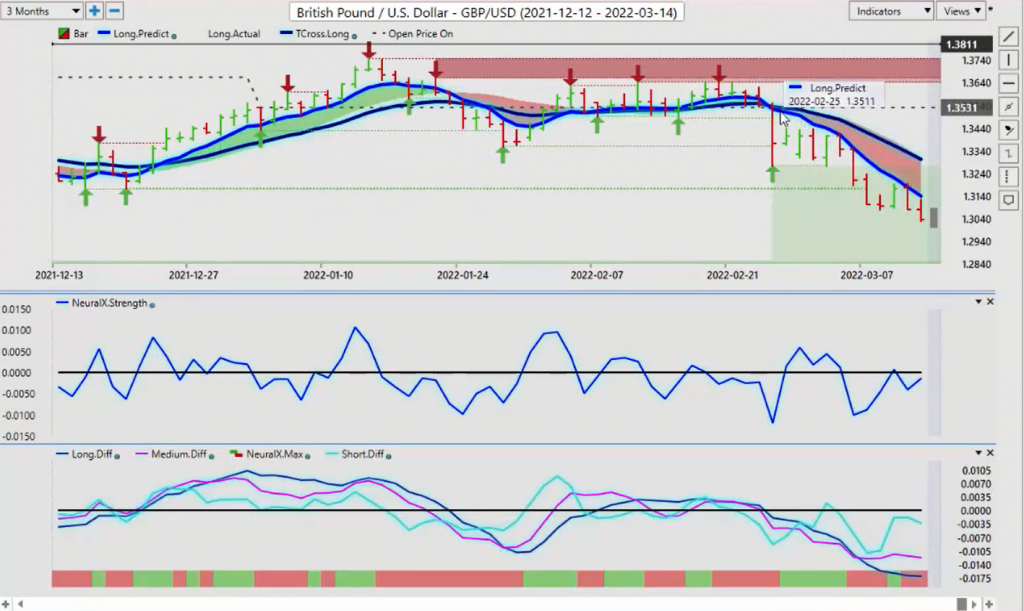
So at the current time, I’ve seen, I’ve received a lot of emails I’m buying the pound/dollar. This in the last couple of weeks. And the best way for me to illustrate it, guys, is that when I see this cross taking place, longs are off the table for me. And this usually means that the S&P 500 will follow. Now, again, from a seasonal standpoint, in most cases in a calendar with the US primaries, the S&P 500 and the global stock markets, or at least the US equity markets don’t do well anyway. So the Russia-Ukraine thing, it’s really amplifying that, or distorting I think would be a better term.
But right now, looks like we’ve got a run going here, down here. So if we pull this back on the pound/dollar, we go back a year, you can see we lost a very, very big support low at 1.3173. So I will continue to back the software out until I can find some support. And it looks like the next big support is down here at or about the 1.2855 level. So right now, I would say that that is a potential target, but that would also be something we would look for a reversal at that time, more towards the end of March.
U.S. Dollar versus Canadian Dollar
Now, with the US/Canadian pair, this pair continues to frustrate most traders. But we were doing shorts on this in the VantagePoint Live Room this week. We have a verified resistance high. That’s coming in at 1.2877. We formed a new one this week. That came in at 1.29. You can see there’s only about a 25 pip difference there, and then down it goes. Now, this is a commonality that happens with this pair on Monday versus Tuesday and Wednesday. So we have a big rally up on Monday and a little bit more of a rally on Tuesday, but then on Wednesday, Thursday, and Friday it just completely reverses. 80% of the time I see these reversals from Monday to actually Tuesday. You just got to stay in the trade long enough.
But the question here now, is the Canadian dollar going to hold its gains? We did have a good report, a labor report coming out of Canada on Friday. I believe that that will likely support another rate hike for the Bank of Canada. So it’s going to be a real battle between the Canadian dollar and the US dollar. But in most cases, the US dollar will win if commodities are down. But commodities are up, so I believe we have a shot next week or the week after of retesting the yearly opening price at 1.2637. Now, one of the reasons I would say that is because of Aussie and New Zealand, the unusual strength that they’ve had. But we’ll talk about that one more in a minute.
U.S. Dollar versus Japanese Yen
First of all, we’ll look at the dollar/yen. The dollar/yen, this pattern that has been in place for the entire calendar year, between 1.1634 on the upside and on the downside we’re sitting at 1.1348. We have been in this channel for over three months here, guys, right? So when we look at this right now, we can see that we broke above that, but we broke above it on a Friday. I believe that this is just a stop-loss hunt because Putin announced that there’s progress in negotiations. But I think that you would be, the market would be, should be very cautious in believing anything this guy says.
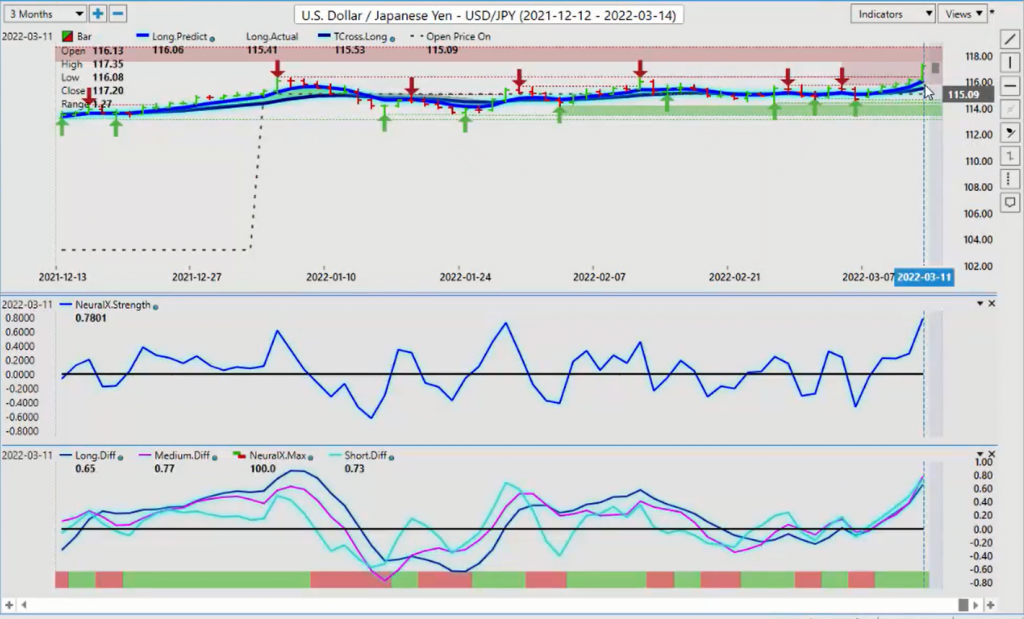
So the dollar/yen spiked on that when the equity markets popped. So did the dollar/yen. So again, when we look back at this over the calendar year here, we can see that the dollar/yen is usually done by about the end of the month of March, any kind of rally. But when we go back in other calendar years, most calendar years show that it’s completely peaked by March the 25th. So either way, that would tell me that the seasonality is that the dollar/yen is unlikely to have a lot of upside potential here for now but the dollar is strong for another couple of weeks. So again, we’ll monitor this. But it wouldn’t surprise me in the least if this current Forex pair slips back inside this very well-identified trading range.
Australian Dollar versus U.S. Dollar
Now, with the Aussie and the New Zealand, again they’re a very choppy up and down week here. But the question is are we going to get a death cross to the downside or is the T cross long going to hold on the Aussie/US pair? This is a difficult call here, guys. So the best thing we can do is identify the levels and be prepared to react. So that VantagePoint T cross long has been holding at .7259. If we close below .7259 and the blue line starts to cross over this black line, then that would tell me that the Aussie is getting ready to move back towards the .7086 mark. That is entirely possible. We have a new verified resistance high. That’s coming in at .7440. But there’s also a strong possibility based on commodity prices and the potential for an equity market recovery that the Aussie could hold this level and we could advance higher from there.
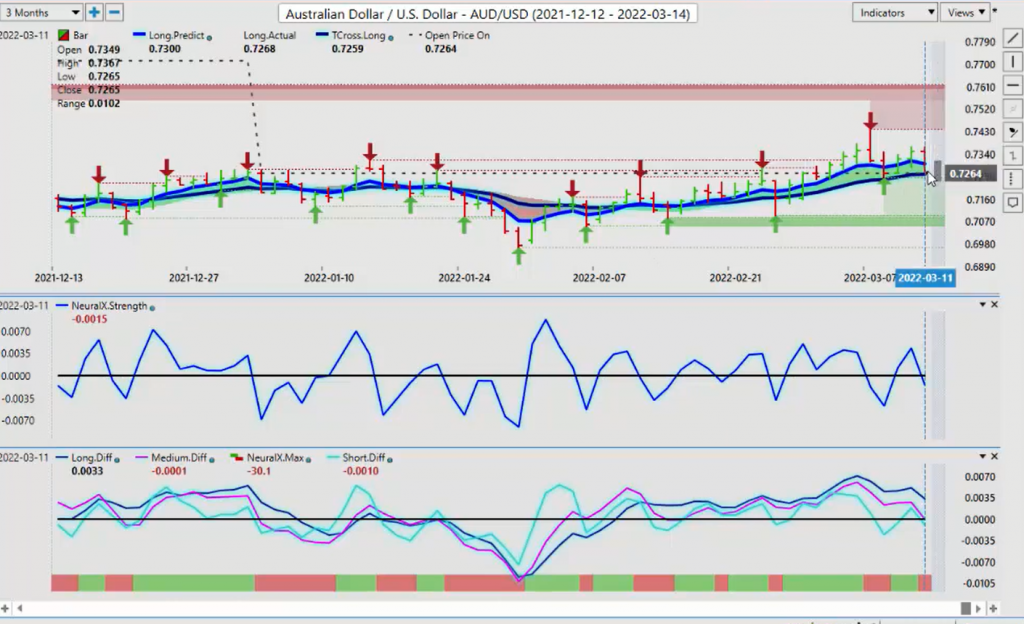
The key point is here that we need to assess this and be prepared one way or the other. Again, the perfect place for a straddle, the verified zone there, the low is coming in at .7245. So we can look at setting potential sell stop orders below the .72 level, .7210. We break and close below that, then eventually, within a day or two, this blue line is going to start crossing down. When it does, that could be a death cross to the downside. But as long as we know our support levels, we can trade this.
New Zealand Dollar versus U.S. Dollar
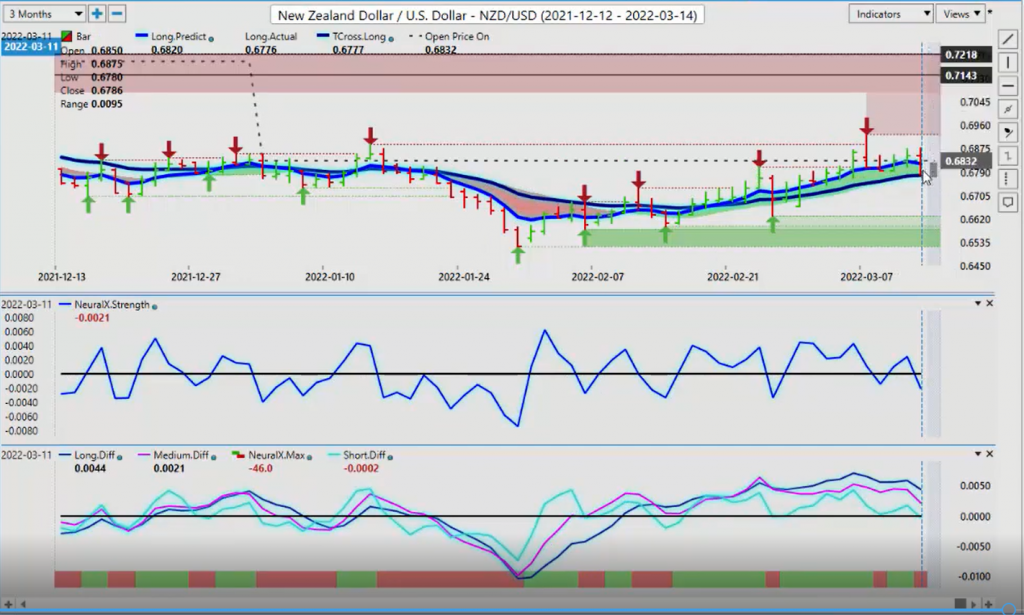
New Zealand is basically similar, but it’s already making a move here. We’re closing the week below the yearly opening price. We struggled the entire week trying to close above that yearly opening price and we couldn’t. The only thing holding this thing up is the T cross long at .6777. So watch that level very closely. But if another cross is getting ready to take place, then again, we could be looking at a more substantial move to the downside, towards the .6582. But if we hold this level, then we will likely retrace back towards that verified high at .6925. So with that said, this is the VantagePoint AI Market Outlook for the week of March 14, 2022.


