


Register for a Free Live Training
The Hot Stocks Outlook uses VantagePoint’s market forecasts that are up to 87.4% accurate, demonstrating how traders can improve their timing and direction. In this week’s video, VantagePoint Software reviews forecasts for Walt Disney ($DIS), FASTENAL ($FAST), Amazon ($AMZN), Tesla Motors ($TSLA), Salesforce.com ($CRM), META ($META), Microsoft ($MSFT)
Hello again traders and welcome back to the Hot Stocks Outlook for February 3, 2023. Hope y’all are having a excellent week out there in the financial markets. We’ve seen some really exciting moves opening up and creating some fantastic opportunities for traders in the marketplace. But if you haven’t already, make sure you click on the link of available in the description below and you can get a live demonstration to learn more of the specifics about how the tools and technologies that you’re going to see here can help you make better trading decisions in the marketplace.
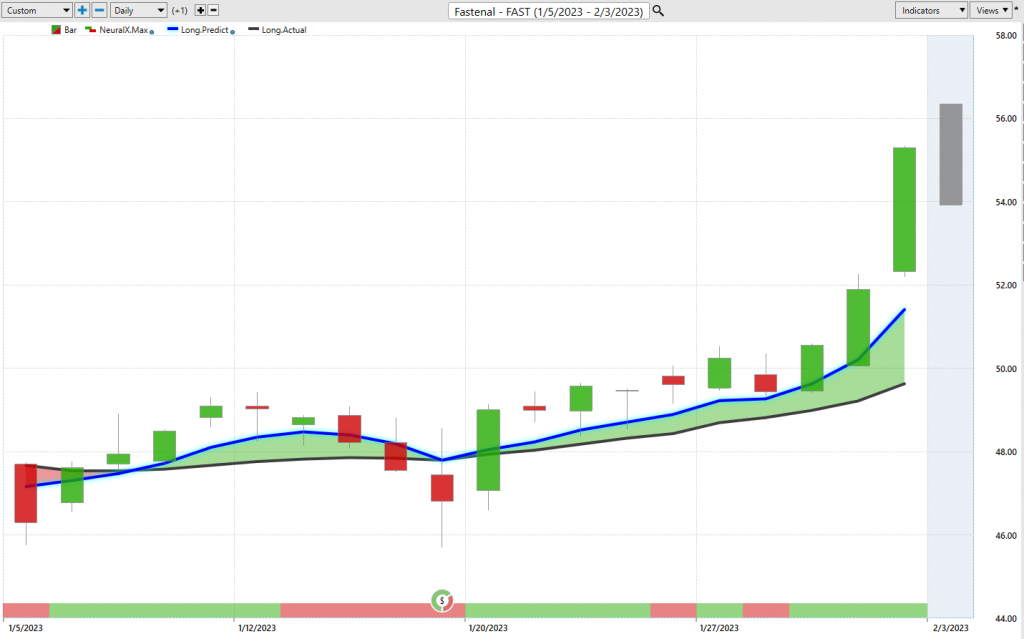
What we’ll do is we’ll start out with shares of Fastenal. This is a really good example of how all these tools work together, but then we’ll just go ahead and review a lot of these very popular, exciting markets. We’ve looked at Amazon, Walt Disney, Salesforce, Meta, Microsoft, and of course Tesla here, but starting out with shares of Fastenal. What we have here is daily price action. Each one of these charts works exactly the same way. Regardless of which markets you’re trading, you’re going to know how to use all of these tools.
What we have is daily price action. Right up against that price action, you’ll notice that there is a black line and a blue line or a black value and a blue value. The black line that you see there, that is a simple moving average. In this case, it’s a 10-day simple moving average. It’s a very common technical indicator. It looks back at the previous 10 closed prices. It’ll add those all together and divide by 10. What it does is it smooths things out for us and lets us know where things have been over a given period of time. But as a trader, we want to understand where’s the market going next? How can we be ahead of that next move?
And so, what we want to actually do is compare that black value or that lagging moving average we might call it, and compare it to this blue proprietary predicted moving average generated via the technology here. Whenever we see that blue value cross above the black value, it’s suggesting average prices are going to start moving higher and traders can use these tools to identify important trend shifts in the market. And so, if you review the Hot Stocks Outlook from last week, you’ll see, okay, well where have we been seeing those signals as far as those predicted moving average crossing above the actual moving average, and how robust across the markets have we seen those signals? Well, here we see in Fastenal, very clear blue line crossing above the black line, but there’s other tools here that are really going to help you depending on your trading style, make the most out of these situations.
If you look at the very bottom of the chart here, you see this bar that goes from green to red, back to green, and the forecast is essentially the last signal that it creates going into the next trading day. Now, this indicator is tuned to solve a different problem for the trader. It’s not looking at the overall trend, it’s looking at short-term strength or weakness over the next 48 hours. You can think of that as a couple of candles of strength or weakness. This can help traders within the trend understand how to manage the volatility and understand when those higher highs or lower lows are likely to set in. In addition to that broad 48-hour view, you’re getting a more specific predicted high and predicted low for the next trading day.
And so, what we do each week is we go back and we look at how accurate each one of these predictions was against the actual market data, because what will occur is we’ll get the trading day and it will fill in, but the high and low level, of course, stay the same and we’ll see how accurate things are. What we can do here with Fastenal is say, okay, well if we see this market starting to reverse, where might we want to look for places of value to accumulate a position? I don’t think we hit the actual predicted low there, but you want to be buying towards that predicted low level and expressing those long positions.
We see Fastenal here getting a crossover to the upside, but we’ve known there’s been a lot of strength in the market. This is more of a new instance of seeing a new opportunity or new trend emerge over the past eight trading days and about 12.7% rally there just in a very short period of time, but that’s because we’ve had a lot of recent strength that’s been building.
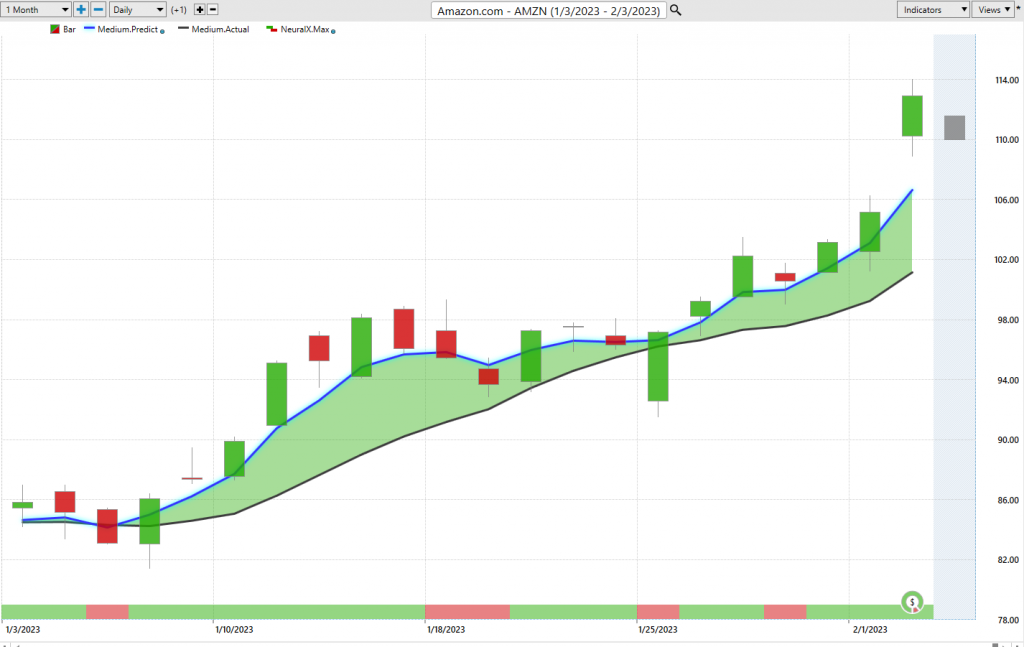
Here’s shares of Amazon and we keep looking at this week after week after week with that blue line crossing above the black line, and there will be these periods where the neural index will warn you that, hey, there might be some lower lows over the subsequent price action. But you see, as long as that blue line remains above the black line, the overall trend is up.
And so, what we can do is again, look at this last week. We have this being Thursday and going back, well, this being Monday. Going into the week you say, okay, well if I want to get some exposure to the equity markets and Amazon’s been one of those markets really leading the way, well where might I want to look to accumulate a position? And so, we’ve seen things just really accelerate here and things getting gappy and really exciting, but that’s where traders can make a lot of money understanding where’s the strongest area in the market. We know stocks are going up, but we want to know where are the strongest stocks, where are those forecasts where that blue line is well above the black line signaling a lot of strength. Here, you see about 32% rally Now over the past 19 trading days and a really fantastic opportunity here. A couple hundred shares has you up about $5,400. This is, of course, well below $100 a share as we started to see this thing move higher.
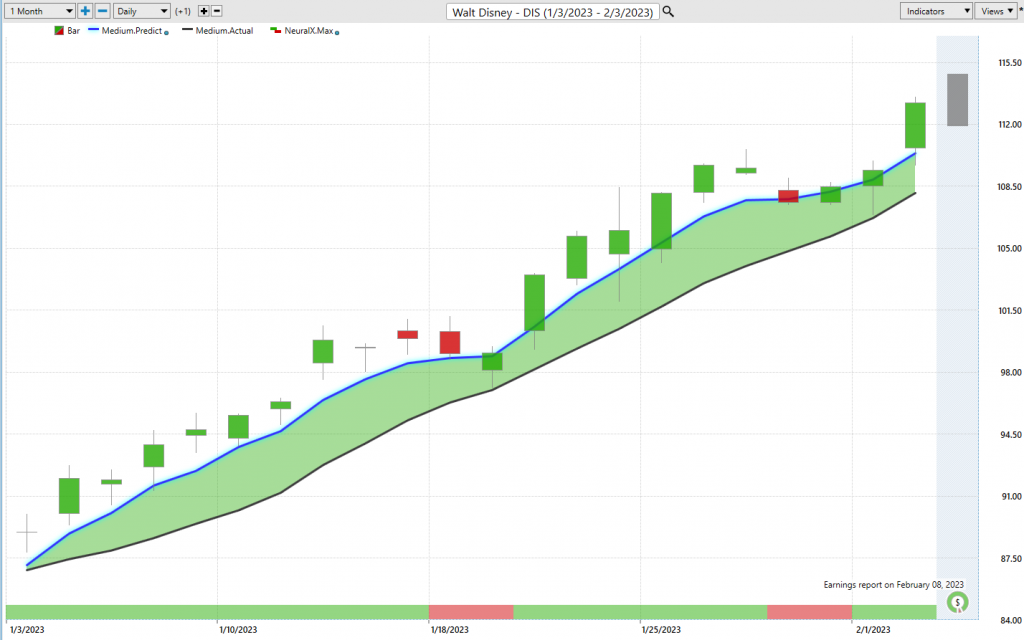
But let’s move over to Walt Disney. Again, with the same logic, we understand, hey, there’s strength here. We keep highlighting these markets week in and week out. Well, how more specifically can we use the short-term forecasting to get ahead of this? Well, here in Walt Disney, we take a look at this pretty often here. We see here’s Friday going into Monday, and we see this a lot where you get sort of a boring day, nothing happens. The market moves on Monday towards that predicted low and you’re going straight up because that blue line is still above the black line, the overall trend is still up, and then more of these finer tuning here to help you with the entries and you’re getting really good entries on this existing trend, so potentially adding to markets that have really been working already.
What’s important to note is this is through fed announcements and FOMC and interest rate adjustments, has this very high level of accuracy attached to the vantage point indicators. And so, whether you’re paying attention to those market announcements or using these tools, the tools are extremely robust and have those high level of accuracies regardless of earnings and all of this. You can have a high level of confidence that okay, we can use these during normal times to get those entries, and you never know what you’re going to get around those big earnings announcements and Fed announcements and things. But when you have great entries, which is what we really mentioned with Tesla and some of these things moving, when you got a great entry, you can lock in your stop, and as long as that blue line remains above the black line, well that may create some really fantastic opportunities with very little risk.
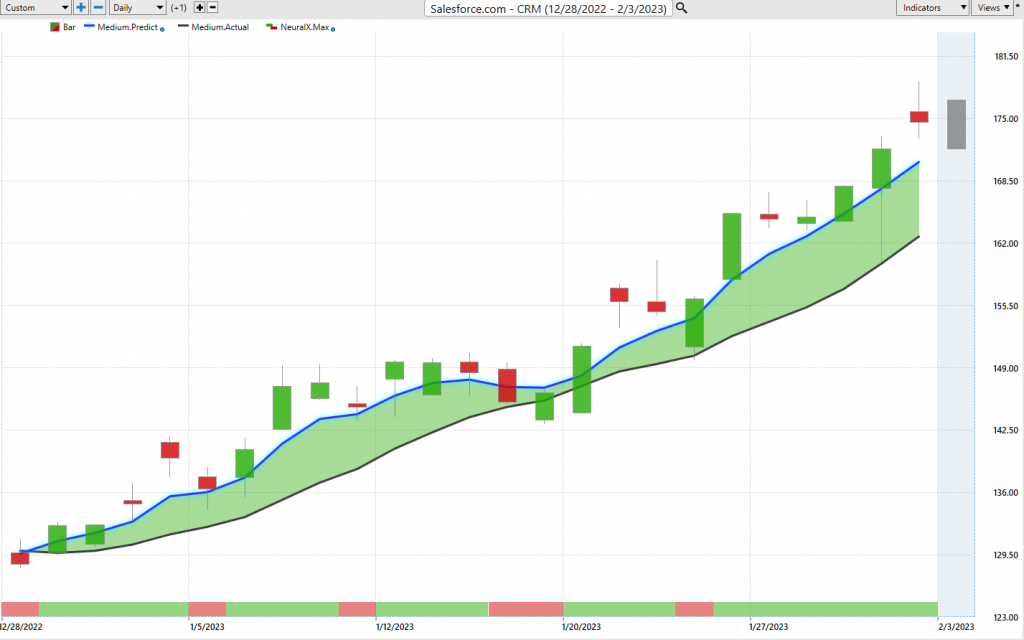
Here’s shares of Salesforce. We haven’t really looked at this recently, but again, another example of, well, where are these markets actually shifting to the bullish side of things? We see then the 29th, the blue line crossing above the black line. You’ll have these periods where the neural index gets bearish and you see you get these subsequent lower lows over the next 48 hours of price action, but look at the distance between that blue line and black line. You are not close to that blue line crossing below, and again, signaling that, hey, there’s a lot of strength in the overall marketplace. Here’s shares up about 32% over the past month here of rally. But again, with these predicted highs and lows over the past few weeks, you understand, hey, look down towards these levels and very, very strong forecast signaling that hey, this is one of the stronger areas of the market. Again, things doing quite well there.
You just see how many forecasts look very similar, and that’s because markets are very correlated. And so, this is why it’s very important to see these things early, get those early entries, and then manage the position, because when these things start to move, they’re all going to start to move and you really need to recognize the situation and what’s really going on.
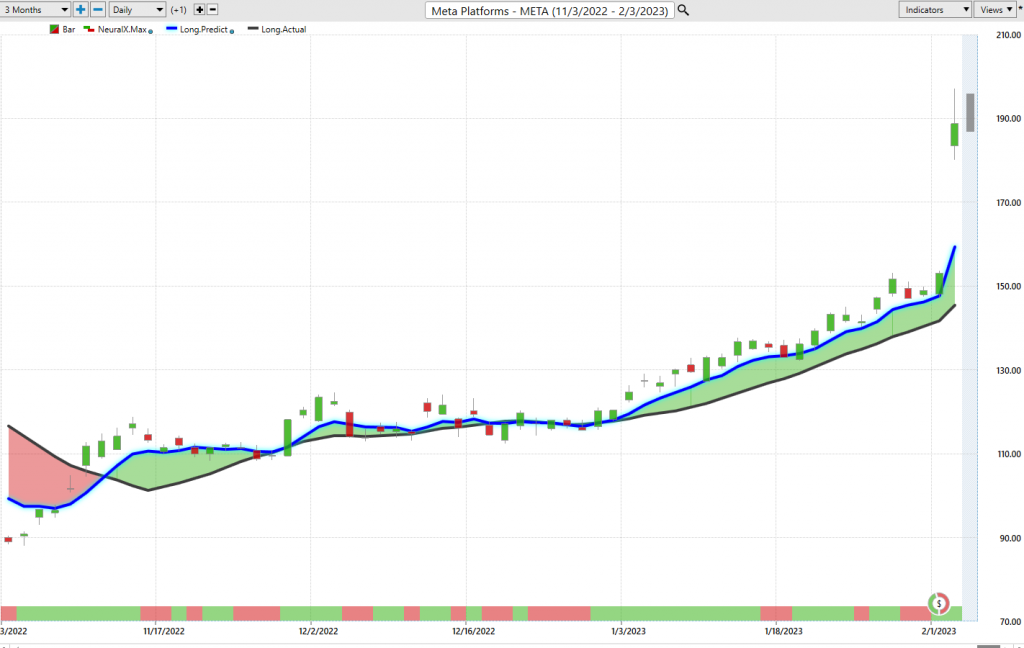
Here with Meta, we have that blue line crossing above the black line. We can look at these predicted highs and lows and let’s just take a look at the overall, we’re going back to two months here, really a full month here. Predicted low, gap down, predicted low, predicted low, predicted low, predicted low, in Monday there, predicted low, and then getting all that volatility working in favor of the trader who’s been accumulating that position, but doing it strategically where a lot of the risk and stop losses can be down here and still have this overall position at break entry to make sure that you’re potentially around for that huge move that you see more recently on the chart here.
Again, really great opportunities, but this is not something that you didn’t really see coming. Last week, we’re looking at Amazon, we’re looking at Disney. It’s a very straightforward sort of view of things, with the exception of if the blue line’s below the black line, avoid those markets. Avoid Quest diagnostic. Avoid Campbell Soup. These are not areas that are likely to do well, but here we see a 57% rally in the past 23 trading days with about a 500 share, even 100 shares there has you up several thousand dollars.
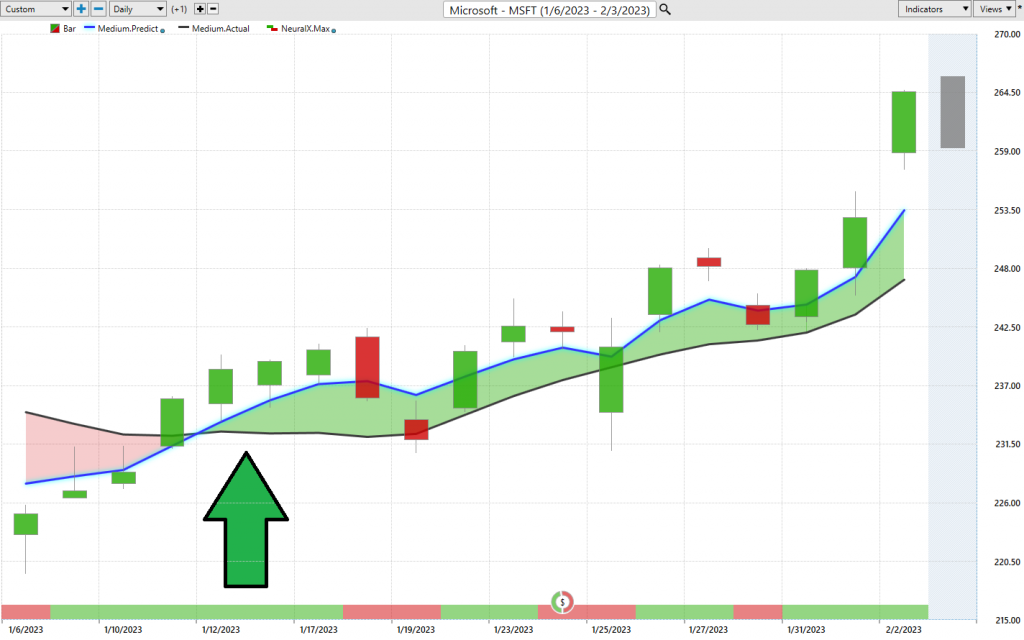
Here, I just wanted, we bring in Microsoft just again highlighting the broad base strength here. Blue line over black line, very clearly here that things are very strong, and often Microsoft highlights what the S&P in the broader markets are likely to do. There’s some strong correlations there, but again, seeing that pop and markets move higher.
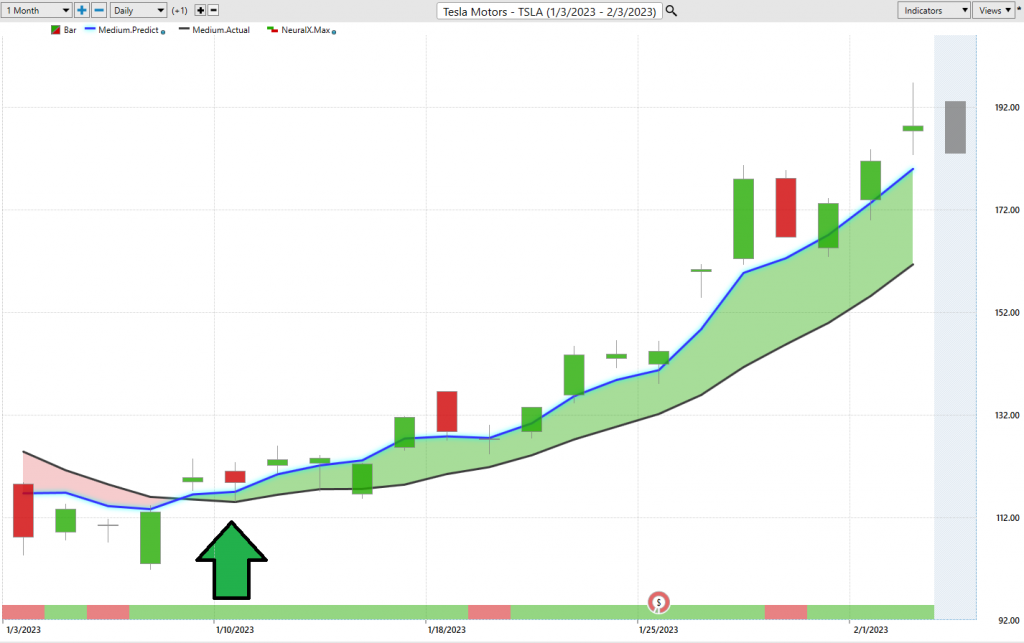
Lastly, we’ll go ahead, end it on Tesla here. We highlighted this pretty early here as far as this blue line crossing above the black line. We really nail the next day’s predicted low. This is again what allows traders get that really nice entry early on when no one really recognized what’s going on, when it’s three weeks before the Fed announcement and that volatility is getting ready to hit the market. Well, you’ve had these tools to guide you moving forward and say, okay, well if you’re going to accumulate a position, let’s get the best price possible. Again, you see this past week moving to that predicted low, the software’s saying, okay, be prepared for these ranges and doing an excellent job guiding things as the market accelerates once more and moves higher with shares at Tesla here.
We’ll take a look at the overall move here, a 57% rally in the past 17 trading days. These are the opportunities that one, you want to be on the right side of, but certainly not missing these things or on the wrong side of this, thinking that markets are getting weak and one should be shorting the S&P or getting bearish on things. Again, a 57% move, 200 shares has about $13,000. We’ll go ahead and leave it there for today, but once again, this has been the Hot Stocks Outlook for February 3, 2023. Thank you all for watching. Best of luck and bye for now.


