


The Hot Stocks Outlook uses VantagePoint’s market forecasts that are up to 87.4% accurate, demonstrating how traders can improve their timing and direction. In this week’s video, VantagePoint Software reviews forecasts for Oracle ($ORCL), Baker Hughes ($BKR), PBF Energy Inc.($PBF), Humana ($HUM) and O’Reilly Automotive ($ORLY)
Register for a Free Live Training
Hello again, traders and welcome back to the Hot Stocks Outlook for July 23rd, 2021. Hope you’re all having an excellent week out there in the financial markets and as always plenty to cover here in today’s outlook. So what we’ll do is we’ll start out with shares of Oracle. We’re going to return to some of these energy stocks, which we’ve highlighted over the past couple of weeks, and continue to highlight some of those big correlations and how the big shifts in sector rotations can really be identified and help you understand, “Okay, where should I focus my attention with some of these shorter term vantage point forecasts?”
But lastly, here we’ll have Humana and we’ll end on O’Reilly Automotive. And so starting out here with Oracle, a really good, just general view of how to use these indicators. And how this all works is regardless of the market you’re trading.
If you’re trading Oracle, Baker Hughes, crude oil contract future as the S&P 500 spike, ETF, it really doesn’t matter. And you’re going to use and interpret the indicators in exactly the same way.
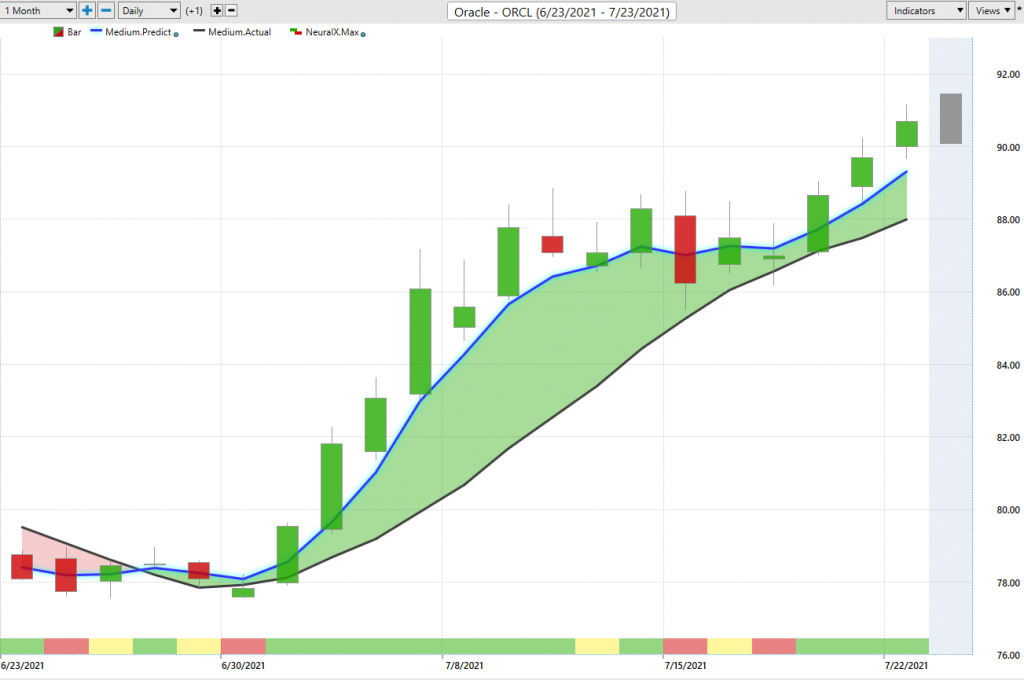
So, what we have here with Oracle is daily price action. So each one of those candles is representing a complete trading day and right up against the price action, you’ll see there’s a black line there and also a blue line. Now, the black line that you’re seeing there, that is a simple moving average. We refer to it as the actual simple moving average, and that’s a very common technical indicator. So, what it does is it just looks at the past 10 close prices in this instance and adds all those close prices together and then divides by 10. And that acts as a very good measure of where market prices have been. It smooths out the previous price action and lets you know, okay, where has the market generally been trading?
But obviously as a trader, you need to understand where’s the market going to go next, not where it’s already been. And so what we’re able to do is compare that actual, simple moving average, or that just general view of where the market prices have been and compare it to this blue line. Now this is very important, understand. So, for that value to actually get calculated and then plotted against the chart each and every trading day, VantagePoint is performing, what’s called intermarket analysis. So it’s looking at relationships between markets, and it’s utilizing the technology of artificial neural networks to do that. So, artificial intelligence here. So what it’s able to do is find relationships and pull out very significant relationships within the data that can give you valuable insights into short-term price action in the days ahead.
And so what that means is for specifically Oracle, there will be a unique set of inner markets that the technology has determined are significant to driving future price action. That can be things like ETF groups. And that makes sense if you have an oil ETF and the futures oil commodity, there’s going to be some very strong relationships there in how these markets trade. But it’ll also include things like the futures markets, or the S&P 500 it’ll include currencies, global interest rates and even individual stocks, where those relationships have been identified. And uses all of that information, how all of these inner markets are influencing and driving, pushing against potential future price action, and it generates a true prediction of where average prices are headed into the future. And it uses that data that it’s constructed to actually generate all of these predictive indicators.
So, it’s using this technology to actually generate a true, forward-looking price prediction. So whenever we have, in the case of our predicted moving average, this blue line crossing above the black line, it’s suggesting average prices are going to start moving higher and vice versa. If the blue line were to move below the black line, it’s just average price are going to start moving lower than where they’ve been on average. And so as that blue line crosses above the black line, there’s a lot of strategies you can take here, but very clearly you’re expecting a bullish move in price action. So, you can bring in your strategy timeframe to express that trade. Now, what’s interesting about VantagePoint is this isn’t just a static forecast here, is it’s updating adapting to those changing market conditions. And what you get here is once that blue line crosses above the black line, we have some other tools that can help with trade management.
So, if you look at the bottom of the chart here, you see this bar and it goes from green to red, and this is getting updated at the most current day. So the very right-hand side of the chart here. And what it’s doing is giving really a very binary output of either green or red, yes or no. And what it’s predicting is very short-term strength or weakness over a 48 hour window. So this is very short term. This isn’t overall trend. You can have volatility up and down over a couple day period, but this is going to help you with that short-term strength or weakness in the market. So when you understand, “Hey, I want to get long in the market here,” but there’s some potential weakness over the next 48 hours. Well, that’s actually a good sign that says, “Look, I want to get long,” use that weakness go ahead and express a long position.
You can again see here, as the neural index goes bearish, you get some sideways price action, but the bigger move is still headed up, and the blue line is still above the black line. So, let’s just break apart this forecast and say, “Okay, well we’ve gotten this move here in Oracle, since that forecast have moved the upside about 14% in a pretty rough market condition.” So we’ve seen a lot of markets like these energy stocks in downturn, seeing some weakness come through, and not a place you wanted to be over this period. But by utilizing the forecast to trade this specific market, so the target market that you want to trade, you can then manage this opportunity and say, “Okay, well there’s a 14% move,” but you’re also getting intraday levels to help manage that trade.
So while this market is moving up 14% over the past 16 trading days, you’re also being provided with intraday predicted high and low levels. And this is what’s going to help you get a good intraday price, get in at the lower part of an overall range, and then benefit as that trend continues. Now, you have the option of taking some profits along the way. You see your predicted high is going to do a good job of letting you know where the market, intraday, you might want to pull back. But when you’re in an uptrend, you know that you can break above that in the bigger trend, still very much to the upside.
So it makes it very easy to understand, “Look, what should I be doing in the market? Should I be maintaining my position, should I be adding to it, taking away?” And really benefiting from this updative, adaptive technology that VantagePoint has here. It’s not all just about identifying the trend start, it’s about having a tool that’s going to be reliable over the course in those shorter term windows, so that you’re making good decisions based on what’s likely to happen, not on chasing things around.
So continuing on this point of we’ve identified some areas in the market where there’s some real problems, and we just saw crude oil drop 8% intraday at one point on Monday. And these are the warning signs that VantagePoint is typically going to send you when you can apply this technology to a wide basket of markets. And you can see the bigger picture of how are things shifting around? Where are the opportunities? Where’s the safety in some of those S&P 500 stocks? And where’s the danger in some of these energy, smaller cap stocks? And we saw just insane amounts of volatility come in here.
Now, we talked about that mid-May period were if you’ve gotten entries and you’ve been long for two months, well, you can decide, “Hey, do I want to deal with this volatility trail, my stops?” But you’re not taking new long positions right as this market’s going to start moving lower on you. And that’s really a big key is when you can recognize those big shifts, you understand, “Hey, where can I get a good entry?” And then manage it as the situation comes in and volatility increases. But energy here is clearly an area where we said, “Look, there’s no reason to be long here.” And it’s not very surprising to see those crude oil futures have such an issue.
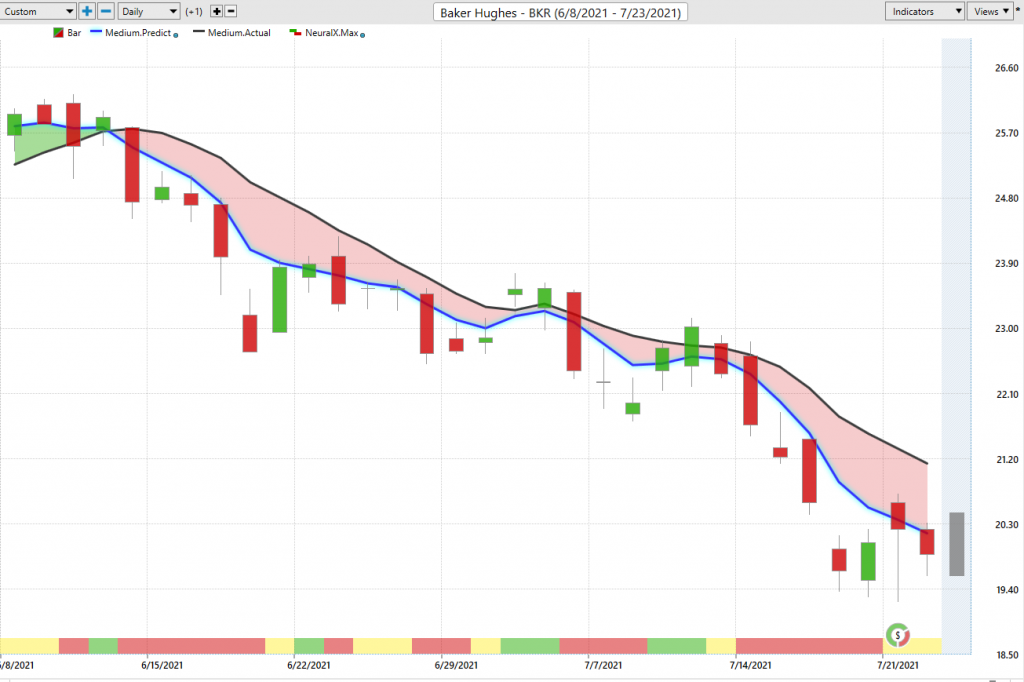
So here’s Baker Hughes. Obviously, I’ve talked about this for weeks. With an 8% move in crude oil, you’re going to see all these energy stocks moving lower. So it almost doesn’t matter where you’re at, you’re expressing the same trade in the same way. So again, we can bring up these VantagePoint predicted highs and lows, just really recapping. We’ve covered this marketing in great detail. But again, all of this information that says, “Look, this isn’t a downtrend. Here’s your daily ranges here.” And you see how it’s helping guide generally where you want to be. But also in the short term, how to get the best of that opportunity.
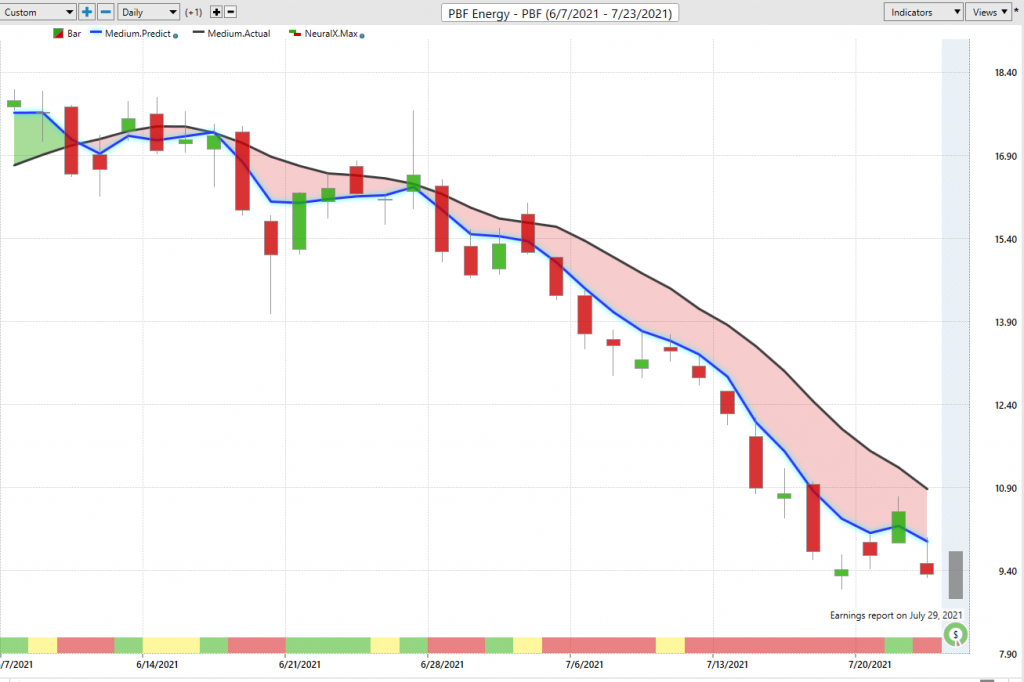
So, we’ll come over here to PBF energy, very similar situation. You see getting these crossovers in this week. And it’s actually earlier than Baker Hughes and some of these other markets, but clearly we’ve got an issue in Arbob, the refined gasoline, the whole energy market is screaming. There was an issue here. And as a trader, we really need to be ahead of something like an 8% drop coming through some of these charts and potentially dragging things to the downside.
So moving on though, we talked about this last week that these bigger stocks, these larger companies are doing better in this environment. The weaknesses is in Russell, the weaknesses in energy, energy stocks on the Russell might not be a bad place to look. And you get exposure to that weakness, but some of these bigger things are just doing well and you wouldn’t want to necessarily short there, but can even potentially stay long and hedge your portfolio with some shorts. So, you’re making money on both sides of things. So here we have Humana, nice cross over the upside and you see, yeah, there’s volatility, but still that blue line above the black line and the help of these highs and lows.
So these intraday levels are really important, because you can get involved in that overall trend, but it’s really the trade management. When you’re able to add to a position strategically, really minimize the risk in getting exposure to adding contracts, or adding more shares, it can really help you and allow you to take some shots in the market that can be very, very profitable, but you’re really minimizing that risk and exposure of what I would refer to as core capital. So you may get into an opportunity, use some of those unrealized gains to add to it and manage it along the way. But with the help of these predicted highs and lows, you can be taking profit at a predicted high, maybe buying even more shares at a lower price with a similar risk profile, as far as how much you have to risk to participate.
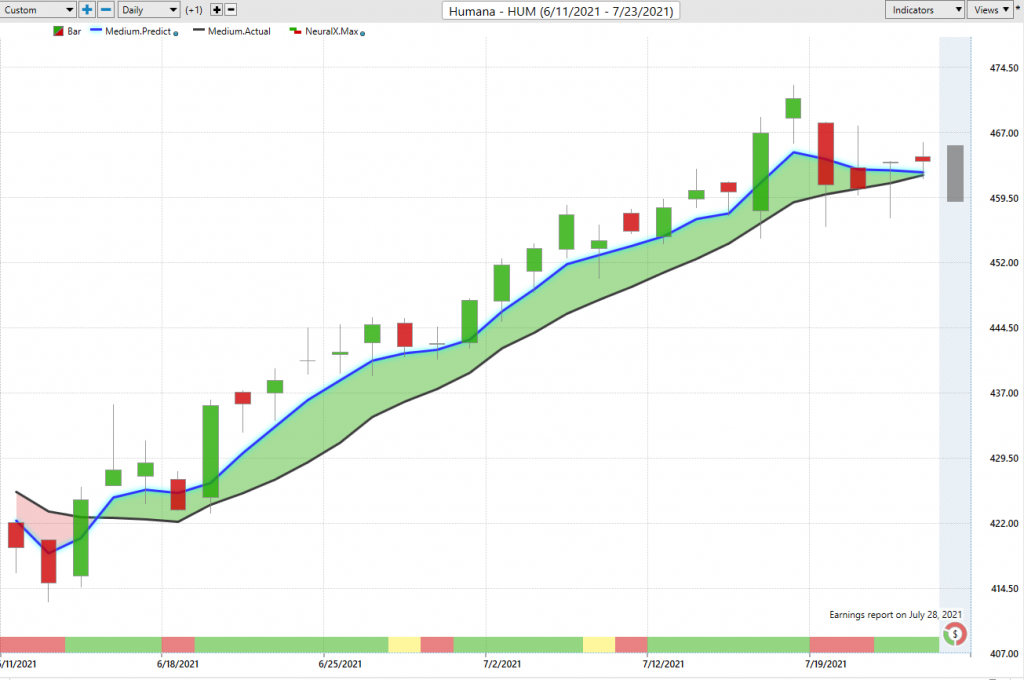
So you see another nice move here about eight, 9%, a big insurance company stock.
Here’s, O’Reilly, obviously another one of these very resilient stocks. If you’re looking for a place to take in some shorts, but you want some longs in the portfolio, if this thing recovers, it’s these bigger things doing better. And last week was a good example of thi.s there’s risks all throughout the market. And this is why I keep mentioning is, hedge, the portfolio, gets some exposure to the short side, and we’ve seen a lot of that volatility creep in. But especially coming into this volatility, is you want to be ahead of it. You want to have positions already on you don’t want to be seeing the volatility and then trying to manage something. And you’ve seen how VantagePoint has gotten you ahead of a lot of these moves in the market.
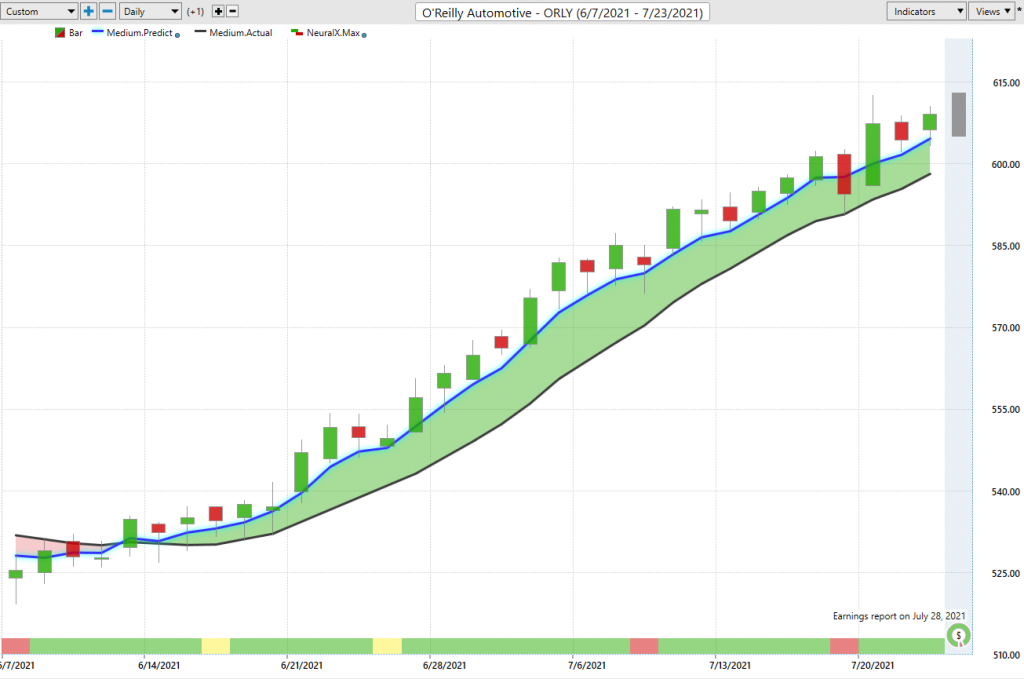
And even through difficult times of volatility, like I mentioned, it’s about the individual forecast on the markets that you’re trading. That O’Reilly is driven by a different set of factors, especially in some of these short-term windows. And it can help you understand that, “Look, that trend is still up here.” Going into this week on a forecast like O’Reilly, even with all that weakness, it has you looking to buy on a dip on Tuesday, or a Monday actually, on that dip. It’s a very strong forecast going into the day and you see that as the markets recover, that really recovers. And so it’s just been a very interesting period and hopefully illustrative of some of these situations that open up in the market and how well VantagePoint does of getting ahead of these things and helping traders really manage the situation. And be ahead of a situation like an 8% drop in crude oil, or 2% drop in the S&P, that depending on your timeframe of trading is going to have some pretty big implications on trade management and how successful you’re going to be over a week with a lot of high volatility.
So once again, this has been our Hot Stocks Outlook for July 23rd, 2021. Thank you all for watching. Best of luck out there and bye for now.


