


Welcome to the Artificial Intelligence Outlook for Forex trading.
VIDEO TRANSCRIPT
Hello everyone and welcome back. My name is Greg Ferman, and this is the VantagePoint AI market outlook for the week of July, the 25th, 2022.
Euro versus U.S. Dollar
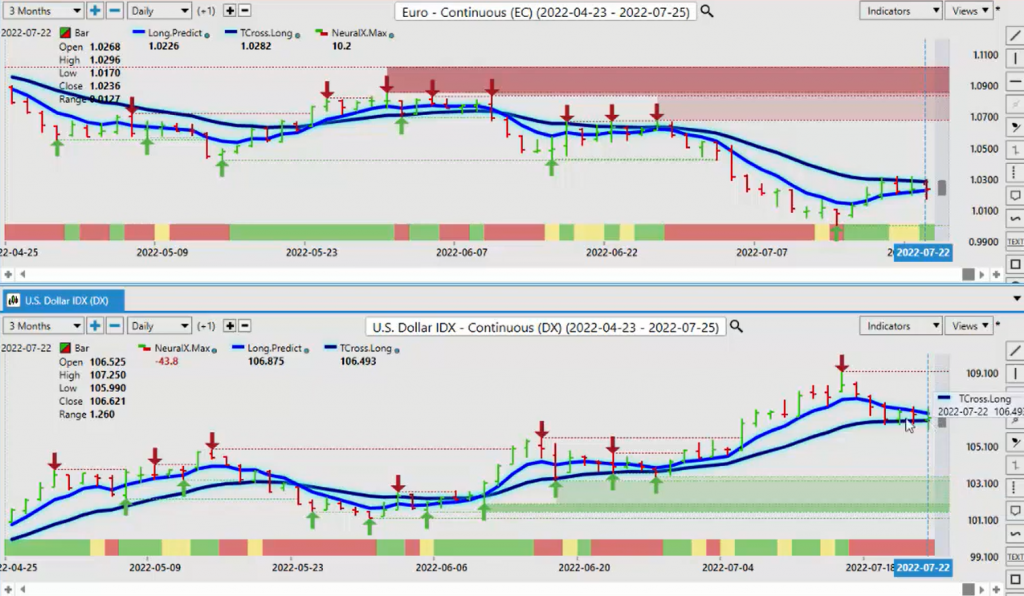
Now to get started this week, we’re going to look at some direct Intermarket Correlations and where we’re currently at with things. Now, once again, Intermarket Correlations do change over time. I don’t dispute that. I’ve never stated otherwise, but what we will do is look at what these current intermarket correlations are and some that simply don’t change. One of those is the Euro currency to the US dollar. Now, if we look at this past week, we can assess here, the dollar was unable to make a sustained break of the T cross long at 10649, which was the retracement point that I discussed in last week’s weekly outlook. We can see that the Euro did not go below parody. Excuse me. Like a lot of analysts were calling for 95, 96, 97, where I had stated that we are likely going to retrace back based around those VantagePoint indicators we looked at last week.
But as we can further assess not only were longs good, but shorts were also very good every single day last week as we couldn’t break that, but the inner market correlation between the dollar index and the Euro currency, whether it be the future or the Euro, US payer is 99.9%. This inverse correlation does not change.
U.S. Dollar versus Canadian Dollar
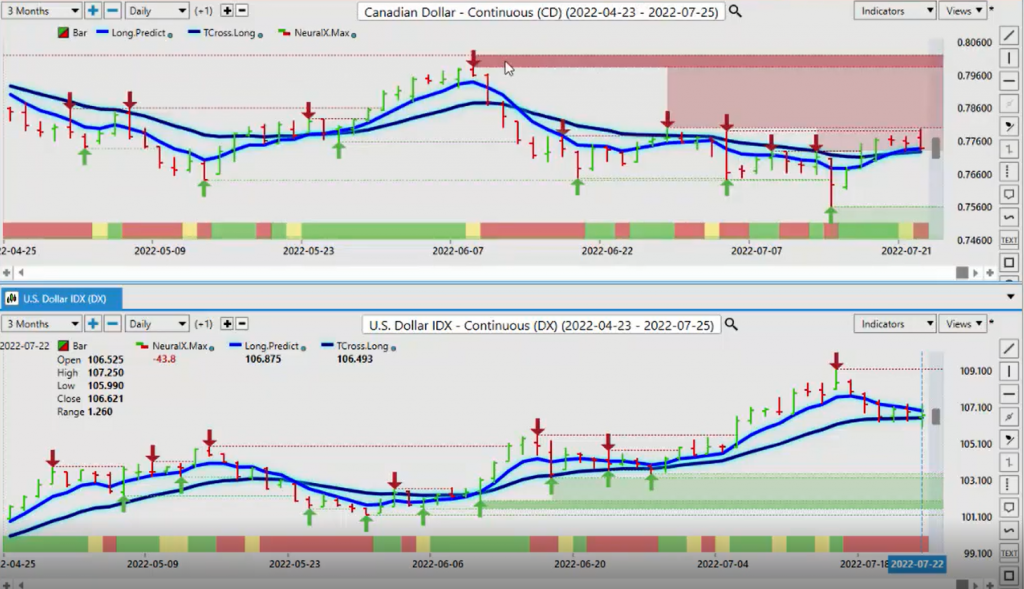
When we look at it currently to some of the other currencies, the Canadian dollar, this one is slightly different because it makes up a very small portion of that dollar index. But you can see here that the Canadian dollar, even though the dollar index is held that key support level, the Canadian dollar didn’t, it came back up to a verified resistance zone, but it’s stalling right around this particular area. But we can see that the Canadian dollar moved in the opposite direction.
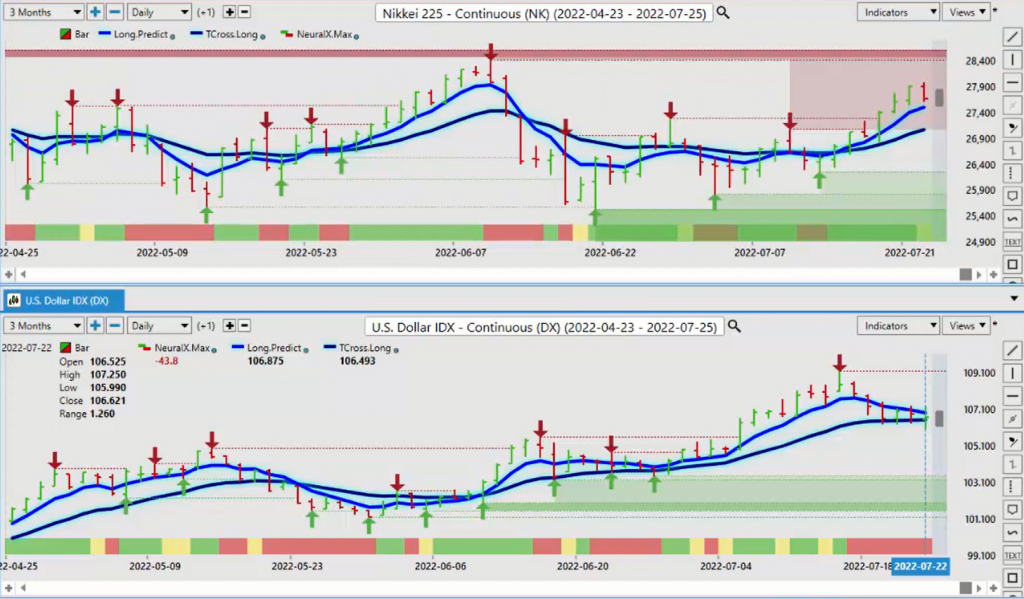
The Nikkei 225, this one often is very much an inverse correlation, meaning one up one down.
Nikkei versus U.S. Dollar Index
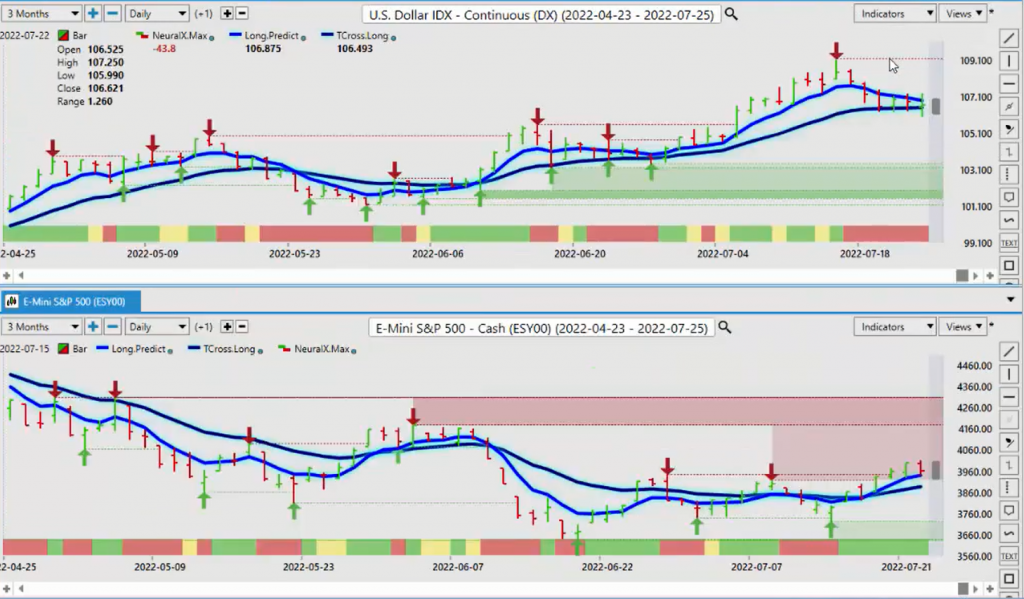
S&P 500 Index versus U.S. Dollar
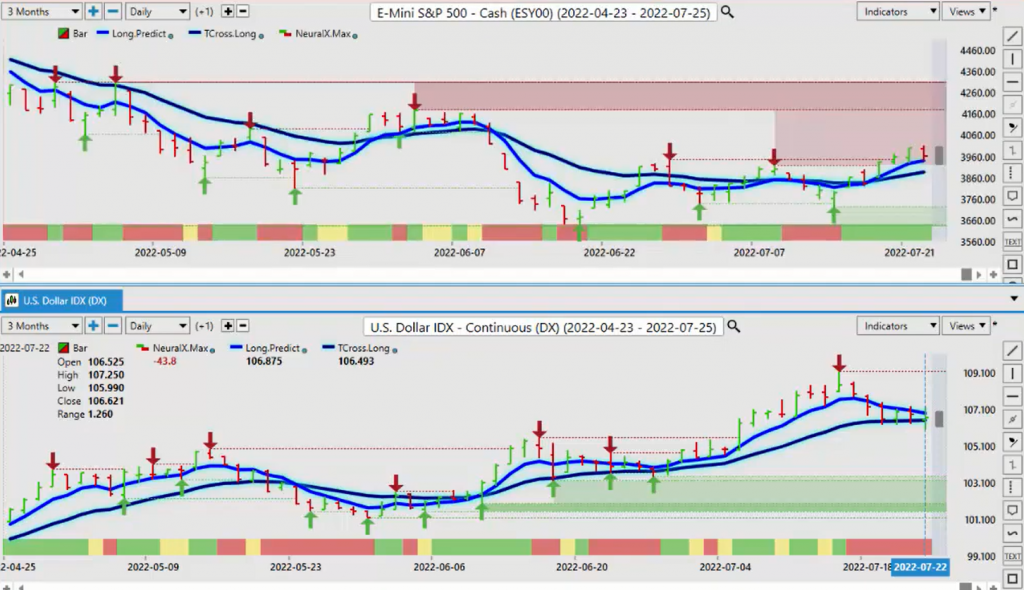
But the big one that we really want to look at here is the S&P 500. Normally, we would see an inverse correlation. There’s times at the beginning of the month where the S&P and the dollar index can go up and down together. Same with gold, because you have real dollar demand at the beginning of the month where the other asset class, whether it could be the S&P 500 oil gold, et cetera, that could be in an up trend or a down trend. And it simply follows that. But when we look at it right now, I would argue from last week, this known direct inverse correlation between the equity markets and the dollar index was again, pushing the SNP 500.
Now this can continue. Then we would look for further dollar gains, but if the dollar continues to hold along, this level, that would tell me, stocks would be moving lower or vice versa.
British Pound versus U.S. Dollar
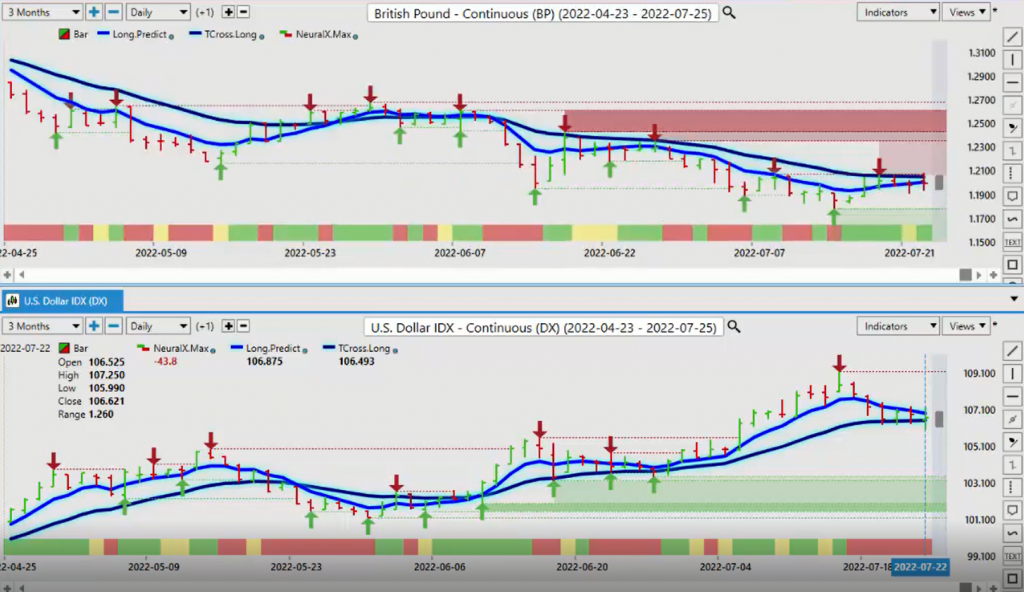
When we look at the British pound US dollar, we can see that’s very similar to the Euro currency, where we’ve come up to that VantagePoint T cross long. And we have repeatedly failed along this line, but when you split your screen like this, you can really see that.
Japanese Yen versus U.S. Dollar
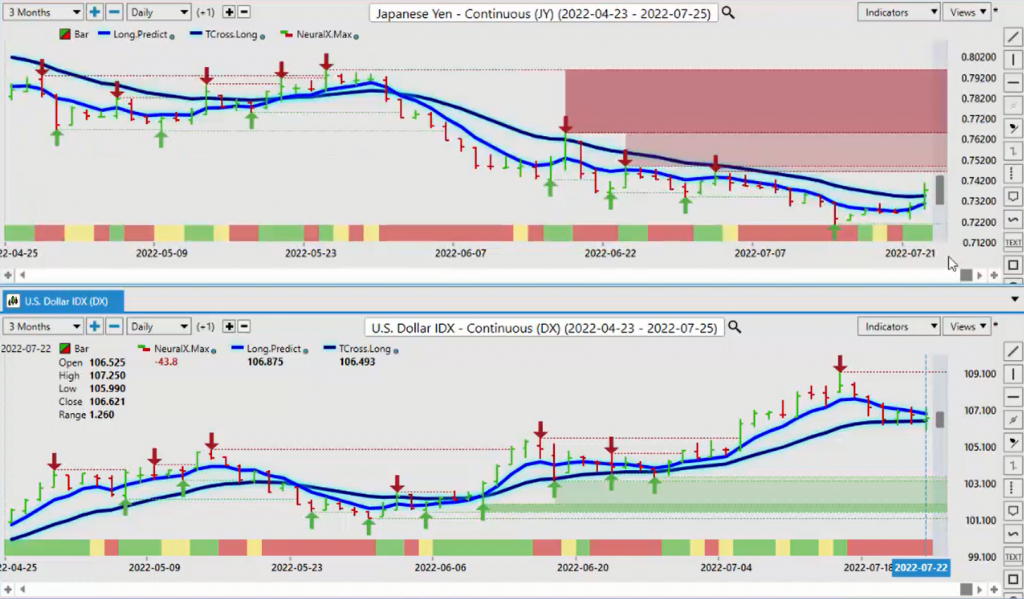
Now the yen being the carry trade is weakening, but even the yen strengthened against the dollar last week that showed up in the dollar yen pair, just like the Euro, US, the dollar weakness showed up in the Euro, US the pound dollar. But once again, we would need a continuation of this. When we look at gold, we can see gold as the very second the dollar started to lose momentum, gold flat lined and started to move higher, but you can see how pronounced this is with the equity markets, the exact day and time that essentially the dollars started falling here. The very next day, the SNP 500 starts to move higher. That’s a very, very strong Intermarket Correlation.
Australian Dollar versus U.S. Dollar
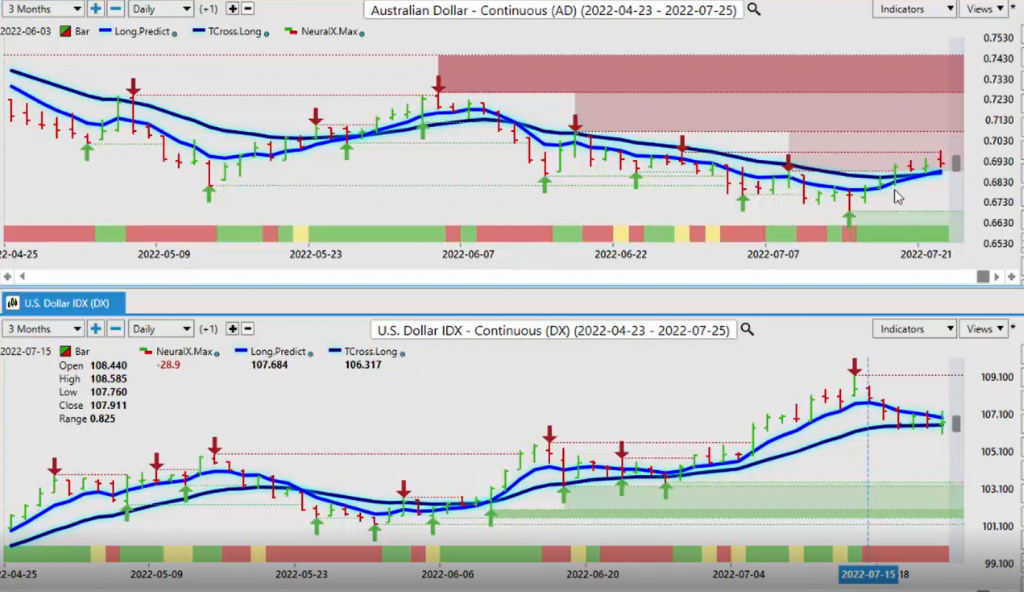
Now, the other currencies that did do very well and potentially could be trend changing, the Aussie dollar. We had a break above our T cross long, and we continued to advance even though the dollar held its ground.
New Zealand Dollar versus U.S. Dollar
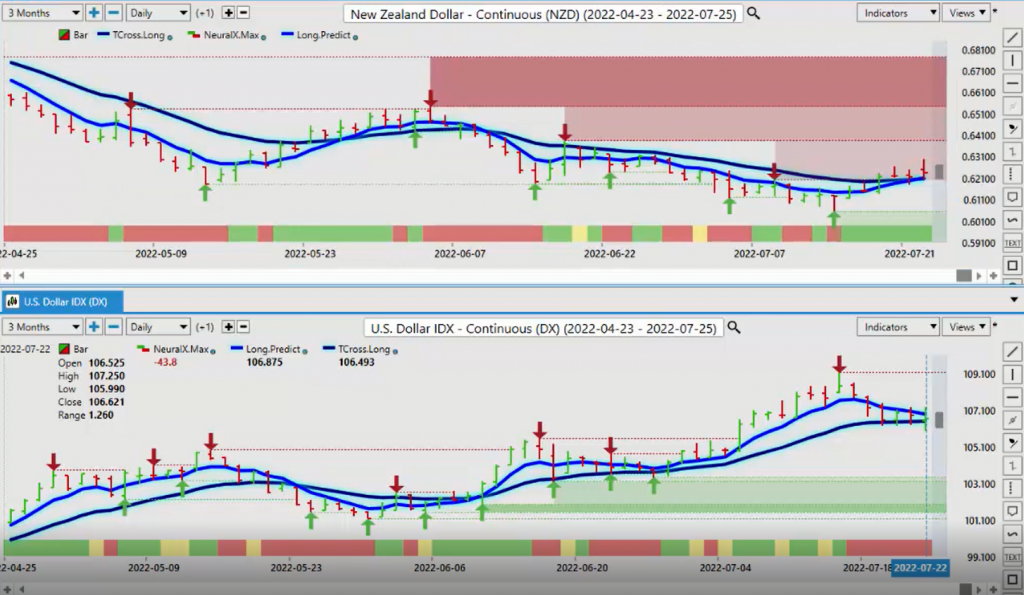
I saw the same thing with the Kiwi last week. And with my own direct clients, again, we were buying heavily into the Aussie, the New Zealand and indirectly with the pound in the Euro, but we can see that strength is not the same and this is why it’s good to use the long predicted and the T cross long because the T cross long is the line in the sand for us. The dollar, if we can close below that for two days in a row, we would look for dollar losses potentially down into this lower range around 103 42, but in the week of the fed, I think that’s very unlikely that we’re going to have aggressive sellers until we get past that major event risk.
S&P 500 Index versus U.S. Dollar
Now, where you can really see where I’ve talked about this in the past repeatedly is if we use something like the S&P 500. When I’ve talked about the equity currency pairs like the Aussie US, New Zealand US, US CAD, they’re not just commodities guys. They’re very highly correlated to the equity market. So, when we look at this from last week, starting with the Kiwi, the New Zealand dollar, we can see that as the SNP 500 started to turn higher. The New Zealand immediately followed that when we look at the Euro, even from last week, this has been a very mixed correlation over the years, but it’s 80%. The Euro has been correlated to the SNP 500, 70 to 80%. It’s not a hundred percent like the dollar index to the Euro, that inverse correlation, but it’s similar. So, when we look at this right now, you can see as the SNP 500 moved higher, even the Euro responded positively to that. But when we look at the Aussie currency, you can see that these were stronger trends using the SNP 500 as the inner market correlation to gauge that.
So the question would be, which one was the leading indicator? I would argue the S&P 500 was the leading indicator. And these other currencies simply followed the Canadian, the US Canadian payer, or the Canadian futures, whichever you would like, you can see that as stocks moved higher, the Canadian dollar futures, which this is the US Canada payer defined guys, right? Essentially if the S&P 500 is going lower, then usually US Canada is going higher and vice versa. So, that is verified last week, what these direct inner market correlations. And again, these are correlations that have stay in the test of time. They are not always going to be a hundred percent positively inversely or correlated.
Very much like with the bull bear gauge, the bull bear gauge, which I worked in collaboration with VantagePoint on. You measures inner market correlations from the monthly, the quarterly to the yearly and again, because they do change and they change on a month-over-month basis, but they also can be a lot choppier when the correlations move back to what we normally would be accustomed to. So, now that we’ve looked at some of these direct inner market correlations, then we can open up our main portfolio and say, “Okay, now we have a better understanding of what to expect.” Now, over the last three or four months with war in the Ukraine, the fed aggressively hiking, which they will probably do again this week, but in my respectful opinion, only the way I look at the way the fed is hiking or getting ready to hike. Every time they hike, they’re one step closer to a cut.
And again, only in my respectful opinion, that’s the way I would look at this because the fed is laid out to plan for rate hikes. It would not surprise me one bit. If they start either stop hiking or cut by the first or second quarter of 2023. So again, the way my mindset would look at is, again, any of these big rate hikes is a means to an end, because again, I don’t think the economies are going to be able to withstand a lot of aggressive hikes.
U.S. Dollar Index
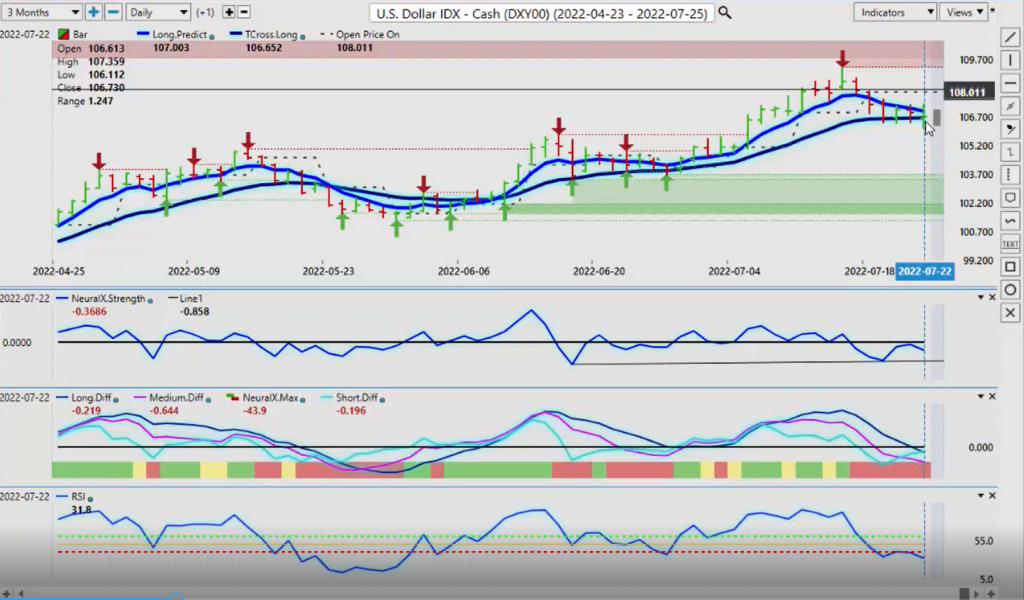
So right now, when looking at the dollar index that T cross long is a very strong pivot area, continues to hold at 106,65. I believe we will see dollar buying this coming week, at least until we get past the fed. But again, I would anticipate without having this particular level and understanding that this level is a pivot, we don’t have a crossover. Or actually we do have crossovers on the short, medium and long term, but again, using the predicted moving average is a pivot level to say, “Okay, my line in the sand.” Before I’m really going to start getting aggressive buying Euro US, buying pound dollar, buying Aussie US, those Intermarket Correlations I just showed you, number one, I need stocks going higher, and I need the dollar to break down below this.
So, we know this level, we can study this level this week. 106,65, if we get a sustained break of that will trigger further dollar losses, right? Our indicators are mixed, but they’re saying that it’s still, the VantagePoint is forecasting we’re going down. Now, when we look at gold, again, we can see that as soon as the dollar started to turn last week, if we count our days back, as I talked about last week, even just using the weekly opening price, we can see that the low point for gold last week was down around the 1700 mark. We took a little bit more of a dip, but then completely recovered on Friday. But overall there was pretty good buying opportunities.
Once again, when we back this out and we remove the short term viewpoints, and we start looking at longer term.
Gold
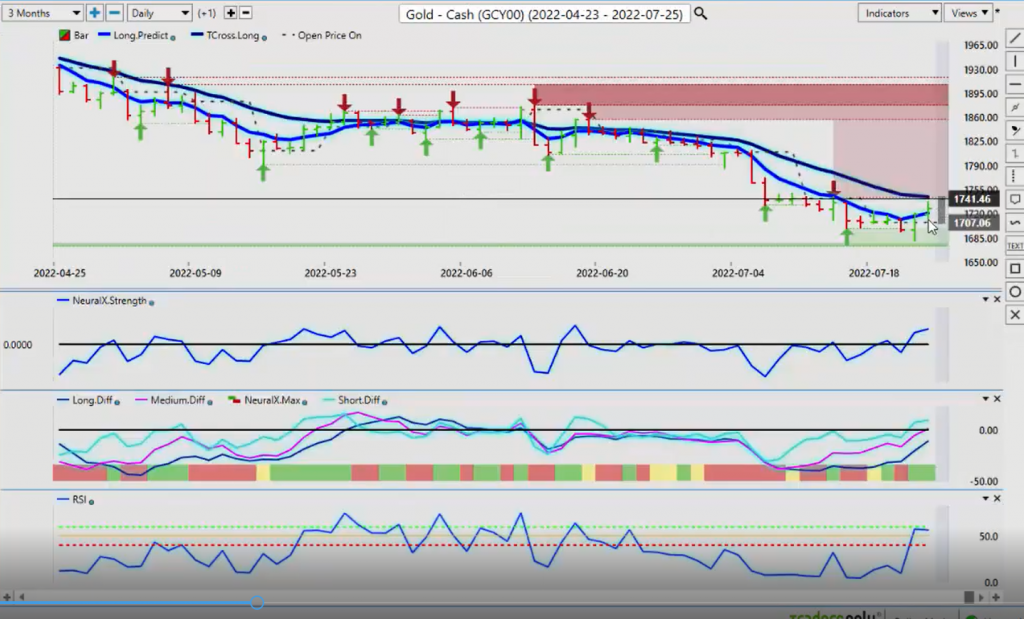
As I discussed last week, I used the monthly chart in the VP software to identify the range bottom and gold, where you can see, we had clear buyers coming off that low point as I discussed last week, 7,16,77,16,75. We come down, we hit a low down around 16,81 and up we go.
So again, I don’t know that it’s going to be a great week for gold here, because once again, you’ve got those fed minutes. So in most cases, it’s a question of buying the rumor and selling the fact. So, we won’t get the fact until Wednesday going into Thursday trade. So, right now gold is recovering or it’s retracing back to the T cross long at 17,44. It’s likely to fail there until Thursday or Friday of next week once we get past the fed.
Crude Oil
Now with light sweet crude oil, once again here, you can see the same thing. Overall, we’ve put a bit of another bottom back in here using the verified zones that’s coming in at 87, 61, but this is a level that we hit back over here in April the 25th. So, as the market comes down, sells off to that, it hits the verified zone to the number, and then mysteriously bounces back up. But once again, you can see that the setup, and again, we need to get past this VantagePoint T cross long.
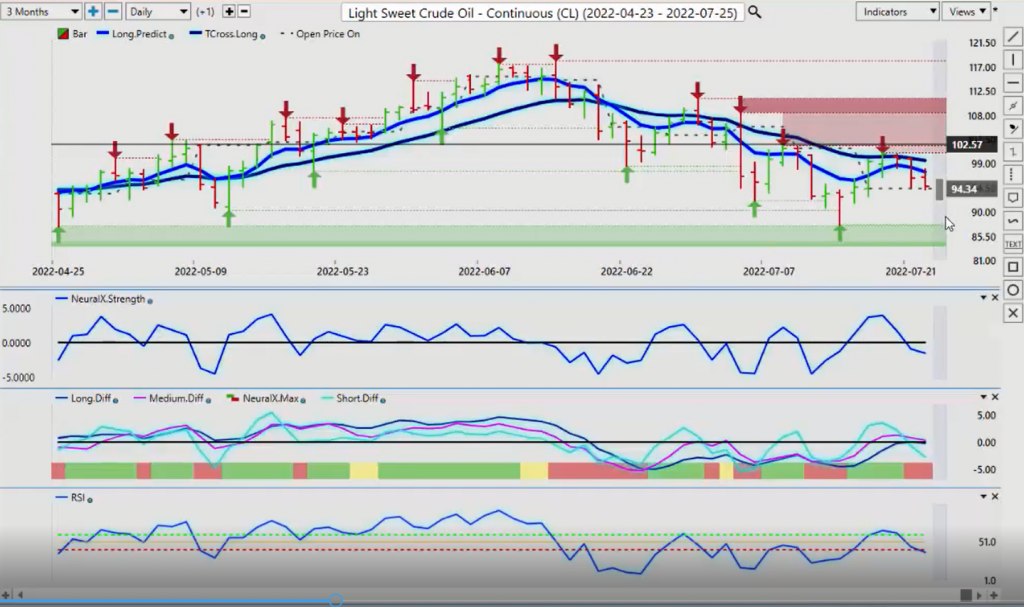
Once again, if we look at that dollar index, it’s actually could be indirectly the inverse correlation there, that’s not allowing oil past that level. So again, we’re failing at the T cross long. Coming off of that again last week, that high coming in at 99, 99, we don’t at the current time, we have very few buyers above a 100$ a barrel. And you remember the most of the analysts were saying were supposed to be right now at about 150, 160, a barrel, that did not come to fruition at all.
But again, we used that critical VantagePoint predicted moving average is a medium to longer term pivot area to tell us whether we’re bullish or bearish.
Very, very important here, guys.
S&P 500 Index
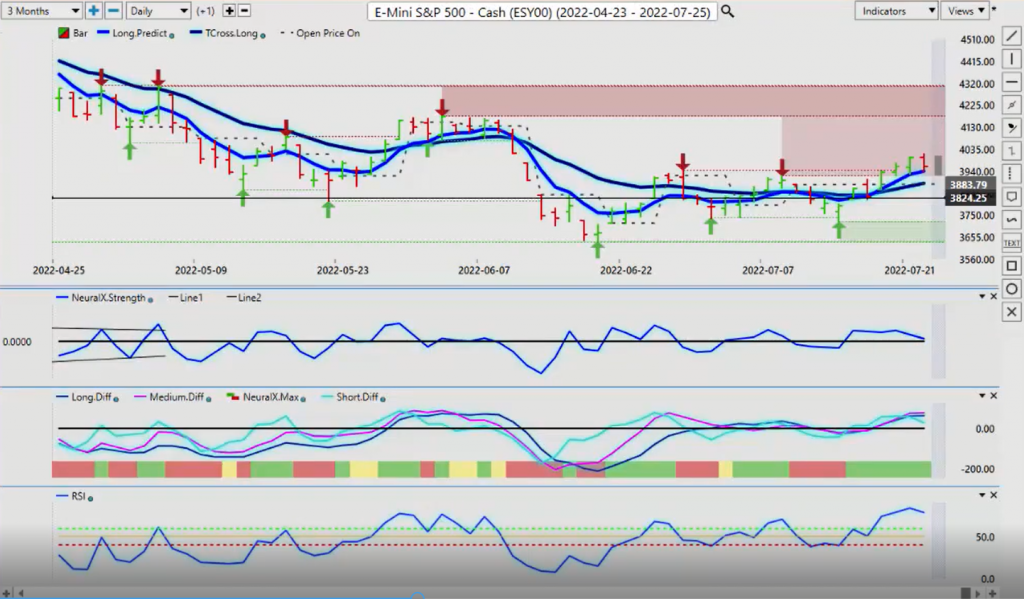
So again, looking at those stocks more specifically, I will look at the broader stock market by using the S&P 500 to gauge how the global indexes, stock indexes are doing. So, we’ve had a little bit of a push here above the resistance point high of 39, 45. I think we got to around 4,000, but ultimately we’re likely to see some type of retracement this week with the two levels we would use 39, 41 and 38,88. Now, if the S&P 500 does pull back, then you can expect US Canada to go higher, Aussie US to go lower, New Zealand US to go lower, Euro US pound dollar, those to go lower.
This is how the game works here guys. Intermarket Correlations, again are not a hundred percent, but I’m trying to work through to assist everybody and how to weave through it all, but the main ones are the dollar index, oil, gold, S&P 500, Bitcoin. These are your top players here. So, right now oil is… The S&P 500, excuse me, is mildly bullish. But the indicators, the slope of the neural index, the predicted differences are starting to flatten out, and the RSI is losing momentum up here. So again, going into that fed announcement, unless somebody leaks the information, it’s unlikely we’re going to see a big push in equities by Wednesday. Probably a selloff, at least to the 38,88 level.
Bitcoin
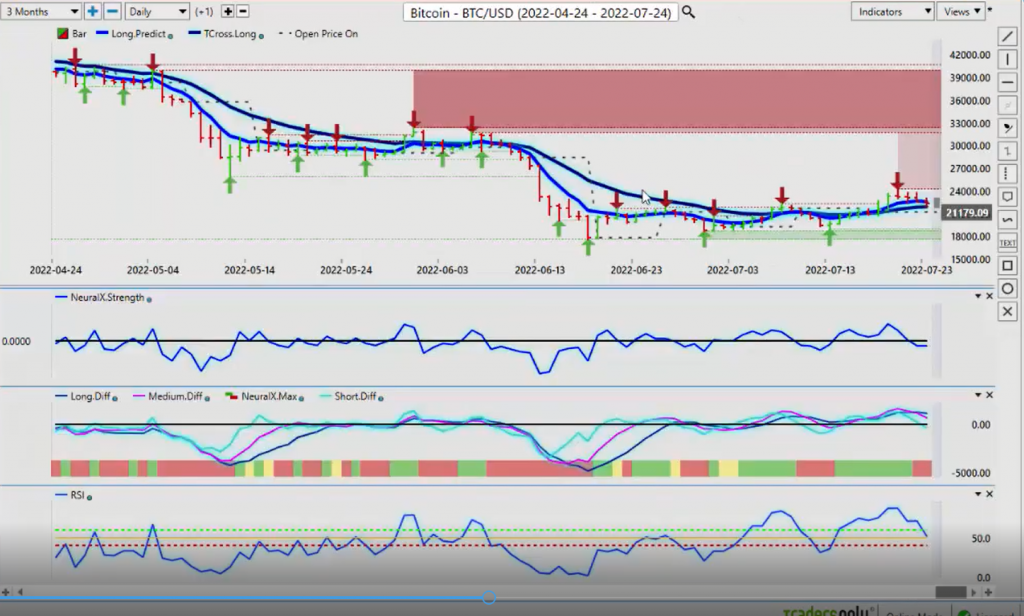
Now, once again, with Bitcoin going into next week, we’ve had another push higher, but we’ve also got another newly formed verified resistance zone.
Now I’ve been a strong advocate to ignore some of these pundits that are telling you, the same people that are saying to get aggressively long in the US dollar are saying that don’t buy Bitcoin. But once again, we’ve had a heck of a rally on Bitcoin. And I use the argument here that in most cases, since 2018, at least I’ve been buying Bitcoin at two specific times. The end of July is good. And my favorite is mid to late September until about early November. And then I go out of it again, so I can see that seasonal pattern there. But once again, when we’re looking at this for now, we’re coming back like a moth to a flame to, again, the T cross long 21,949. We’re looking to hold above this. If we can’t hold above it, then we’re likely pulling back.
Euro versus U.S. Dollar
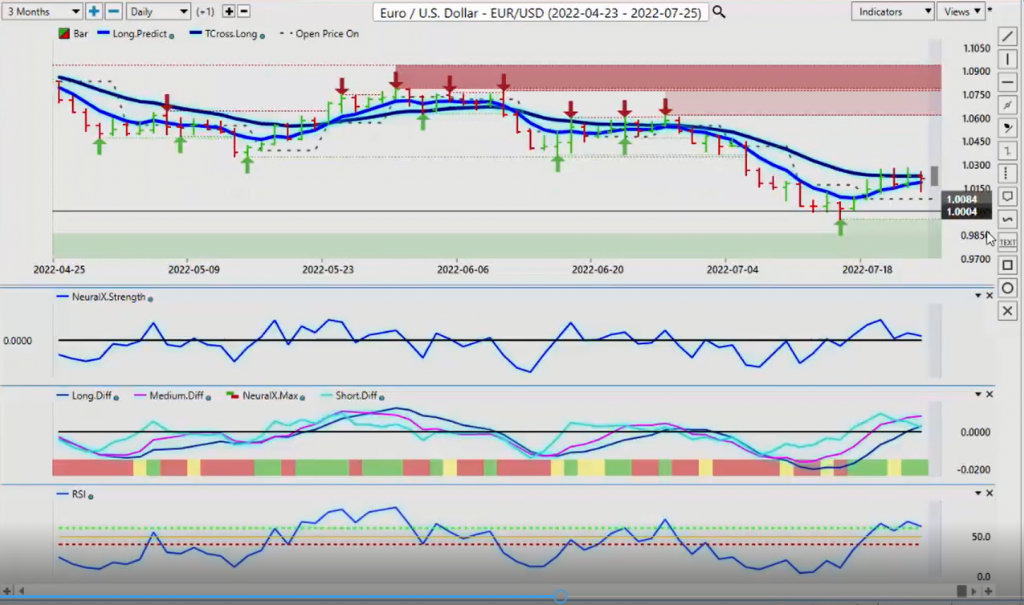
So again, another potential warning sign of some dollar strength next month. Now, again, now that you’re armed with the knowledge of how Intermarket Correlations work at the current, at least at the current time, we can see that the Euro is once again struggling at this T cross long at 102,30. Now the ECB did hike this past week, and it did help boost it up. But again, in most cases, whether it be Australia, New Zealand, Canada, the US, in most cases, the currency is actually sold off after the hike.
So, again that by the rumors sell the fact theory still holds ground. Now, in this case, again, the predicted differences are strong, our neural index is a little shaky here, RSI also a little shaky, but once again, it doesn’t matter whether you’re a bull or a bear here, guys, we can identify the critical level at the T cross long. We did close slightly below that, which is a slight positive for the Euro. But on a Friday, we want to take that with a grain of salt.
So, we need a clean break, but either way, the majority of the price action next week is going to gravitate around this level 102,30. So, you can short into 102,30 or you can have a buy limit order ready to go at around 102,50, but that’s a little shaky too, because you can clearly see by studying price action. And I am a strong, strong advocate of price action trading with Intermarket Correlations that you can see that we’re not, we have zero buyers at 102,73. So, be careful of a pop slightly above there in intra day trading, and then a hard slam lower, because that’s actually what we saw every single day.
Last week is a bump up to 102,60 and then a sell off to 10,80, then a spike back up, back down. So, even though the Euro moved X amount of pips per week, you can actually take more out of the market by trading in this particular fashion. But again, if the Euro is any sign of life here, we must break and hold above this critical VP level. Now the US Swiss Frank, very briefly with this one. Again, we’ve got a crossover down, as you can see here, but that verified zone and the bulk of these losses occurred on Friday, which is always concerning to me. Whenever I get a big move on one bar at 90% of the time, I will not bite until I get back up towards the long predicted in the T cross long. All of our resistance is at 96,85 and 97,10.
The primary indicators are still pointing down, but ahead of the fed, I believe this pair will flat-line and potentially start to turn back around. But once again, I don’t believe the dollar has long term strength here. Once again, my view, the way I’ve seen this particular type of rate hikes based around media noise and everything else, every hike gets us one closer to a cut or a pause, neither of which benefit the dollar.
British Pound versus U.S. Dollar
Now with the pound Great Britain US, once again, as for the Intermarket Correlations, I showed you just briefly here every single day, we’re banging into that T cross long. And one of those days that we close above that, there’s still has a bearish undertone to it. However, the predicted differences are pointing higher. The predicted RSI is saying we still have a bit of momentum. Neural index strength is not horrible, but it’s not good either. So once again guys, we’ve got to break through these levels here. That lingering verified zone at 120,54, most of your price action to begin the week up until Wednesday is going to gravitate towards that level.
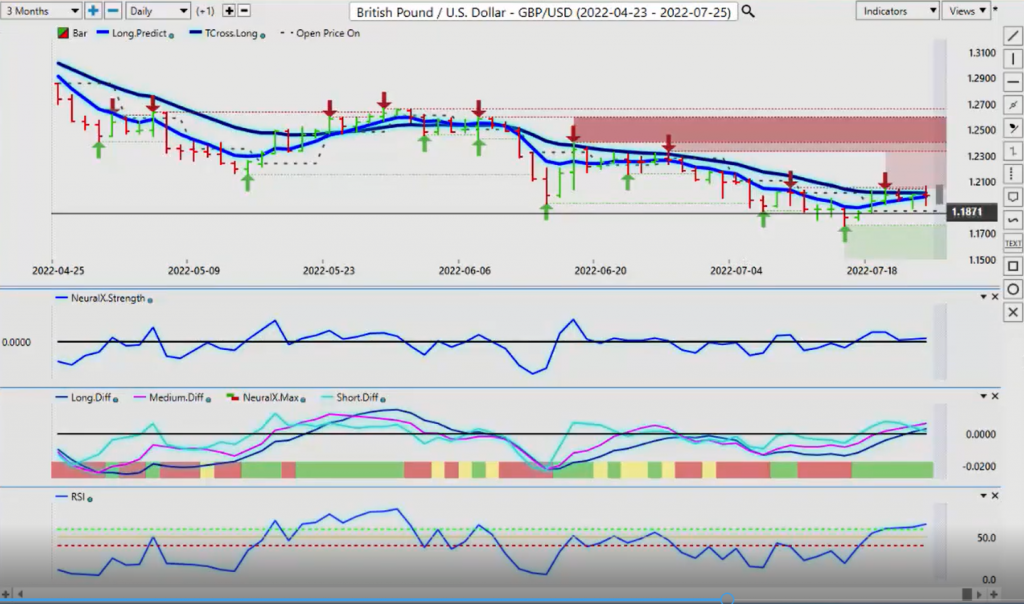
I believe the sellers are still in control here until such time as we get a clean break of the VantagePoint T cross long. Again, just helps simplify trading, not waiting for a crossover, not focusing too heavily, but using the indicators, combining the indicators together and then applying it to a line in the sand and saying, “Okay, we’ve got to break above this. If we can’t, then no. I’ll go long, maybe down here with our range, but current range low at 117,60, but longs are very dangerous up around the one 20 area. So be careful with this one. We need that break. If it breaks above 120,54 stays above 120,54, we should be good to go for a much bigger move.” But my optimism on that at the current time remains heavily, heavily guarded.
U.S. Dollar versus Japanese Yen
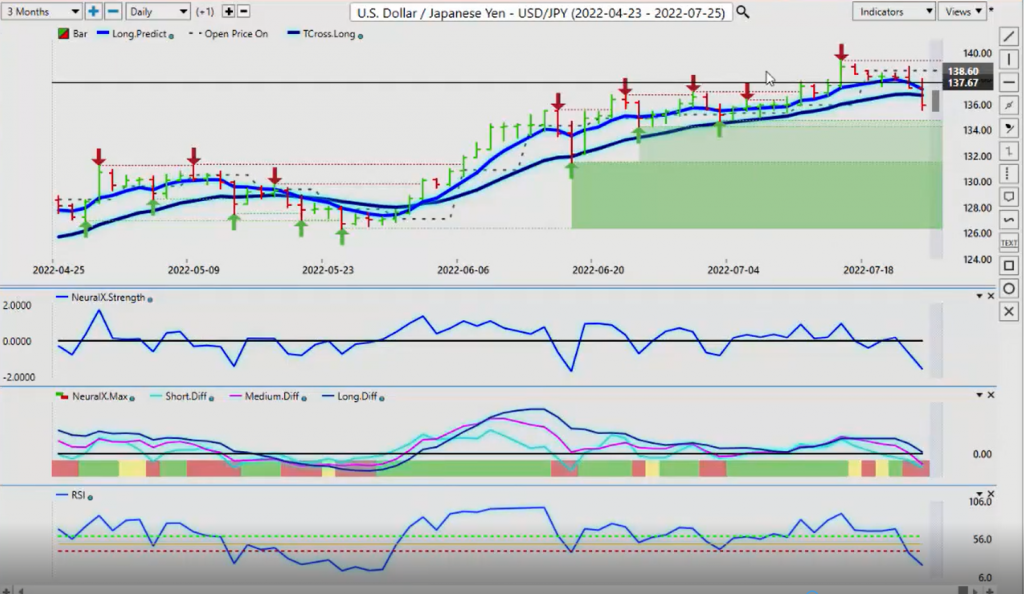
Dollar yen, again, the dollar taking a bit here. This is a good place of value last week to dump dollars, right? And because this is grossly overvalued to begin with, but we still need two days crossing under this particular level. The T cross long 136,69, this is the level to keep your eyes on. The VantagePoint indicators are saying we have more downside. The question is how much more downside?
And the week of the fed, I believe that’s going to be limited to the 134 area. We’ve got two verified zones down here, 134,27. I think the buyers will take a little breather here and they’ll look to pick up a discounted rate down around this particular area. But if we lose that area too, then the dollar yen will fall more in line with where it should be. And my respectful down and around at least the lower 122 area. But I think we’re months away from that. Especially if the fed hikes even further, then the carry trade grows more participants, right?
U.S. Dollar versus Canadian Dollar
Now with the US Canadian payer, once again, just too much for it up here. Once again, what I like to do on Mondays is identify my top and my bottom. That gives me a high point to sell from and a breakout point to sell from also on the lower side. But we have very, very stiff support down here with the verified zones coming in at around the 128,20 is actually where I would put it. And that’s this bar right here, where we got down to about 128,23, be careful of a bear trap here. It’s all worn, because again, we’re going into the fed. Yes, the Canadian data was hot, but it wasn’t. So, now we’ve come back up and re we’ve retested our high, our T cross long coming in at 129,38, 128,938 is the level we would need to break above this.
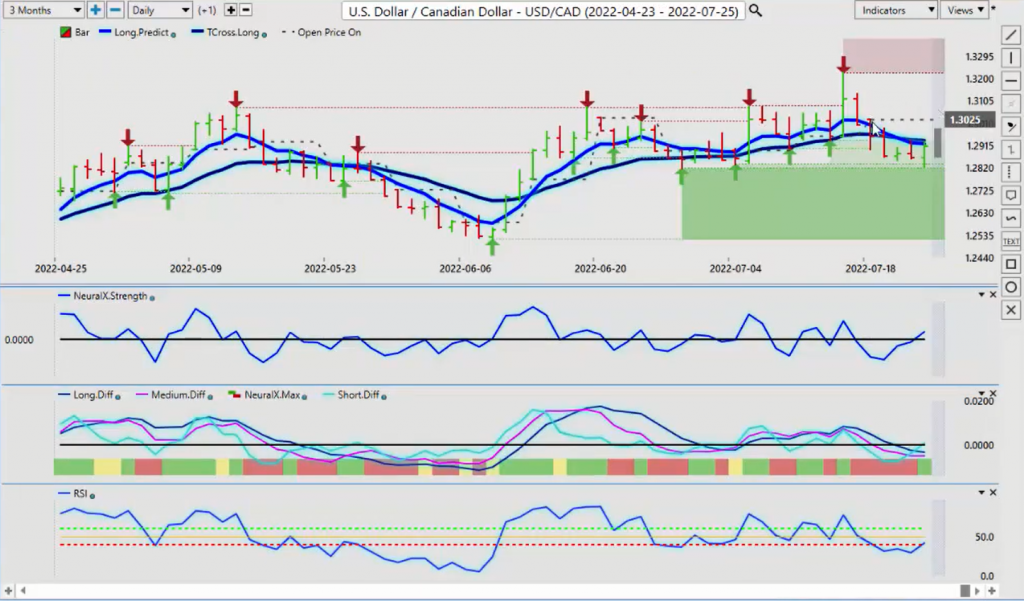
The one of the triggers that I would strongly advise. If you’re trading this pair, you are trading oil and you are trading the SNP 500. If oil and stocks come lower, that will be too much for the CAD. We saw this a few weeks ago when we hit this high, after the fed announcement on the Thursday, stocks plunged, oil plummeted down into the lower 90, $92 a barrel or something. And the CAD just couldn’t take it. And it took right off. So just remember real time Intermarket Correlations matter. So, if we can break above that, we’re good. But also if stocks do continue to advance, then US CAD could very well break down below 128,20, but as long as you’re armed with knowledge and you know your levels, then you can act accordingly, whether you’re a bull or a bear.
Now with the Aussie US and New Zealand US, once again here guys, the Aussie and the New Zealand are very much at the current time correlated to the SNP 500. So I would advise to strongly keep an eye on that. And this failure we had on Friday could be a warning sign that stocks are getting ready to go lower. And if they do Aussie and the Kiwi will follow. So right now, we can see that we’ve got a sloping angle down on our neural index strength. We’ve got a cautionary signal from the neural index itself. Our size flat lining predicted differences are also flat lining a number of things worn that this could be going lower. And this was a corrective move higher, not a new trend.
We saw the same thing around March. Excuse, May the 25th. It always seems to happen around the end of the month. And you get this short term rally until about the beginning of the new month. Then the dollar cycle kicks in with that strength and down it goes, right? So, be cautious of that. The same thing with the Kiwi, we’ve had a nice push from last week as we expected. And we actually had a stronger push, much stronger in the Aussie, the CAD and the New Zealand, which I showed you at the beginning of the video, then we actually did with the Euro or the British pound. So, if we’re looking for places to sell dollars, these can be some of your more safer choices. So with that said, this is the VantagePoint AI Market Outlook for the week of July, the 25th, 2002.


